Research Methods (2) - Descriptive Statistics and Exploring Data
1/54
There's no tags or description
Looks like no tags are added yet.
Name | Mastery | Learn | Test | Matching | Spaced |
|---|
No study sessions yet.
55 Terms
Population
A group that shares a common characteristic of interest for the research question.
Sample
A smaller group of members from a population selected to represent that group.
Central tendency
A value that represents a typical score in a data set.
Dispersion
A value that describes how spread out a set of data is.
Standard deviation
The square root of the variance.
- the most popular measure of dispersion
-represents the average deviation of scores from the mean
Outlier
A data point/observation that differs significantly from other observations.
Kurtosis
Describes how pointy or flat the distribution is.
Experimental design
Systematically manipulating one variable to observe its causal effect on other variables.
Between subjects design
Participants are randomly assigned to different conditions or groups.
Within subjects design (repeated measures)
Each participant takes part in all conditions.
Quasi experimental design
Between groups design where participants are not randomly allocated to different conditions.
- ivs we cannot directly manipulate e.g gender
parameters
describe populations e.g mean of a population
statistics
describe samples e.g mean value of a sample
population
-The measurable quality is called a parameter
-The population is a complete set
-Reports are true representation of opinion
-Contains all members of a specified group
sample
-The measurable quality is called a statistic
-The sample is a subset of the population
-Reports have a margin of error and confidence interval
-its a subset that represents the entire population
measures of central tendency
mean, median, mode
mean (most sensitive)
arithmetical average, sum of scores divided by the number of scores
median (Extreme scores)
middle score when scores are ordered
mode (least sensitive)
score that occurs the most often in the data set
when should mean be used
interval or ratio data
limit of the mean
can be a problem when outliers in data
when should median be used
if you have extreme scores, can be used on interval, ratio and ordinal data
when should mode be used
- nominal data
limits of mode
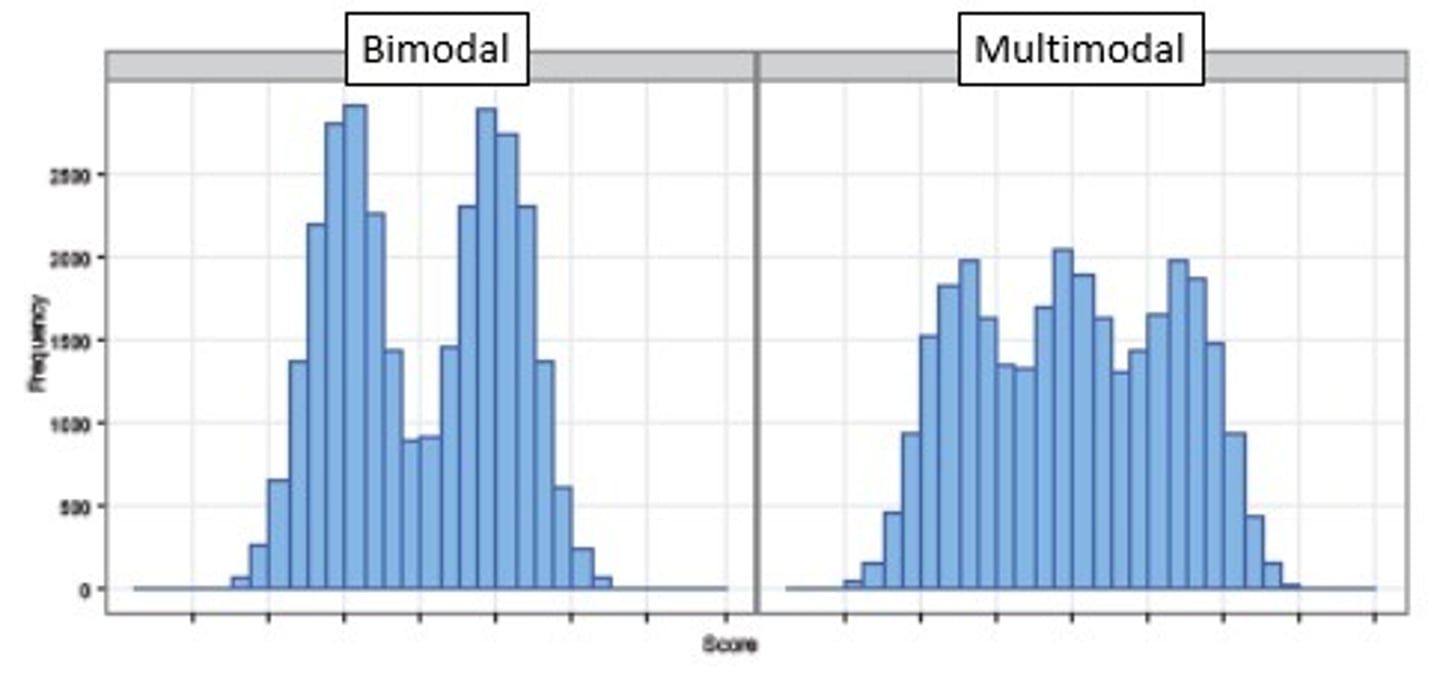
-The most common score may be at one end of the distribution
-There may be more than one mode (Bimodal distribution)
limit of measures of dispersion
cannot provide a full description of a data set
range
simplest measure of spread
highest score minus lowest score
limit of range
- only based on 2 scores
-ignores any information thats available in other scores
- very sensitive to outliers
limits of IQR
-Not based on all the observations
-The first 25% and last 25% are completely ignored in its calculation
variance
-Uses information from all scores in data set
-Tells us the degree to which scores vary around the mean
-To work the variance out we square the deviations (multiply them by themselves) -to remove negative values
Variance - sum of the squared deviations/ (n-1)
limits of variance
-Does Not describe the amount of variability in the same units as the original data (due to squaring values)
-We got an overall variance of 2.84 but the biggest deviation from the mean was 2.375
Large SD
scores are very spread out
small SD
scores are very close to the mean
exploratory data analysis
- first step after data collection
- aims to determine the main characteristics of data
- exploring data using descriptive statistics
- summarising and condensing data using graph (box plots and histograms)
histograms
-represent distribution of data
-values divided into intervals called bins
normal distribution (bell shaped curve)
- mean divides data in half
- symmetric
- unimodal curve (one peak)
- the curve approaches but never touches the X axis
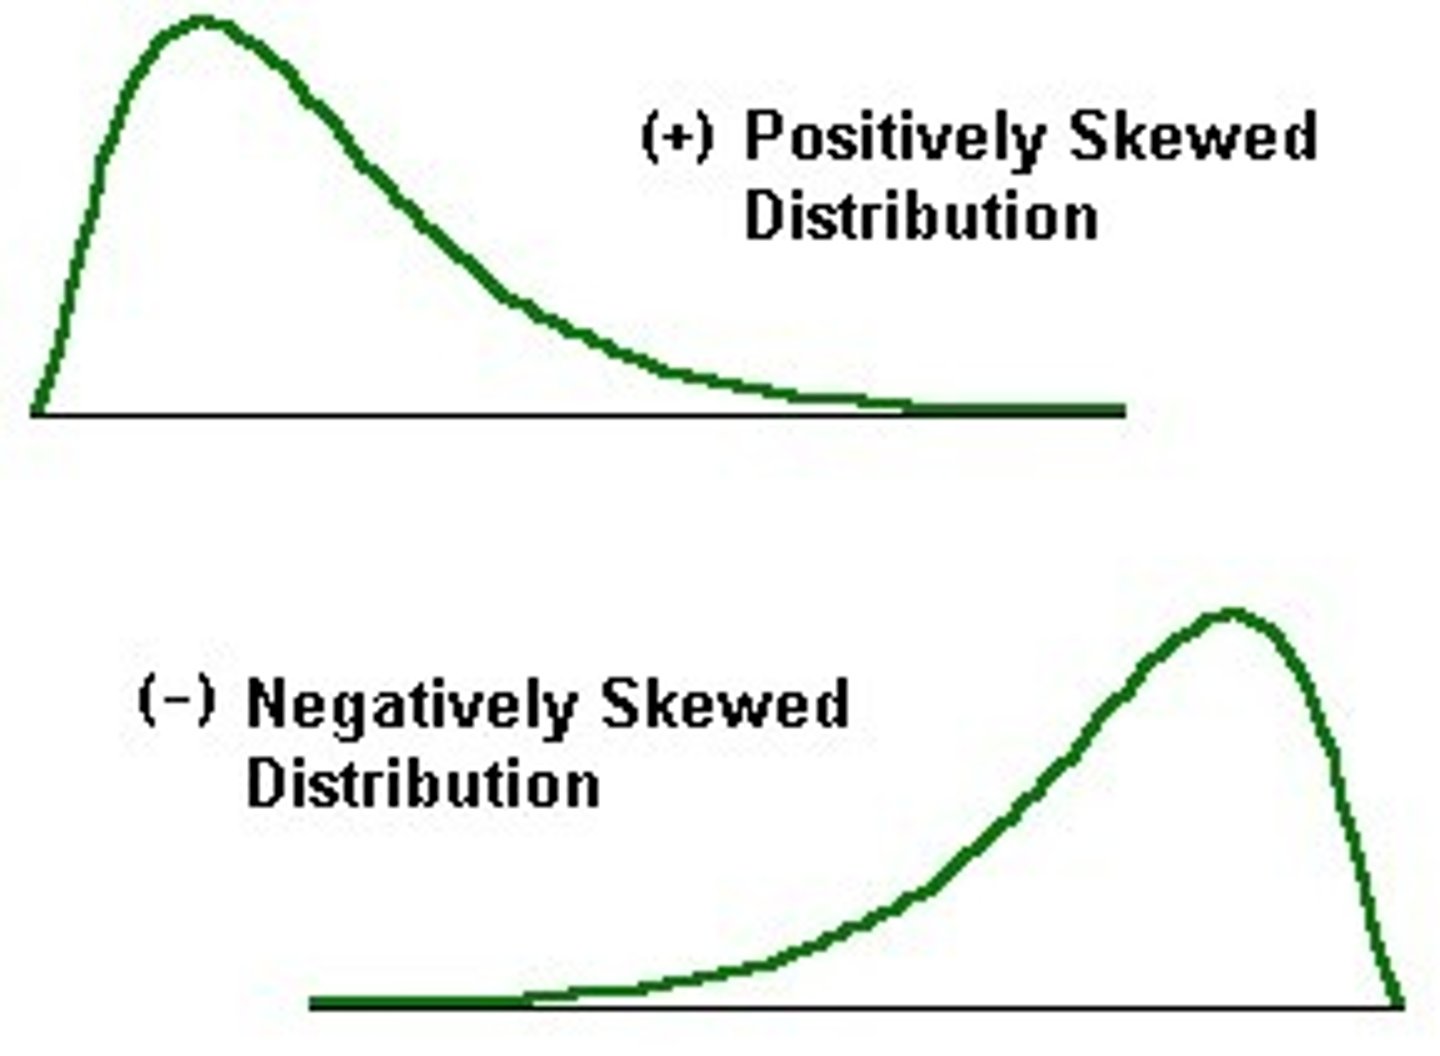
skewed distributions
bimodal/multimodal distributions
Random selection
Equal probability, unbiased selection of participants from a population.
Representative sample
A sample that accurately represents the population.
Parameters
Measurements that describe populations.
Statistics
Measurements that describe samples.
Descriptive statistics
Measures of central tendency and dispersion that summarize data.
Measures of central tendency
Mean, median, and mode that represent typical scores in a data set.
Mean
Arithmetical average of scores in a data set.
Median
Middle score when scores are ordered.
Mode
Score that occurs most often in a data set.
Range
Simplest measure of spread, highest score minus lowest score.
Interquartile range (IQR)
Range that represents the middle 50% of scores, less sensitive to outliers.
Variance
Degree to which scores vary around the mean, calculated by summing squared deviations.
Standard deviation (SD)
Square root of the variance, represents the average deviation of scores from the mean.
Exploratory data analysis
First step after data collection, aims to determine the main characteristics of the data.
Box plots
Graphical representation of data using quartiles and outliers.
Histograms
Graphical representation of data using intervals called bins.
Normal distribution
Symmetric, bell-shaped curve with a mean dividing the data in half.
Skewed distributions
Distributions that are not symmetric, can be bimodal or multimodal.