quantal dose response relationships
1/9
There's no tags or description
Looks like no tags are added yet.
Name | Mastery | Learn | Test | Matching | Spaced | Call with Kai |
|---|
No analytics yet
Send a link to your students to track their progress
10 Terms
quantal dose response curves
average effect of a drug as a function of its dose in a population of individuals
observe for the presence or absence of a response
sleep or no sleep
alive at 12 months vs not alive at 12 months
graph the % of individuals who response to each dose of a drug
used to predict the effects of a drug when it is administered to a population of individuals and for determining population-based toxic and lethal doses
types of quantal dose response curves
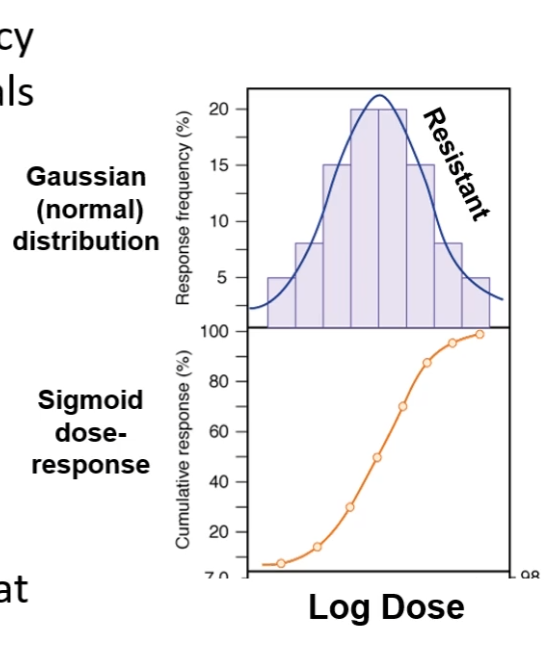
gaussian distribution
bars in frequency histogram represent the % of individuals with effect minus the % of individuals that response at lower dose
normal frequency distribution → most individuals response in middle portion of range of doses
bell shaped curve
fall to the right of the curve = more resistant to drug
fall to the left of the curve = hypersusceptible
sigmoid dose response
add together the # of individuals responding at each consecutive dose
cumulative responses
quantal dose response curves more in depth
frequency distribution of doses of drug required to produce a specified effect
shaded boxes and bell-shaped curves
the % of animals that require a particular dose to exhibit the effect
cumulative frequency distribution
open boxes and sigmoidal curves
log-normally distributed
by the time you achieve the highest dose, essentially all individuals in the population will have responded
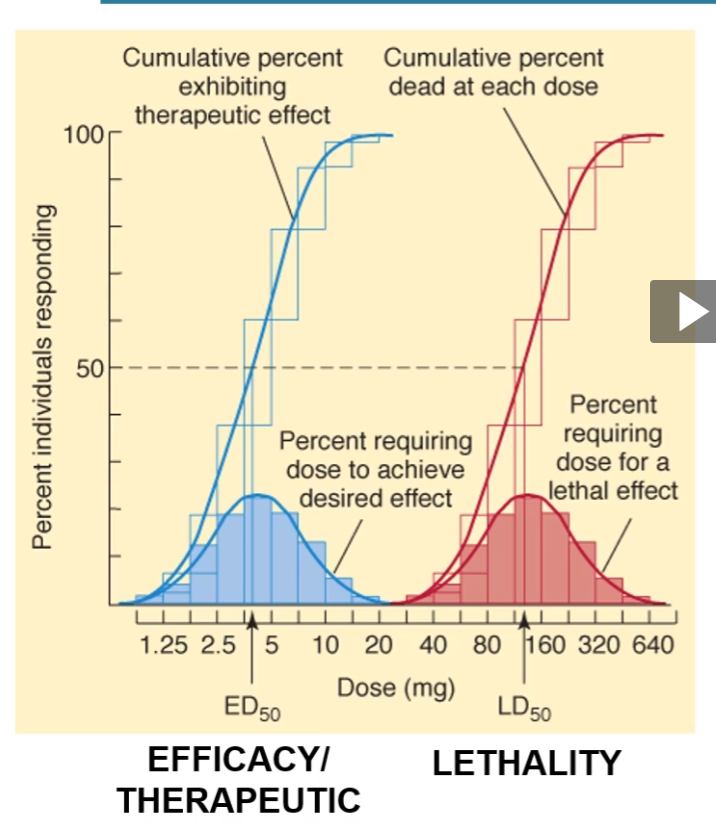
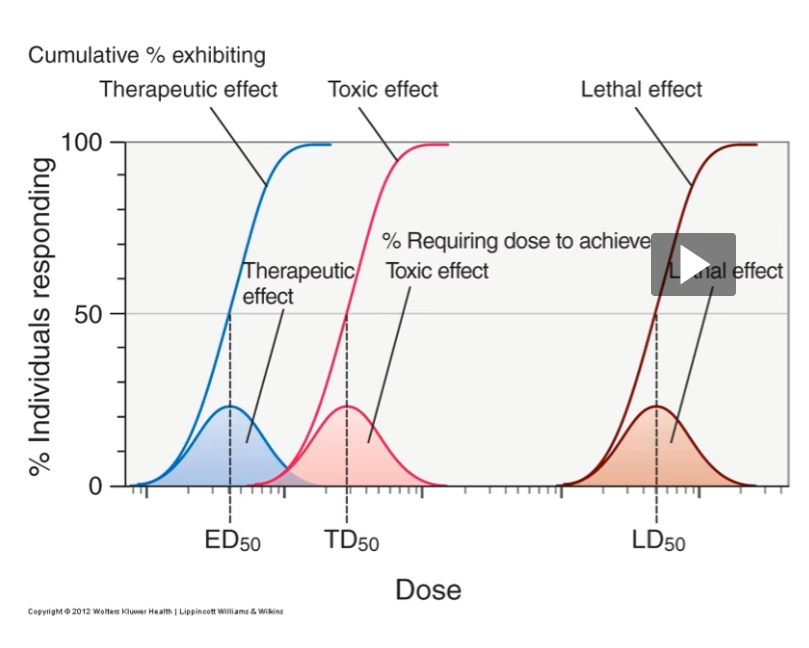
quantal dose response curves (ED, TD, LD)
ED50
dose at which 50% of the subjects exhibit a therapeutic response to a drug
remember: Ec50 is dose at which a drug elicits a half max effect in an individual
TD30
dose at which 50% of subjects exhibit a toxic effect to drug
LD50
dose at which 50% of subjects exhibit a lethal response to drug
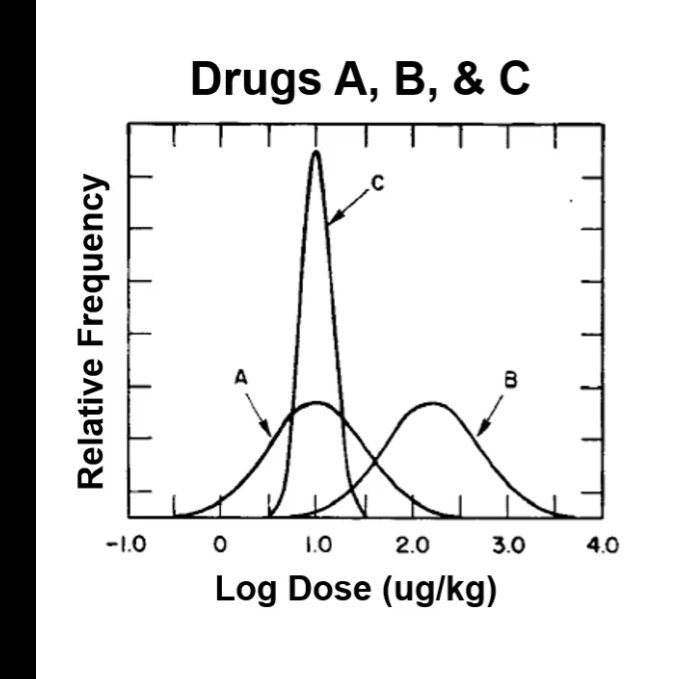
population sensitivity
sensitivity
drugs A and C have the same mean sensitivity (1.0 log unit ~ 10 ug/kg)
mean sensitivity to drug B is lower (2.2 log unit ~150 ug/kg)
need higher dose to achieve the same response
response
population response is more homogenous for drug C then drug A despite same sensitivity (smaller standard deviation)
same standard deviation of drug A and B (width of curve)
therapeutics
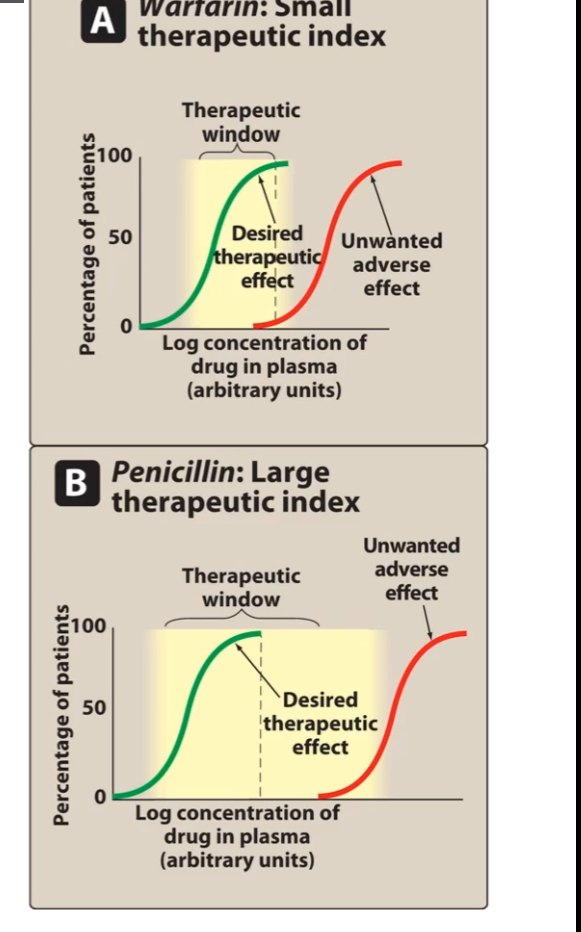
therapeutic window = range of doses of a drug that elicits a therapeutic response WITHOUT unacceptable adverse effects (or toxicity) in a population of pts
quantified as therapeutic index (TI)
TI = toxic (lethal) dose50/effective dose50
therapeutic index
cumulative percentages of pts responding to 2 different drugs → warfarin (anticoagulant, narrow TI) and penicillin (antibiotic, large TI)
therapeutic index question
dose dependent relationship between desired biological effect and toxicity
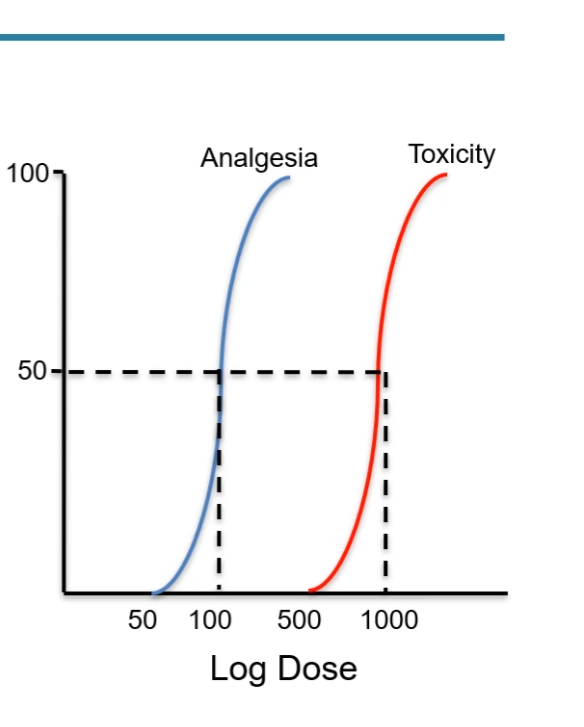
calculate TI
determine ED50 and TI50
ED50 = 100
TI50 = 1000
TI = 1000/100 = 10
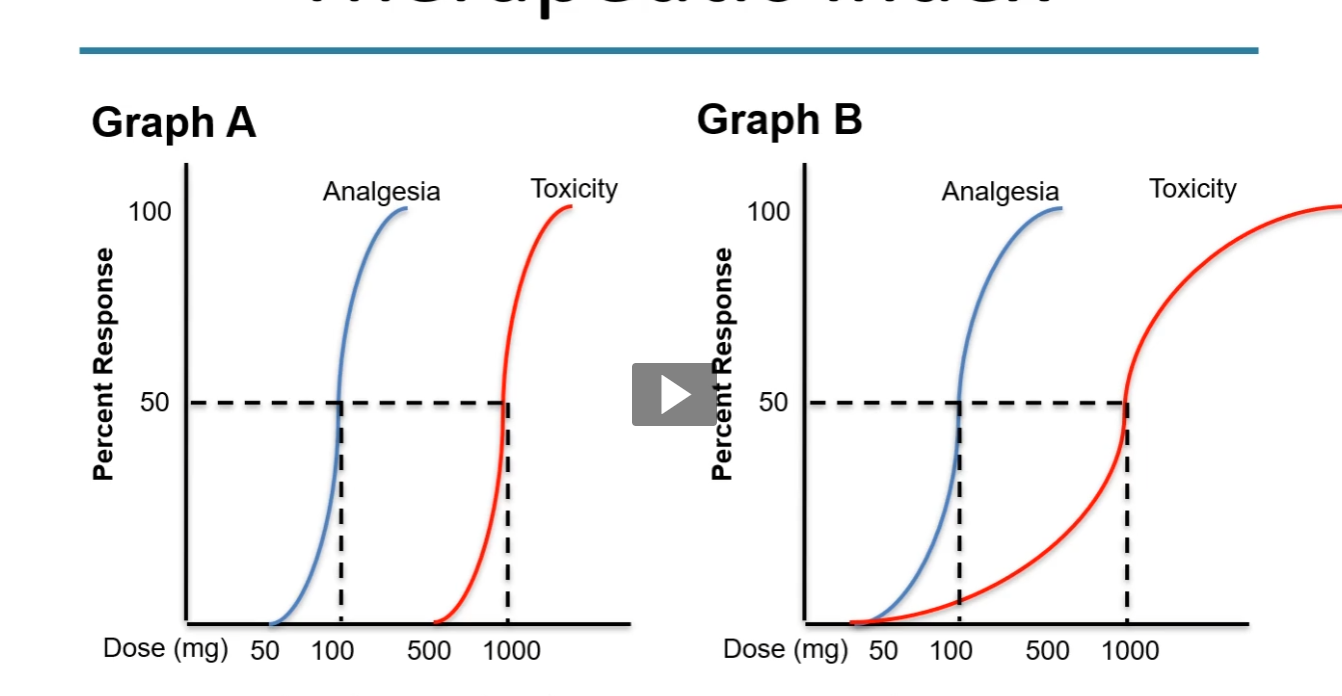
therapeutic index with non parallel curves
TI = 10 in both graphs, however in graph B some pts are experiencing toxicity at ED50
TI ratio is less helpful when the curves are not parallel
margin of safety
margin of safety = TD1/ED99
ratio of the doses that cause toxicity in 1% of the population to that cause the desired effect in 99% of the population
often used rather than TI when dose-response curves are NOT parallel