Chapter 21- Energy Flow and Food Webs
1/107
There's no tags or description
Looks like no tags are added yet.
Name | Mastery | Learn | Test | Matching | Spaced | Call with Kai |
|---|
No analytics yet
Send a link to your students to track their progress
108 Terms
Trophic level
based on the number of feeding steps by which it is separated from autotrophs
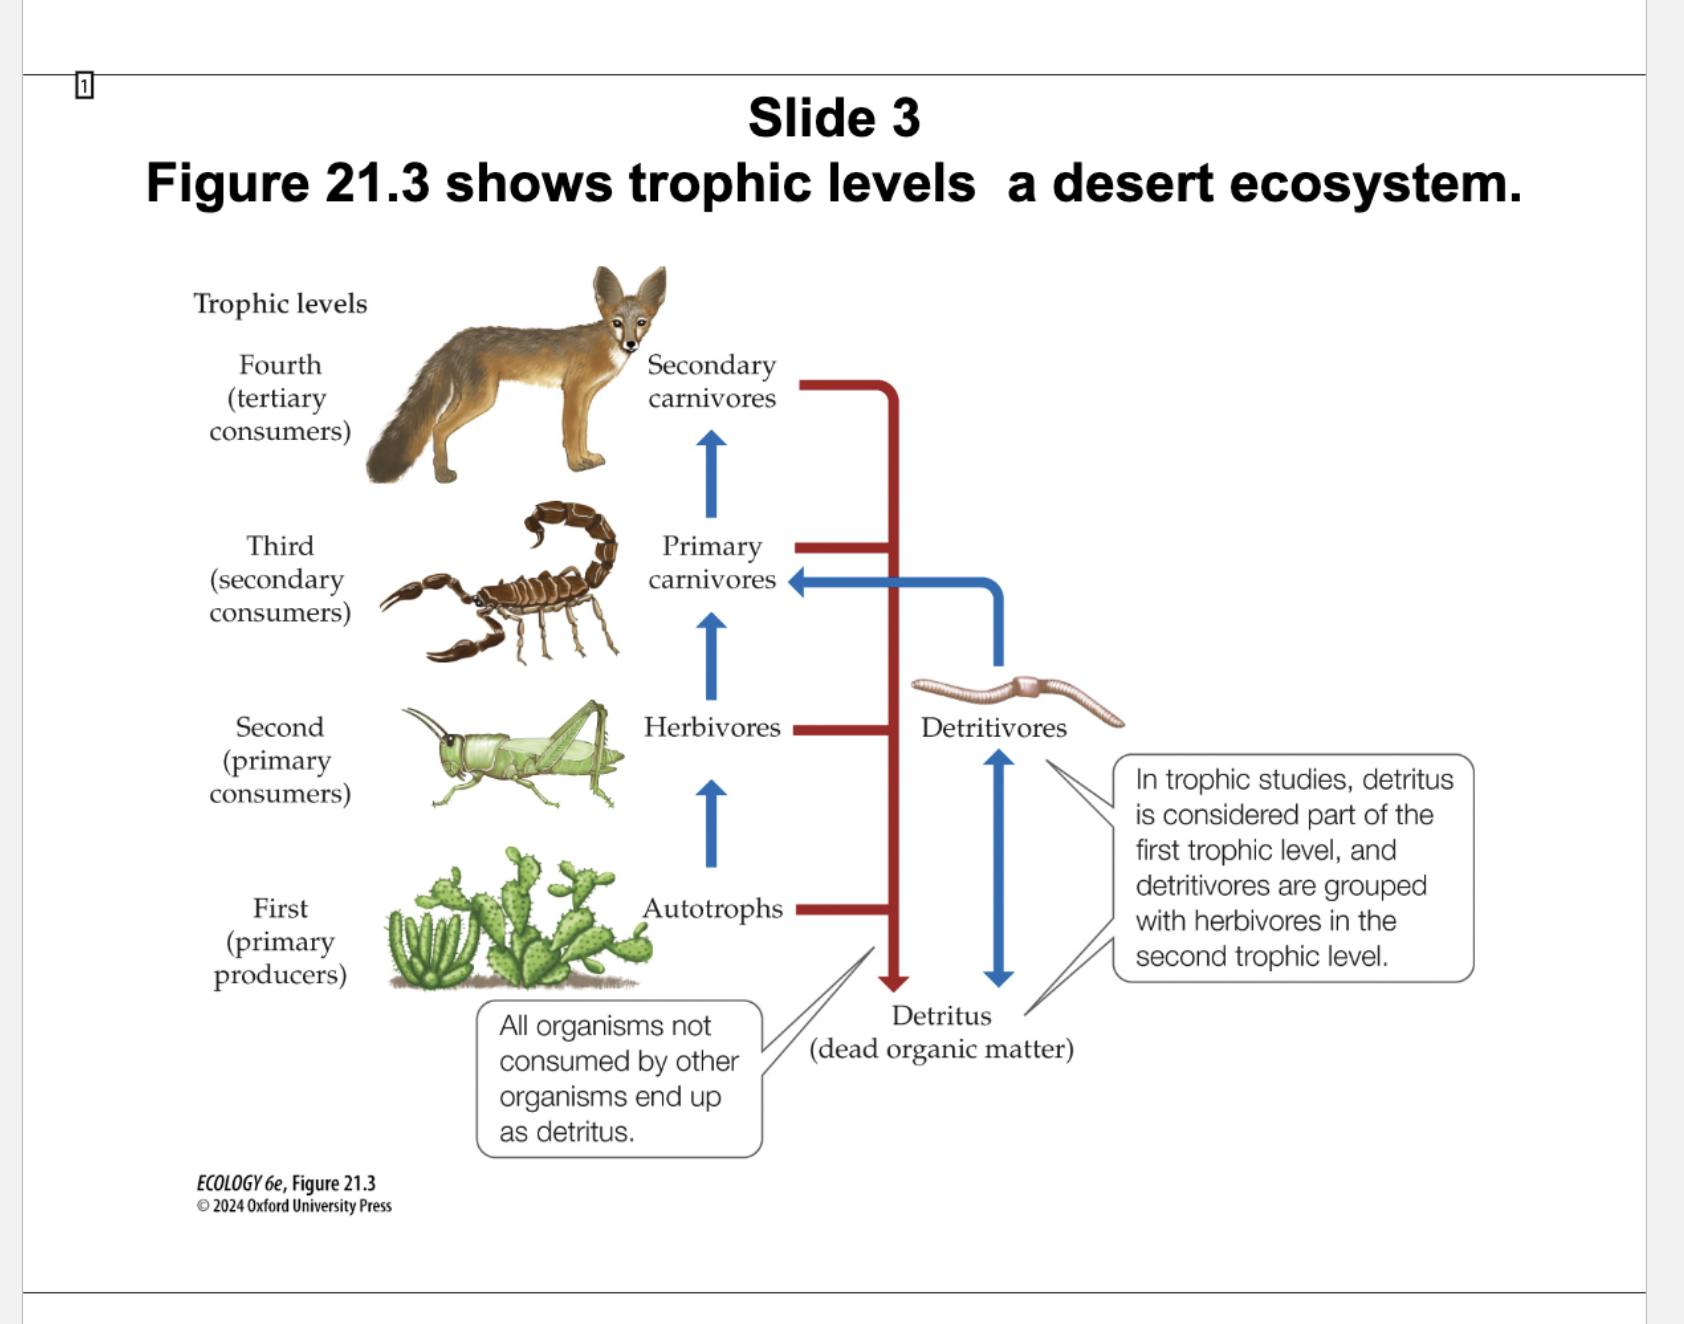
Figure 21.3 Trophic Levels in a Desert Ecosystem
The first trophic level consists of the autotrophs, the primary producers that generate chemical energy from sunlight or inorganic chemical compounds.
The first trophic level also
generates most of the dead organic matter in an ecosystem, which also provides energy for organisms in the
ecosystem.
The second trophic level
consisted of the herbivores that consume autotroph biomass
The remaining trophic levels (third and up) contain the carnivores that consume animals at the trophic level
below them.
omnivores
heterotrophs that feed at multiple trophic levels
What happens to all organisms in an ecosystem?
They are either consumed by other organisms at higher trophic levels or become detritus (dead organic matter).
What is detritus?
Dead organic matter including dead plants, animals, microbes, and feces that enter the decomposition pathway.
Who are the primary consumers of detritus?
Detritivores, such as bacteria, archaea, and fungi
What is decomposition?
The process by which detritivores break down dead organic matter, recycling nutrients back into the ecosystem.
Which trophic level does detritus belong to, and where are detritivores placed?
Detritus is part of the first trophic level; detritivores are grouped with herbivores in the second trophic level.
Autochthonous energy inputs
energy produced by autotrophs within the ecosystem.
Allochthonous inputs
external organic matter entering the system (e.g., from nearby terrestrial ecosystems).
Allochthonous—energy produced outside of ecosystem (terrestrial organic matter like leaves and wood.)
What are examples of allochthonous (external energy) inputs in aquatic systems?
Plant leaves, stems, wood, and dissolved organic matter that enter streams or lakes from surrounding land.
Allochthonous inputs tend to be more important in…
stream and river ecosystems than in lake and marine ecosystems
What did the Bear Brook study (Fisher and Likens, 1973) show?
99.8% of the energy input came from allochthonous sources; only 0.2% was from in-stream NPP.
How did the energy sources in Mirror Lake differ from Bear Brook?
Mirror Lake received about 80% of its energy from autochthonous production (Jordan and Likens, 1975).
Why is allochthonous energy considered lower quality?
Because the carbon compounds are chemically complex and harder to break down, so not all inputs are used efficiently.
What does the river continuum concept suggest?
Autochthonous energy inputs increase from headwaters to mid-reaches due to slower water velocity and higher nutrients.
What does the second law of thermodynamics state regarding energy transfer?
A: Some energy is dispersed as unusable energy (entropy increases), so available energy decreases at each trophic level.
What is a trophic pyramid?
A: A diagram made of stacked rectangles representing the amount of energy or biomass at each trophic level.
Why do trophic pyramids decrease in size from bottom to top?
A: Because some biomass is not consumed and energy is lost during transfer to higher trophic levels.
In which ecosystems are energy and biomass pyramids usually similar?
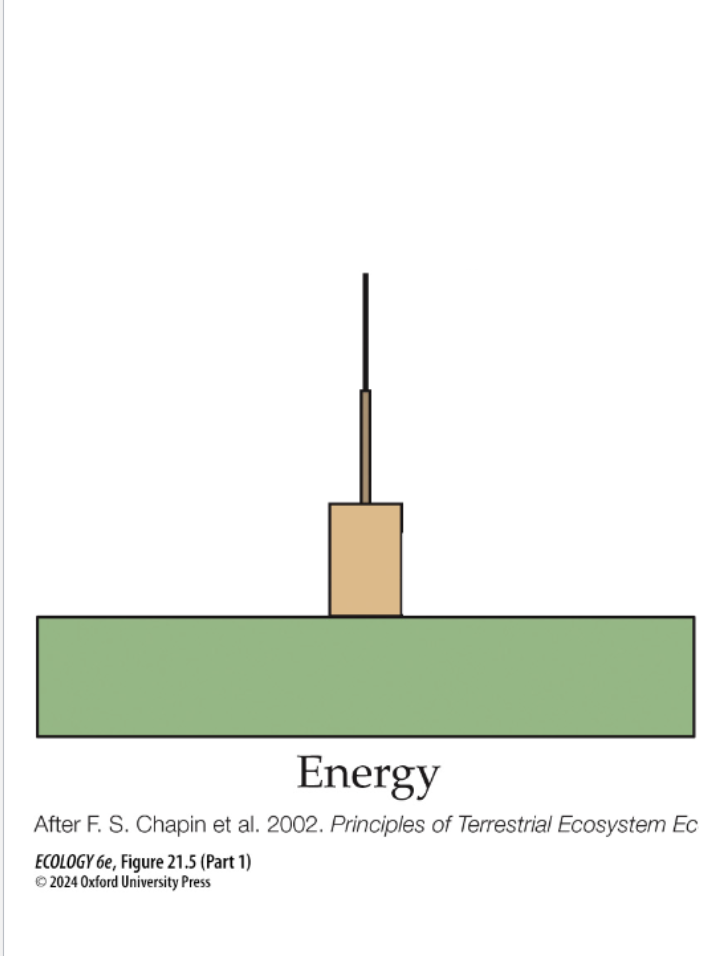
A: Terrestrial ecosystems—because biomass is a good proxy for energy (Figure 21.5)
What does an inverted biomass pyramid indicate?
: That heterotroph biomass is greater than autotroph biomass at a given time, even though autotrophs produce more energy.
Why can phytoplankton support more consumer biomass in nutrient-poor waters?
A: They grow quickly and reproduce rapidly, providing a continuous energy supply despite low standing biomass.
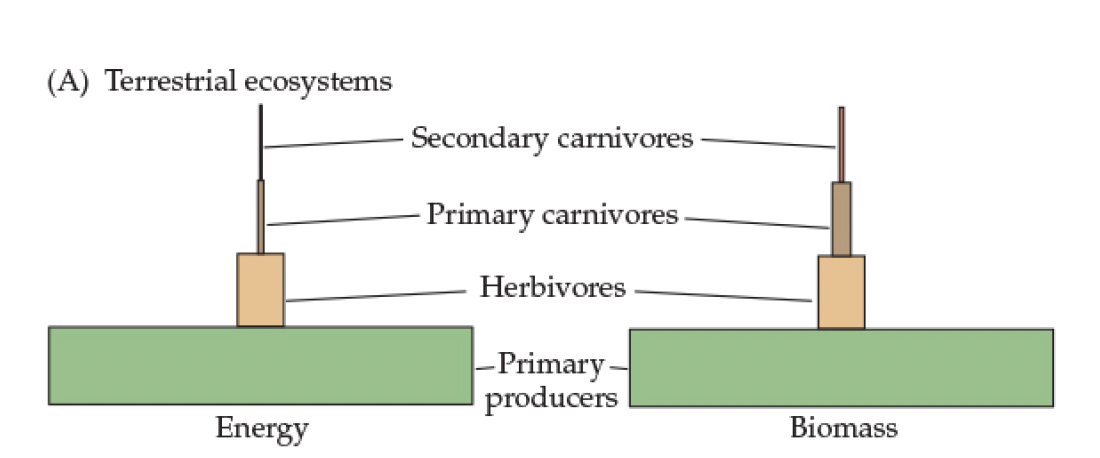
Fig 21.5- Trophic Pyramid Schemes
Terrestrial Ecosystems
Both biomass and energy decrease as you increase in trophic levels
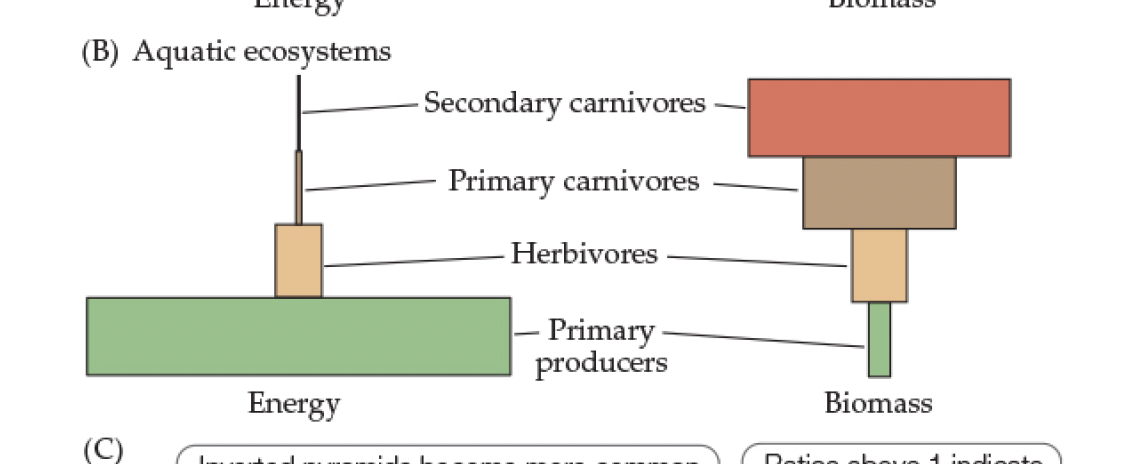
Fig 21.5- Trophic Pyramid Schemes
Aquatic Ecosystems
Energ decreases as trophic levels increase
Biomass increases as trophic levels increase because phytoplankton support more consumer biomass in nutrient-poor waters since they grow quickly and reproduce rapidly, providing a continuous energy supply despite low standing biomass.
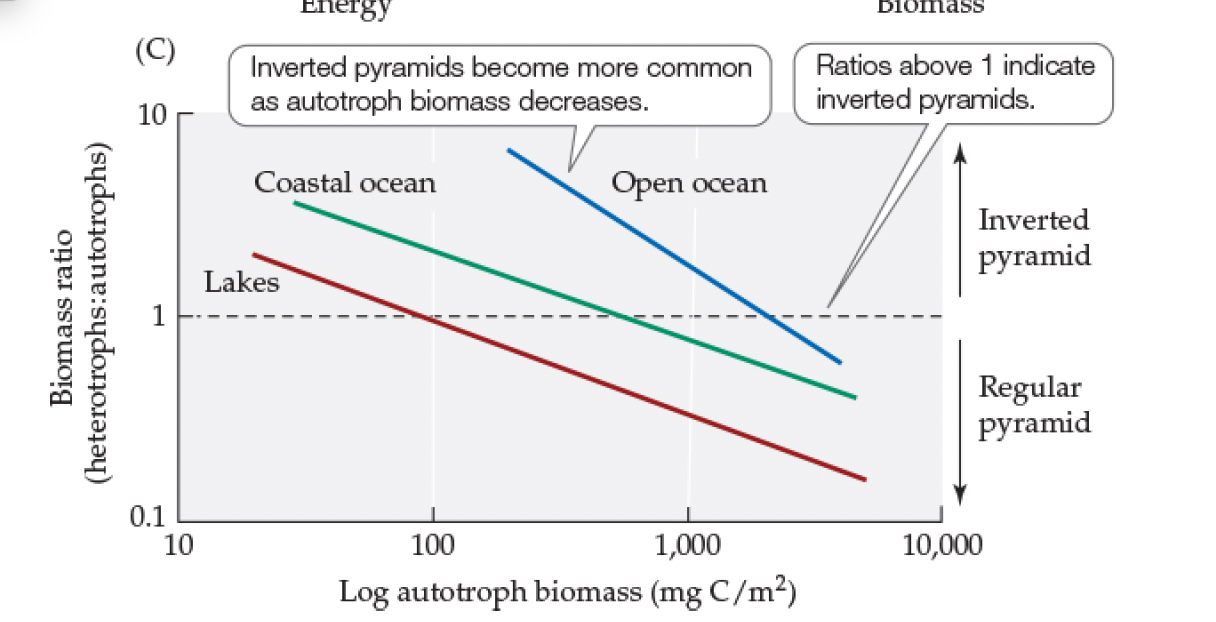
Figure 21.5- Trophic Pyramid Schemes
Inverted biomass pyramids in aquatic ecosystems are most common in nutrient-poor waters with low autotroph biomass.
Inverted pyramids become more common as autotroph biomass decreases
What 4 main factors determine the amount of energy that flows from one trophic level to the next?
Amount of NPP at base of trophic structure.
The proportion of each trophic level consumed by the one above it.
The nutritional content of detritus, autotrophs, and prey.
The efficiency of energy transfers between trophic
levels
Does a high NPP always lead to more energy flow to higher trophic levels?
Not necessarily; consumption rates, food quality, and energy transfer efficiencies also play important roles
What percentage of NPP is consumed by herbivores on average in terrestrial vs. aquatic ecosystems?
Terrestrial: ~13% (range 0.1%–75%); Aquatic: ~35% (range 0.3%–100%).
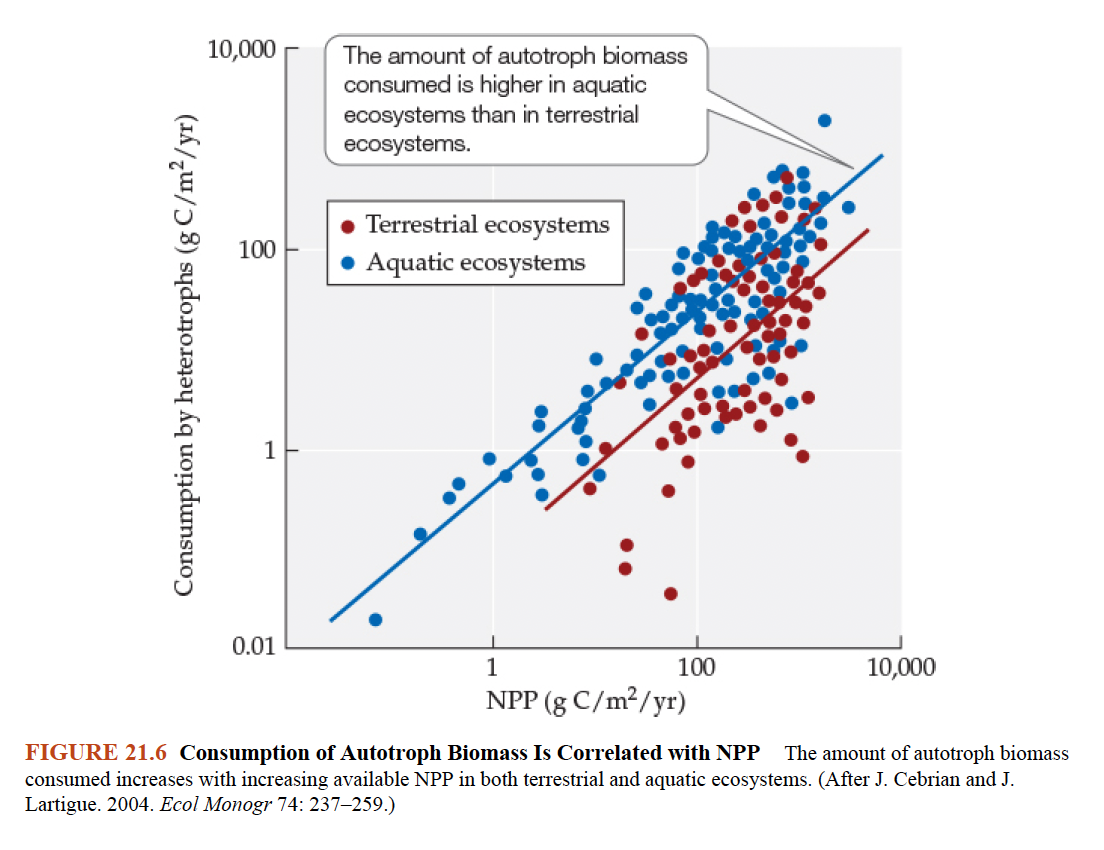
What does Figure 21.6 demonstrate about NPP and herbivore consumption?
A: It shows a positive correlation between NPP and the amount of biomass consumed across ecosystem types.
Consumption by heterotrophs is positively correlated with net primary production; consumption by heterotrophs is greater in ecosystems where net primary production
is better.Consumption is greater in aquatic than in terrestrial ecosystems. On average 13% of terrestrial net primary production is consumed; 35% of aquatic net primary
production is consumed.Predation, plant defenses, and food quality contribute to differences in the proportions of NPP that are consumed in different ecosystems.
Three hypotheses to explain the lower proportion of autotroph biomass consumed in terrestrial ecosystems:
Population growth of herbivores is more constrained by predation in aquatic than in terrestrial ecosystems
Defenses against herbivory (structural, chemical) are more effective in terrestrial ecosystems;
predominant autotrophs in aquatic ecosystems, namely phytoplankton, are more nutritious than the autotrophs available to terrestrial herbivores. The ratio of carbon to nutrients such as nitrogen and phosphorus is an indicator of food quality. Terrestrial autotrophs have a lot of structural carbohydrates, which are typically absent in aquatic autotrophs.
Q: What is trophic efficiency?
A: The amount of energy at one trophic level divided by the amount of energy at the trophic level below it.
Q: What three components make up trophic efficiency?
A: 1) Consumption efficiency,
2) Assimilation efficiency,
3) Production efficiency.
What is consumption efficiency?
The proportion of available biomass that is ingested by the next trophic level.
Q: Is consumption efficiency typically higher in aquatic or terrestrial ecosystems?
A: Aquatic ecosystems.
Q: Who generally has higher consumption efficiencies: carnivores or herbivores?
.
A: Carnivores
Q: What is assimilation efficiency?
A: The proportion of ingested food that is absorbed (not excreted as feces or urine).
Q: What determines assimilation efficiency?
A: Food quality (chemical composition) and consumer physiology.
Q: Why do carnivores have higher assimilation efficiency than herbivores?
A: Their prey has similar carbon:nutrient ratios and is easier to digest than plant or detritus material.
Q: What are typical assimilation efficiencies?
A: Herbivores/detritivores: 20–50%; Carnivores: ~80%.
Q: How does thermal physiology affect digestion?
A: Endotherms digest more completely than ectotherms due to greater thermal stability and more complex digestive systems.
Q: How do ruminants achieve higher assimilation efficiency?
A: Through mutualistic bacteria and protists in their modified stomachs that help digest cellulose-rich food.
Q: What is production efficiency?
A: The proportion of assimilated energy used to produce new biomass (growth and reproduction).
Q: Why do ectotherms have higher production efficiency than endotherms?
A: They do not expend as much energy producing heat, so more energy is available for growth and reproduction.
Q: How does body size affect production efficiency in endotherms?
A: Smaller endotherms lose more heat due to a higher surface area-to-volume ratio, reducing their production efficiency.
Q: Give an example comparing two endotherms with different production efficiencies.
A: A shrew (small) has lower production efficiency than a grizzly bear (large) due to greater relative heat loss.

Explain Figure 21.7- Energy Flow and Trophic Efficiency
Biomass that is not ingested or assimilated enters the pool of detritus
Consumption efficiency is the proportion of the available biomass that is ingested by consumer
Assimilation efficiency is the proportion of the ingested biomass that consumers assimilated by digestion
Production efficiency is the proportion of assimilated new consumer biomass
Q: Despite the decline, did sea lions have less access to prey?
A: No, they obtained prey just as regularly and with less hunting time.
Q: What is the "junk food hypothesis"?
A: The idea that declining prey quality, not quantity, reduced trophic efficiency and nutritional health.
Q: What prey shift occurred in the sea lions’ diet during the decline?
A: From fatty fish like herring to leaner fish like pollock and cod.
Q: How does the fat/energy content of pollock and cod compare to herring?
A: They provide about half the energy and fat per mass compared to herring.
Q: What is bottom-up control in ecosystems?
A: Energy flow is determined by resource availability that affects NPP, which then influences higher trophic levels.
Q: What is top-down control in ecosystems?
A: Energy flow is influenced by consumers at higher trophic levels affecting species abundance at lower levels.
Q: What is a trophic cascade?
A: A series of changes in abundance and species composition across trophic levels, triggered by top-down effects.
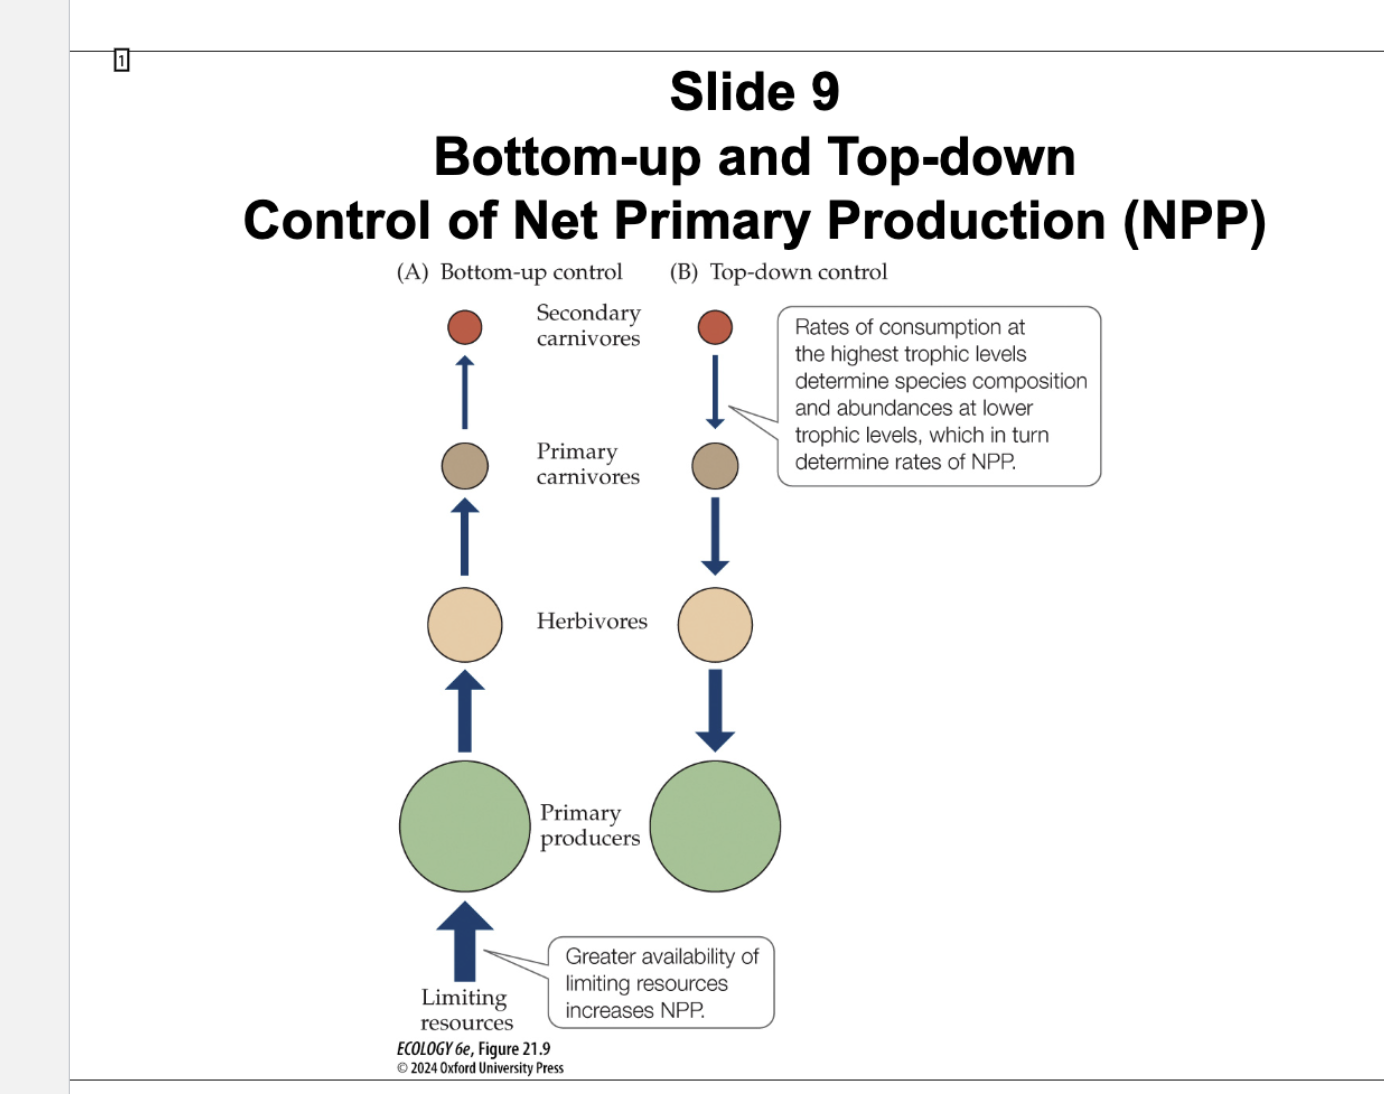
Explain figure 21.9- Bottom Up and Top Down Control of NPP
Production in an ecosystem can be viewed as being controlled (A) by limiting resources or (B) by controls exerted on the species composition and abundances of
autotrophs by consumption at higher trophic levels.The bottom-up” view is that resources that limit NPP determine energy flow through an ecosystem.
The top-down view is that rates of consumption and other interactions at the highest trophic level influence multiple trophic levels below them.
A change in predation at highest trophic levels can initiate a trophic cascade affecting species composition and abundances at lower levels, an ultimately affecting NPP.
The example discussed in chapter 9 involved sea otters, sea urchins, and kelp forests. When otter populations fell precipitously due to overhunting, herbivorous urchins
flourished and decimated the kelp forests. When otters were protected and allowed to recover, their predation on sea urchins increased dramatically, and grazing on
kelp decreased dramatically. More recently, killer whales have decimated some populations of sea otters, and this has allowed populations of urchins to increase, which
in turn caused an increase in herbivory on kelp.
3 Understanding of Trophic Cascades
trophic cascades are most often associated with changes in the abundance of top specialist predators.
Omnivory may act to buffer the effects of trophic cascades through the consumption of prey at multiple trophic levels.
Trophic cascades have been hypothesized to be most important in relatively simple, species-poor ecosystems.
What invasive species was studied by Flecker and Townsend (1994) in the Shag River?
A: Brown trout (Salmo trutta), a non-native predator introduced for sport fishing.
Q: What native fish species was used for comparison in the Shag River study?
A: The common river galaxias (Galaxias vulgaris), also known as the "Maori trout."
Q: What method did researchers use to study trout and galaxias effects?
A: Artificial stream channels (PVC half-pipes) with fish-added, galaxias-added, and no-fish control treatments.
Q: How did brown trout affect invertebrate density compared to control channels?
A: They reduced invertebrate density by about 40%.
Q: What was the impact of fish presence on algal biomass?
A: Algal biomass increased, especially in trout treatments, due to reduced invertebrate grazing (trophic cascade).

Explain Flecker and Townsend’s Aquatic Trophic Cascade
Flecker and Townsend used artificial stream channels to study the effects of non-native brown trout and a native fish (galaxias) on stream invertebrates and algae in the
Shag River, New Zealand.(A) Effects on invertebrate density.
(B) Effects on algal biomass, as estimated using chlorophyll concentrations in stream water.
Trophic cascades are most commonly observed in aquatic systems, where their effects are stronger.
Trophic cascades were previously thought to be unlikely in diverse
terrestrial ecosystems such as tropic forests, where a decrease in one species could be compensated by an increase in another species at the same trophic level.
Q: What plant species was the focus in the Costa Rica rainforest study?
A: Piper cenocladum, a common understory tree.
Q: What mutualistic relationship occurs with Piper trees?
A: They house and feed Pheidole ants, which defend against herbivores.
Q: What beetle preys on the ants in this system?
A: Tarsobaenus, a beetle genus that preys on Pheidole ants.
Q: What were the effects of adding beetles to insecticide-treated plots?
A: Ants decreased 5×, herbivory increased 3×, and leaf area per tree was halved—demonstrating a trophic cascade
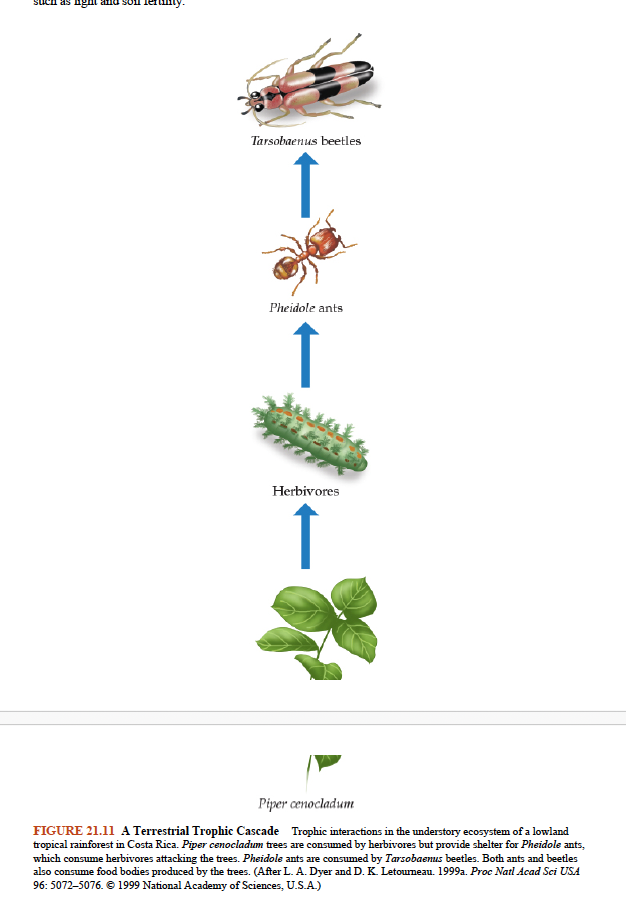
Figure 21.11- Dyer and Letourne Terrestrial Trophic Cascade
However, figure 21.11 (not shown here) illustrates a 4-level terrestrial trophic cascade where the top predator is a species of beetle that preys on ants, carnivorous ants
are below the top predator, the ants prey on herbivorous beetle larvae, which are below the ants, and leaves of a tree species are at the lowest level of primary
production.Experiments were done to test trophic relationships involving beetles, ants, herbivorous larvae, and tree leaves.
They found that ant populations were
highest in the absence of beetles.In the presence of beetles, the number of ants decreased, which allowed higher rates of herbivory on the tree leaves.
Thus, trophic cascades occur not only in relatively simple aquatic ecosystems but also in more complex and diverse terrestrial ecosystems.
Q: Why is understanding the number of trophic levels in an ecosystem important?
A: It affects energy and nutrient flow and the concentration of toxins in higher trophic levels via trophic cascades.
Q: What are three changes that can alter the number of trophic levels in an ecosystem?
1) Addition/loss of a top predator,
2) Insertion/loss of a mid-level predator,
3) Change in omnivore feeding preferences.
How does primary production influence the number of trophic levels?
More primary production means more energy is available to support higher-level predators.
Q: In which ecosystems is the effect of primary production on trophic levels most significant?
A: In ecosystems with low resource availability.
Q: How can frequent disturbances limit trophic level number?
A: They prevent the reestablishment of higher-level predators that require more time and energy to sustain.
Q: Why might disturbance have less effect than expected?
A: Some organisms adapt to frequent disturbances and recolonize quickly (see Concept 17.1).
Q: How does ecosystem size influence the number of trophic levels?
A: Larger ecosystems support larger, more stable populations and higher species diversity.
Q: What type of ecosystems provided clear evidence for the ecosystem size effect?
A: Lakes and oceanic islands with discrete boundaries.
Q: Where did Takimoto et al. study trophic levels and what method did they use?
A: On 36 Bahamian islands using carbon and nitrogen isotopes from top predators.
Q: Did exposure to storm surges affect trophic level number?
A: No, but it changed the identity of top predators (orb spiders vs. Anolis lizards).
Q: What was the strongest predictor of trophic level number in the island study?
A: Island size.
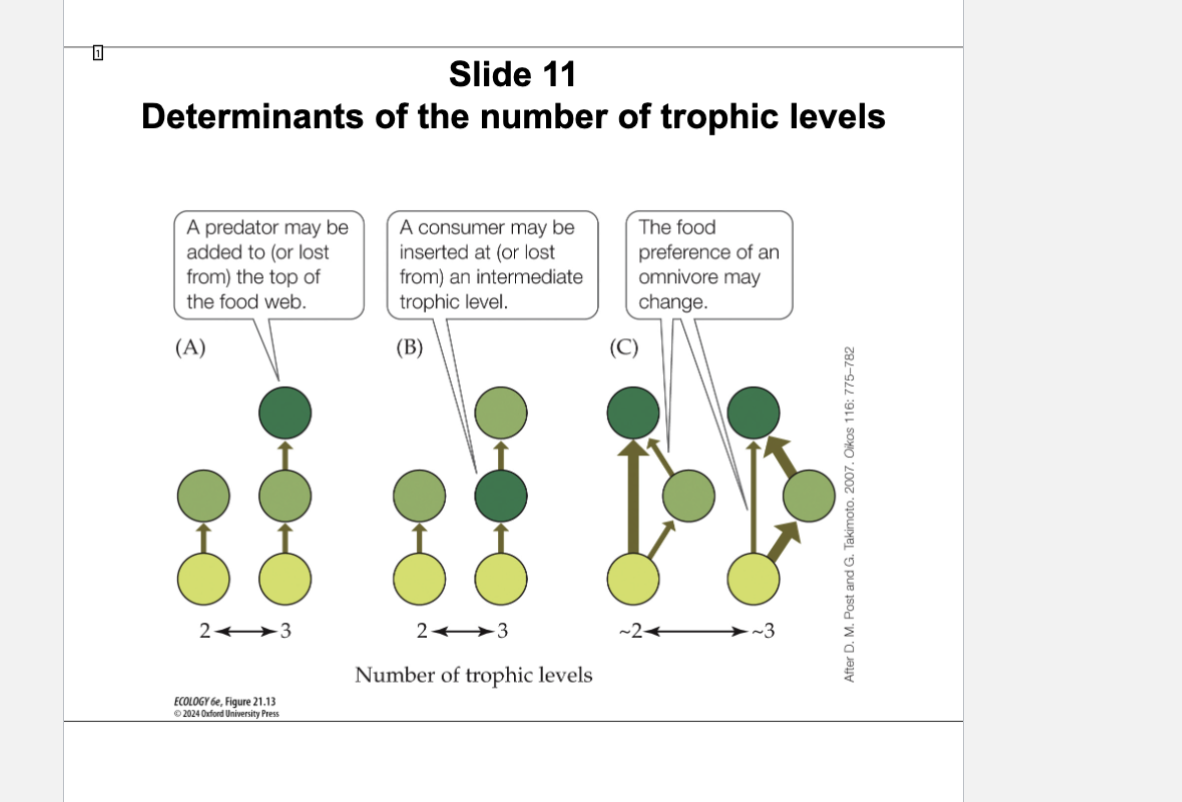
Explain Figure 21.13- Chnages in the number of trophic levels
Circles represent species at different trophic levels, and the thickness of the arrows represents the amount of energy flowing between species pairs.
Differences among ecosystems in the number of trophic levels may occur because of
(A) the addition or loss of a consumer at the top level
(B) the insertion or loss of a consumer at an intermediate level
(C) a change in the preferred feeding level of an omnivore.
Factors controlling the number of trophic levels include:
The amount of energy entering via primary production: more production should allow more trophic levels.
This constraint appears to be most important in resource-
poor ecosystems.Ecosystem size: Larger ecosystems support larger populations, have more habitat heterogeneity, and higher species diversity.
Frequency of disturbance: Higher trophic levels depend on lower levels and take time to re-establish after disturbance. If disturbance is frequent, higher levels may never become established.
Differences among ecosystems in the number of trophic levels may occur because of
(A) the addition or loss of a consumer at the top level
(B) the insertion or loss of a consumer at an intermediate level
(C) a change in the preferred feeding level of an omnivore.
4 factors controlling number of trophic levels
The amount of energy entering via primary production: more production should allow more trophic levels.
This constraint appears to be most important in resource- poor ecosystems.
Ecosystem size: Larger ecosystems support larger populations, have more habitat heterogeneity, and higher species diversity.
Frequency of disturbance: Higher trophic levels depend on lower levels and take time to re establish after disturbance. If disturbance is frequent, higher levels may never become established.
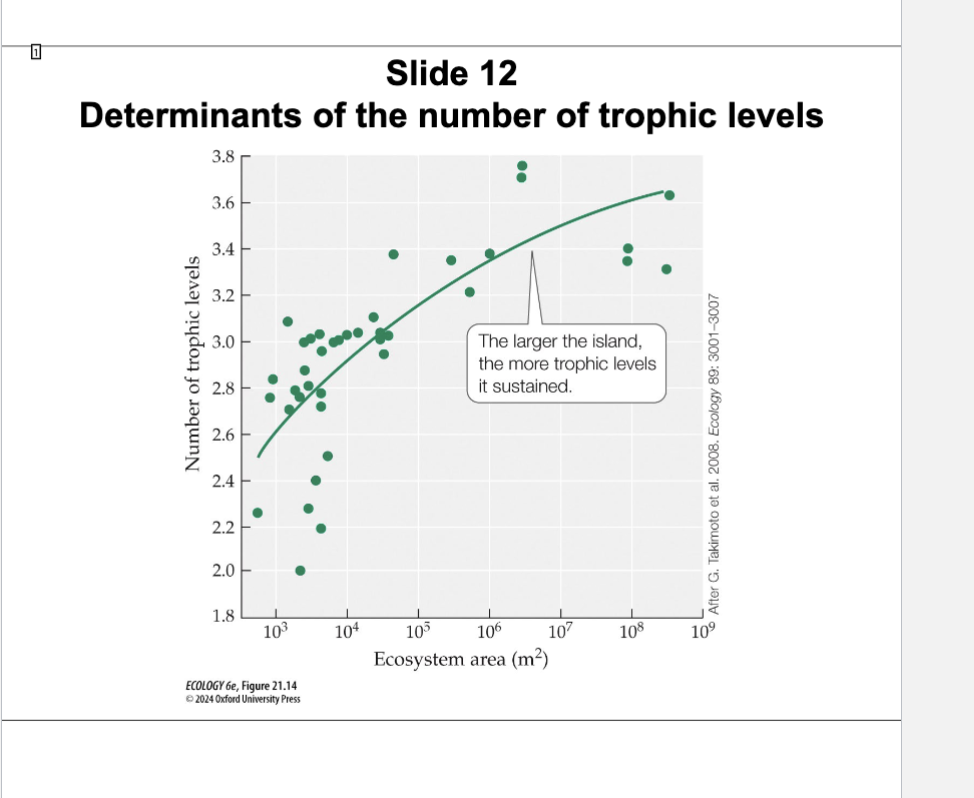
Explain FIGURE 21.14 Ecosystem Size Is Correlated with the Number of Trophic Levels
In this study, the number of trophic levels was estimated using isotopic ratios of carbon and nitrogen (see concept 20.4) in tissues of top predators, namely lizards and spiders. This explains why trophic level is shown as a continuous variable on the y-axis rather than a discrete variable with values of 1, 2, 3, or 4.
Disturbance in the form of storm surges did not affect the number of trophic levels, but it did affect the identity of top predators.
On exposed, frequently disturbed islands, orb spiders were more frequently the top predators. On protected islands, lizards were the top predators.
What is a food web?
A diagram showing the connections among organisms based on who eats whom in an ecosystem.
Q: Who first emphasized the complexity and interdependence of species in nature?
A: Charles Darwin, in The Origin of Species (1859), using the metaphor of a “tangled bank.”
Q: What does a food web help us understand about ecosystems?
A: How energy flows among organisms and how population and community dynamics are influenced.
What is omnivory in a food web?
A: When an organism feeds at multiple trophic levels (e.g., eats both plants and animals).
Q: What cannibalism in a food web context?
A: When an organism consumes individuals of its own species (shown as half-circle arrows in food
Q: What does the presence of many omnivores in a food web suggest?
A: Omnivory is common and contributes to the web’s complexity.
Q: Why are food webs considered static representations?
A: Because they don’t account for changes in feeding behavior over time or across life stages.
Q: Give an example of a species with age-based trophic level change.
A:* Frogs – omnivorous tadpoles become carnivorous adults.
Q: What other biological interactions are often missing from food webs?
A: Pollination mutualisms, microbial roles, and species interactions not related to feeding.
Q: What is interaction strength in ecology?
A: It measures how much the population size of one species affects the population size of another.
Q: Why do ecologists study interaction strength?
A: To simplify complex food webs by identifying the most influential relationships for energy flow and community structure.
Q: What are some methods used to estimate interaction strengths in food webs?
A: Removal experiments, predator-prey presence/absence comparisons, body size and metabolic rate modeling, and feeding behavior observations.
Q: Why aren’t removal experiments used for every species?
A: They are logistically difficult in large, complex food webs.
What species did Robert Paine remove to test predator influence in the intertidal zone?
A: The sea star Pisaster ochraceus.
Q: What was the outcome of removing Pisaster?
A: Species richness declined from 15 to 8 as mussels dominated and excluded other species.
Q: What allowed mussels to avoid predation after several years?
A: They grew too large for Pisaster to consume, maintaining dominance even after sea star removal stopped.
What is a keystone species?
A: A species that has a disproportionately large effect on energy flow and community composition relative to its abundance or biomass.
Q: Why are keystone species important in conservation?
A: Protecting them can help maintain biodiversity and ecosystem stability.
Q: Are keystone species always influential across their entire range?
A: No, their importance can be context-dependent, varying by environment and species interactions.