4.2.3 Economic performance
1/77
Earn XP
Description and Tags
Name | Mastery | Learn | Test | Matching | Spaced |
|---|
No study sessions yet.
78 Terms
What does Short-run economic growth mean?
Growth of real output resulting from using idle resources
Annual percentage change in real national output
What does long-run economic growth mean?
An increase in the economy’s potential level of real output and an outward shift of the economy’s production possibility frontier
What does economic cycle mean?
Variations in the level of productive capacity of an economy over time
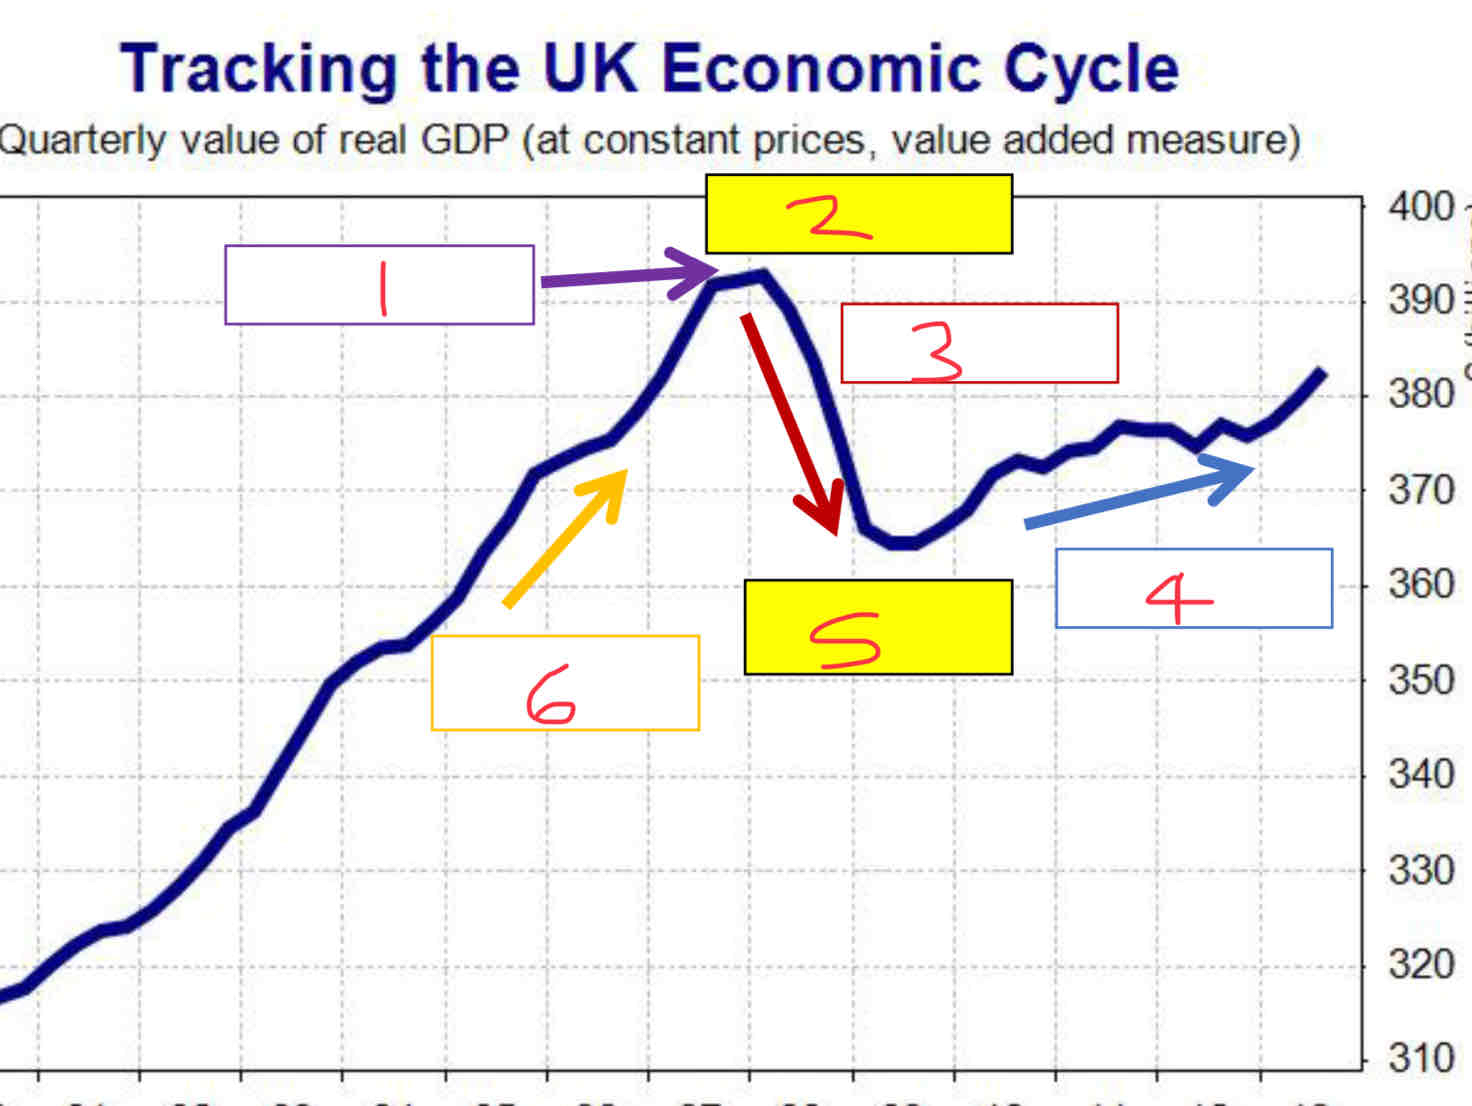
Label the stages of the economic cycle
1)Slowdown
2) Peak
3)Recession
4)Recovery
5)Trough
6)Boom
What are the causes of short run economic growth?
Increase in AD
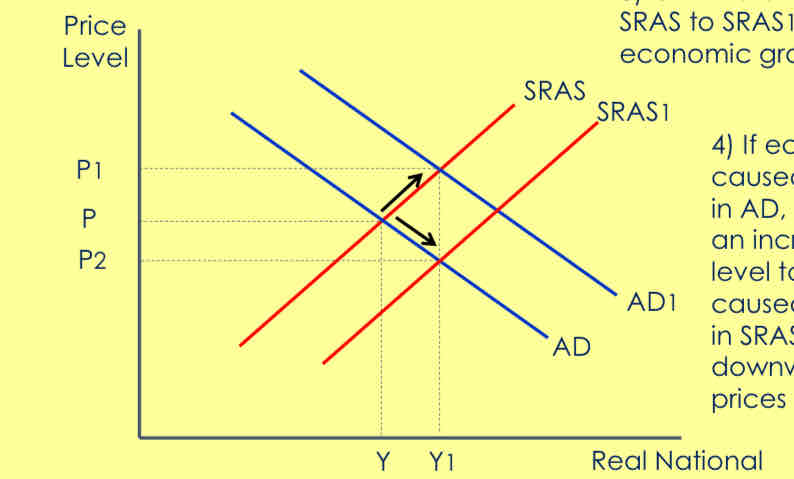
What does a short-run economic growth diagram look like?
Begin with the equilibrium position.
If there is an increase in AD-AD1 there will be economic growth from Y to Y1.
Or if there is an increase in SRAS to SRAS1, there will also be economic growth from Y to Y1.
If economic growth is caused by an increase in AD, this will lead to an increase in the price level to P1, but if caused by an increase in SRAS, will put downward pressure on prices to P2.
What are the causes of long run economic growth?
increase in the productive capacity of the economy,
Increase in long-run aggregate supply.
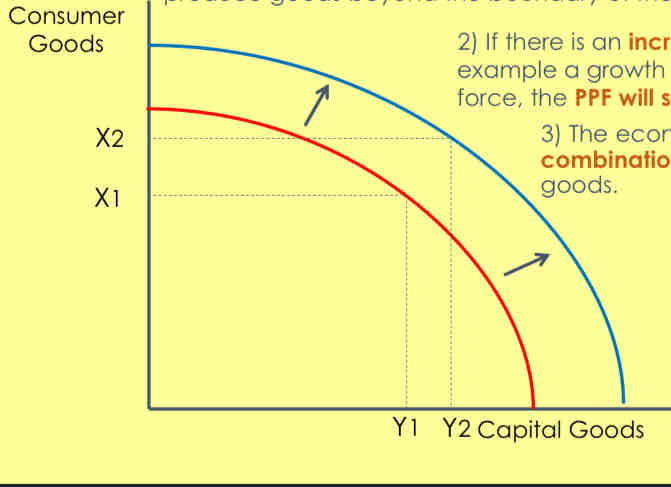
What does one example of a long-run economic growth diagram look like?
1) Initially, with all factor resources fully employed, an economy can produce combination X1Y1 of consumer and capital goods. It cannot produce goods beyond the boundary of the red PPF.
2) If there is an increase in factor resources, for example a growth in the size of the labour force, the PPF will shift to the right.
3) The economy can now produce combination X2Y2 of consumer and capital goods.
4) Just because the economy has the capacity to produce X2Y2, this assumes that all resources are fully employed, which may be difficult to achieve in the short and long-run.
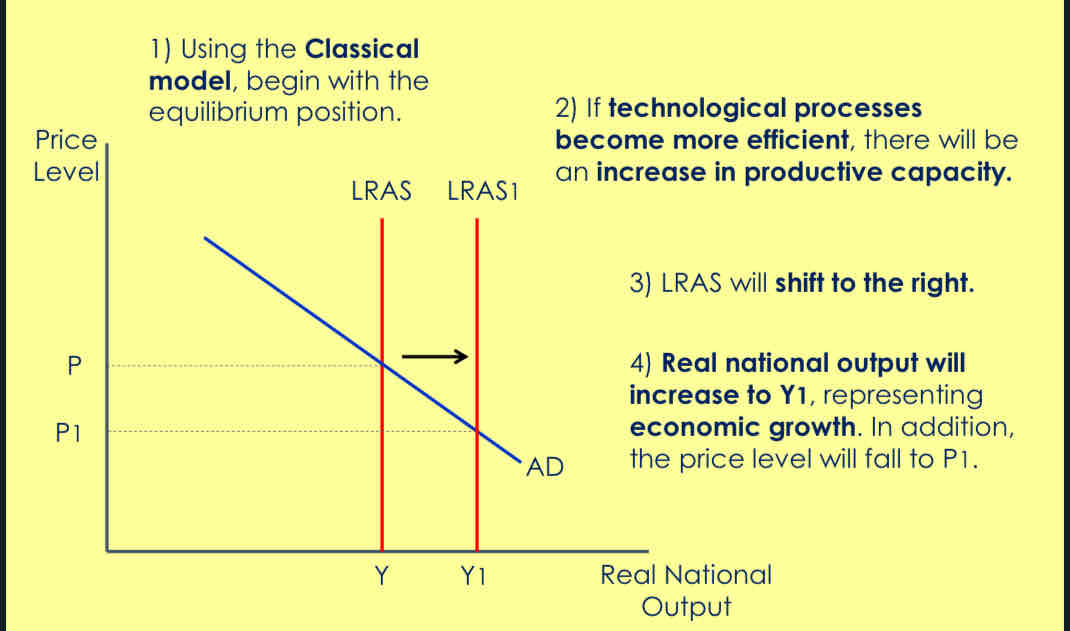
What does another example of a long-run economic growth diagram look like?
What is an economic boom?
period of high level of economic activity.
What is an economic boom caused by?
❖ High rate of economic growth
❖ High demand
❖ Low unemployment
❖ Inflationary pressure
❖ Labour skills shortages
❖ High confidence in the economy
❖ Capital Investment is high
What is an economic recession?
The rate of economic growth starts to fall in a downturn
real GDP falls for 6 months then this is known as a recession
What is an economic recession caused by?
• Demand falls
• Unemployment begins to rise
• Some firms will go out of business
• Confidence in the economy is low and most firms will reduce investment
What is an economic slump?
period of serious economic decline
What is an economic slump caused by?
• Low or negative growth
• Demand and inflation are low
• Unemployment is high
• Confidence in the economy is low
• High rate of bankruptcy
What is an economic recovery?
economic growth is starting to rise
What is an economic recovery characterised by?
Economic growth starts to rise
Demand increases
Unemployment falls
Inflation starts to rise
Confidence in the economy increases
Capital Investment increases
What is unemployment?
those actively seeking work but are unable to find any
What does the level of unemployment mean?
the number of people who are unemployed
What does the rate of unemployment mean?
the number of people unemployed as a % of the labour force
What is the formula for the rate of unemployment?
Unemployed/labour force X 100
What is voluntary unemployment?
when a person is unemployed not due to unavailability of jobs in the economy, but because of not being able to find employment of his/her own choice.
What is involuntary unemployment?
where an individual isn’t working, but is willing and able to work, and is actively seeking employment
What are the 2 measures of unemployment?
Claimant Count - The number of people claiming Job Seekers Allowance (JSA)
Labour Force Survey (LFS) - Quarterly survey of approximately 60,000 households compiled by the Office of National Statistics studying the employment circumstances of the UK population
What are some issues with the claimant count?
does everyone who is eligible sign on?
Changing criteria for JSA
Under 18s and over 60s don’t count
Not everyone signs on for JSA
Self-employed workers don’t claim
Hidden economy not included
Is the Labour Force Survey (LFS) better?
1. Internationally recognised
3. Picks up trends in sectors
5. Generally accepted to be more accurate
BUT
• Costly to compile
• Subject to sampling
What are the 4 main types of employment?
seasonal
Cyclical
Frictional
Structural
What is seasonal unemployment?
Seasonal decline in demand for output of seasonal industries
Unemployment arising in different seasons such as weather and seasonal holidays(Christmas)
Usually casual workers are mostly affected
E.g. - the Christmas season
Policy to reduce - not seen as a major concern of the Gov
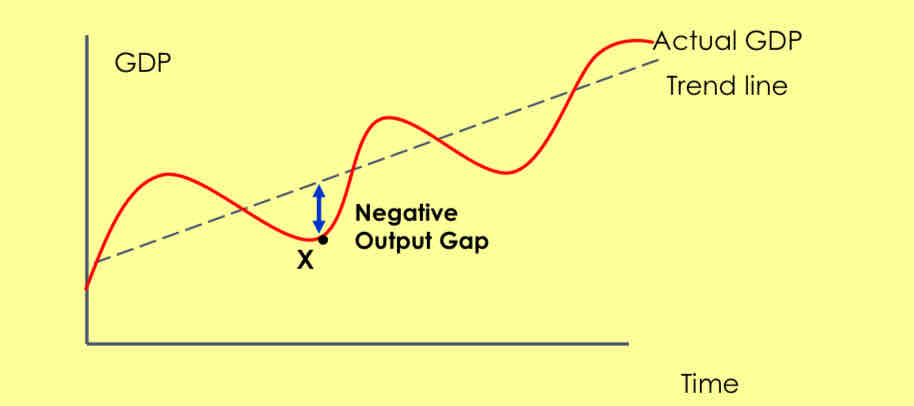
What is cyclical unemployment?
insufficient AD
This is heavily linked to the economic cycle and occurs when there is a negative output gap
E.g - unemployment during a recession
Policy to reduce - Boost AD with:
lower interest rates
Lower taxes
Higher government spending
What is frictional unemployment?
people moving in and out of employment
E.g Moving careers
Immobility of labour - Geographic (location related) & Occupational (skills and training gap)
Policy to reduce - improving info about job vacancies ensuring the welfare system doesn’t create incentives to remain unemployed
What is structural unemployment?
Structural unemployment occurs when the demand for labour is less than the supply of labour in an individual labour market
E.g - decline of manufacturing, occupational immobility , geographical immobility, robots replacing jobs, long term regional decline
What are the consequences of unemployment on businesses?
• Reduced demand for goods/services
• Reduced productivity
• Reduced profitability
• Less incentive to invest
• Reduced morale and productivity of remaining workforce
What are the consequences of unemployment for the unemployed?
Lower living standards - The unemployed will have lower incomes, meaning a reduced standard of living
Social costs - Unemployment can enhance the likelihood of illnesses such as depression and cause stress as strains are placed on family finances
Financial costs - Looking for work takes time. More time spent at home may increase utility bills
De-Skilling - The longer you are unemployed, the more “de-skilled” you become as workplace skills are not developed
Reduced chances of finding work- The longer you are unemployed, the less likely you are to find a job
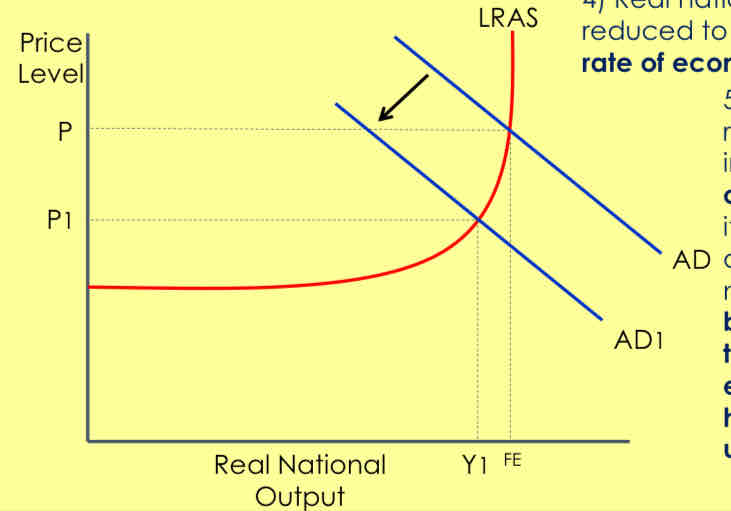
What is Demand-side unemployment?
If cyclical unemployment occurs, then this can be represented by a shift in AD to AD1
This may also occur through seasonal or frictional factors.
As a consequence, unemployment of Y1-FE has now been created.
Real national output has reduced to Y1 indicating a lower rate of economic growth.
The price level has reduced to P1, indicating a lower rate of inflation. Whilst this itself may be desirable, a government may need to weigh up the benefits of this versus the lower rate of economic growth and higher rate of unemployment.
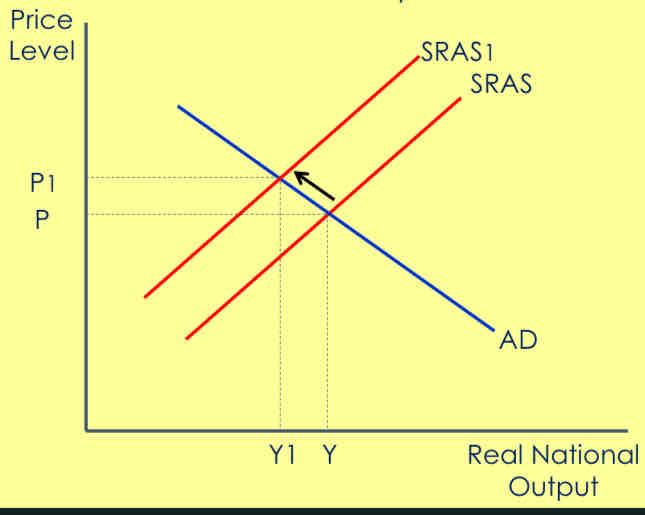
What does the Supply-Side Unemployment diagram show?
If a firm experiences an increase in costs, perhaps as a result of higher wages, they may decide to reduce their supply.
Or, in response to cyclical unemployment, they may scale back production so they are not left with surplus stock that they cannot sell or may be expensive to hold.
This will shift supply from SRAS to SRAS1, and create unemployment of Y-Y1.
As a result, Real National Output has also fallen, and there has been an increase in the price level from P to P1 indicating inflation
What are government policies to reduce unemployment?
Government spending and subsidies on housing – boosts geographical mobility
Job Seekers allowance reduces search periods in-between jobs
Retraining schemes and Trade Union regulations improve occupational mobility
Supply-side policies
What are policies to reduce unemployment- labour demand?
Low interest rates and policies to increase business lending
Depreciation in the exchange rate (to help exports)
Infrastructure investment projects (fiscal policy)
Reductions in corporation tax
What are policies to reduce unemployment- labour supply?
Reducing occupational mobility
•Better funding for and more effective training
•An expansion of apprenticeship / internship programmes
Improving geographical mobility
•Rise in house-building will help to keep property prices lower and encourage more affordable rents
stronger work incentives
•Higher minimum wage or a living wage
•Reductions in income tax / national insurance
What is the natural rate of unemployment?
There will always be a certain level of unemployment so 100% unemployment isn’t achievable .
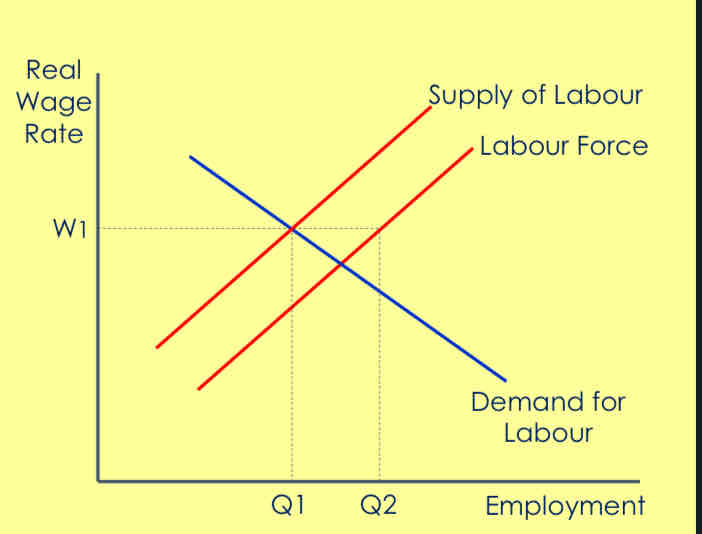
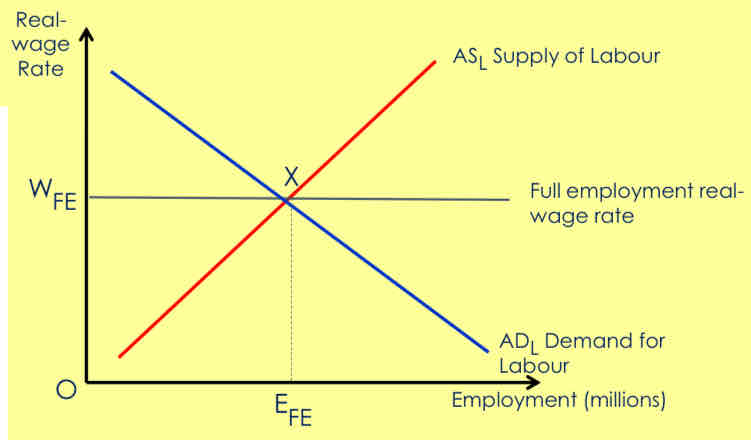
Describe the natural rate of unemployment diagram:
The labour market is in equilibrium at W1Q1, however, because there is always a degree of voluntary unemployment, a gap of Q1-Q2 remains.
It is argued that even if the demand for labour increased, unemployment would remain because of weaknesses on the supply side of the labour market.
What factors determine the natural rate of unemployment?
Skills and education
➢ If the quality/availability of education/training schemes improves, then the natural rate should fall as structural unemployment issues are tackled
Availability of job information
➢ With enhanced information, frictional unemployment should fall and reduce the natural rate
Occupational mobility
➢ Any labour immobility, geographical or occupational, will increase the
natural rate
Labour market flexibility
➢ Greater labour market flexibility will lower the natural rate, for example weaker trade unions or looser employment legislation
What is real wage unemployment?
wages are above the market clearing wage-rate, causing excess supply of labour.
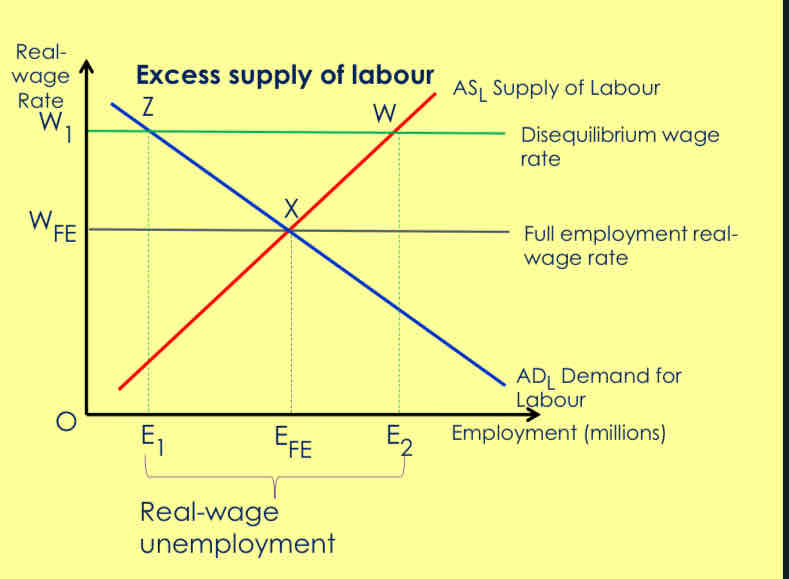
What’s the other diagram for real wage unemployment? Explain it.
If wages are fixed at a higher real rate, at W1 rather than WFE.
At this real wage rate employers want to hire E1 workers, but E2 workers wish to supply their labour.
In this instance, there is excess supply of labour in the labour market, equal to the horizontal distance between points Z and W, that is E2 – E1.
What can be Voluntary V Involuntary?
Can be Voluntary
• Free-market Economists
• Workers choose to remain unemployed
• Trade Unions accept wage-cuts
Can be Involuntary
• Keynesian Economists
• Workers willing to work at current market wage rate but there are no jobs available
• Wage Inflexibility
What factors determine real wage unemployment?
Trade unions
➢ Through collective bargaining, a trade union may be able to negotiate higher wages for its members
If it is successful in doing so, the number of workers prepared to offer their labour increases, but the demand for that labour reduces, which will create some involuntary unemployment
National Minimum Wage (NMW)
➢ If a NMW is introduced, or increased from its existing level, this may also cause real wage unemployment as workers also supply their labour more readily
➢ However, the wider the gap between the equilibrium wage rate and the NMW, the greater the extent of real wage unemployment
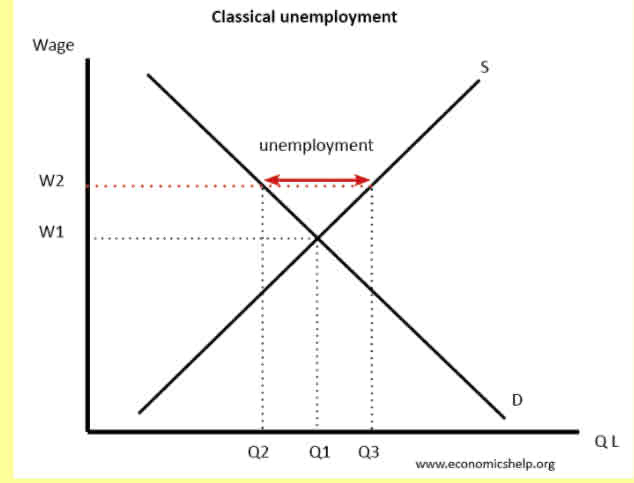
Using the diagram, highlight and explain the impact upon real wage unemployment of:
- Increase in the National Minimum Wage (from W2)
- Decrease in Trade Union membership, thus resulting in a drop in real wages (from W2)
Increase in the National Minimum Wage
Widening gap between S & D, as wage levels rise to W3. Higher levels of unemployment (higher levels of economically active)
Decrease in Trade Union membership, thus resulting in a drop in real wages
Drop in wage levels from W2 to W1, leading to lower unemployment, but also lower incomes and increased economically inactive.
What is inflation?
The rate of change in the average price level over time.
What are the 2 primary causes of inflation?
demand-pull
Cost-push
What is demand-pull inflation?
caused by increasing AD in the economy
there is too much money chasing too few goods and services
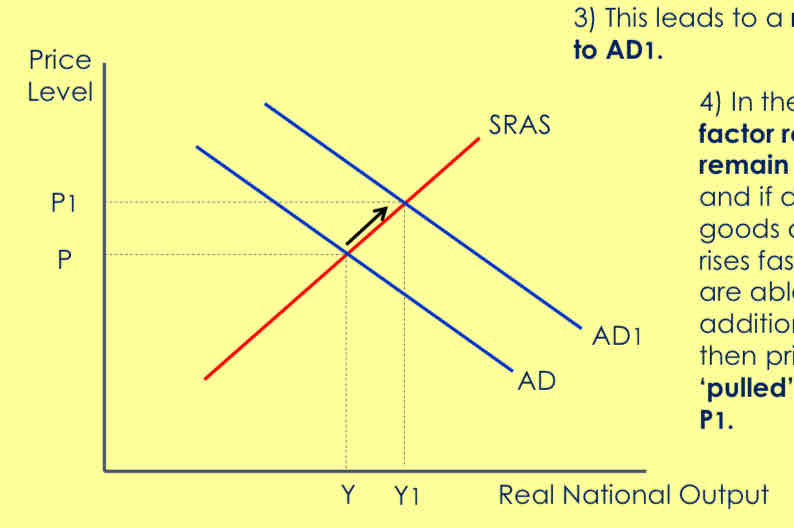
Show Demand pull inflation on an AS/AD diagram
Begin with the equilibrium position
If there is a cut in interest rates, this makes borrowing on credit more attractive, and saving less rewarding so consumption may rise.
This leads to a rise in AD to AD1.
In the short-run, factor resources remain unchanged and if demand for goods and services rises faster than firms are able to provide additional supply, then prices will be ‘pulled’ upwards to P1.
What are the causes of demand-pull inflation?
Reduced taxation
➢Increases disposable income
Lower interest rates
➢Makes borrowing more attractive and saving less rewarding - firms borrow to invest in capital
A general rise in consumer spending
➢Perhaps from higher incomes and consumer confidence
Improved availability of credit
➢Banks/Building Societies widen the availability of credit or make it more affordable
A weak exchange rate
➢Will boost export growth
Fast growth in other countries
➢May increase demand for UK exports
General rise in confidence / expectations of future growth
➢May feed through to higher consumer spending and investment
Certainty
➢Links to confidence and assists consumers and firms in their spending and investment decisions
What is Cost-push inflation?
This occurs when firms respond to rising costs of production by increasing prices
Firms will typically do this to protect profit margins
What are the causes of cost-push inflation?
Wage increases
➢ For many firms, wages is their largest single cost of production
➢ It is likely that if prices are rising, workers will demand higher wages in order to maintain their ‘real’ incomes
➢ If these higher wage costs are reflected in higher prices, then workers will continue to demand higher wages, leading to a wage-price spiral
Higher raw material costs
➢ As primary raw materials become more scarce and in even greater demand, raw materials and associated components may rise in price
Higher taxes
➢ The government may impose higher taxes on firms; for example, corporation tax, national insurance or taxes on waste disposal
Higher import prices
➢ A weaker exchange rate or rising prices abroad mean that imported components feed through to higher costs of production
Natural disasters
➢ May temporarily or permanently reduce the supply of raw materials or disrupt the supply chain, adding to a firms costs
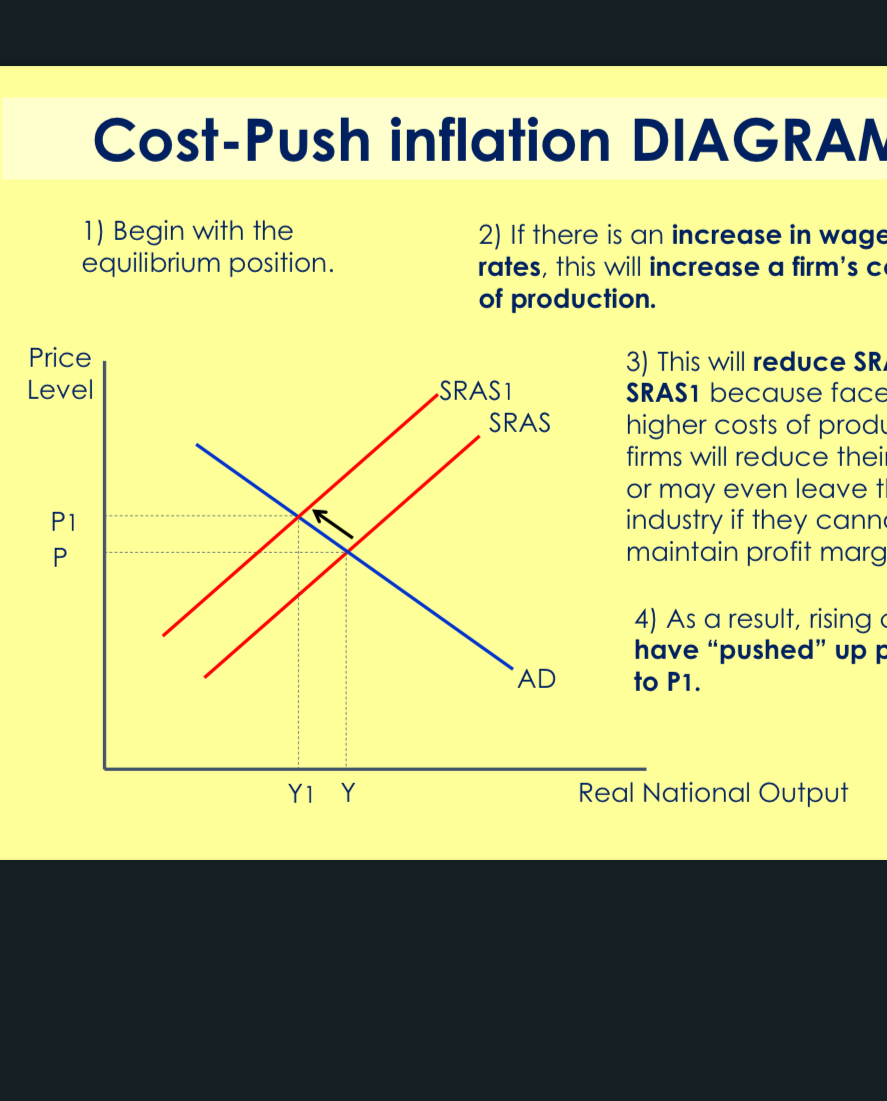
Explain the Cost-Push inflation diagram:
1) Begin with the equilibrium position.
2) If there is an increase in wage rates, this will increase a firm’s costs of production.
3) This will reduce SRAS to SRAS1 because faced with higher costs of production, firms will reduce their supply, or may even leave the industry if they cannot maintain profit margins.
4) As a result, rising costs have “pushed” up prices to P1.
What is deflation?
Deflation is a decrease in the general price level
What are the causes and problems of deflation?
Deflation is a decrease in the general price level of goods and services, often linked to reduced consumer demand and slow economic growth.
can lead to a vicious cycle of reduced spending and investment, worsening economic conditions such as increased unemployment and debt burden
consumers and businesses struggle with lower revenues while costs remain fixed.
How do changes in world commodity prices affect domestic inflation?
Commodities such as oil and food make up a large proportion of UK imports
Many of the commodities that are bought in the UK are price inelastic products
Therefore, a rise in the world price of commodities will feed through to UK inflation
What are the most important types of Cost-Push inflation?
Wage push inflation
Imported inflation
What is disinflation?
fall in the rate of inflation
What is the inflation rate?
The annual rate of change of the average price of goods and services.
What are the internal causes of inflation?
higher wages/labour costs
large surge in property prices
Rise in business taxes
Boom in credit
What are the external causes of inflation?
increase in world oil/gas prices
Inflation in global commodity prices
Depreciation of the exchange rate
High inflation in other countries
Who are the winners and losers of high inflation?
Winners
• Workers with strong wage bargaining power
• Debtors if real interest rates are negative
• Producers if prices rise faster than costs
Losers
• Retired on fixed incomes
• Lenders if real interest rates are negative
• Savers if real returns are negative
• Workers in low paid jobs
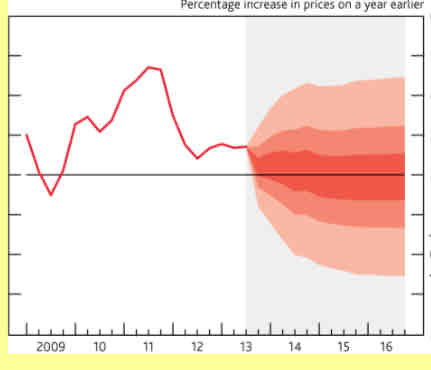
Why is inflation difficult to forecast?
Volatile global energy prices
Changes in value of the currency
Government indirect taxes can change
Volatile food prices
Uncertain growth of aggregate demand
What is the conflict between reducing unemployment and reducing the rate of inflation?
Reducing unemployment - through government spending to create jobs, which will increase demand and lead to an increase in inflation
Reducing inflation -through less government spending will reduce demand which lead to an increase in unemployment
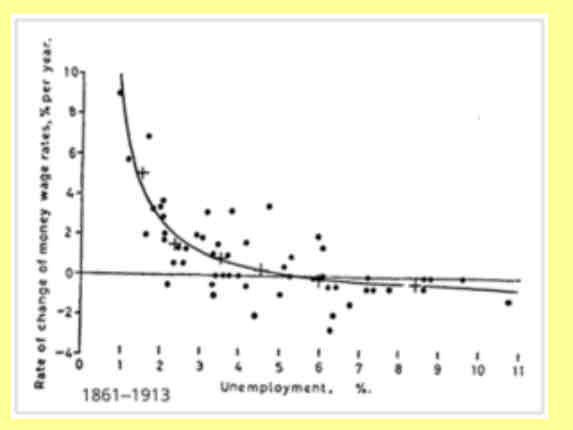
What is the Phillips Curve?
A.W. Phillips studied the relationship between unemployment and the rate of change of money wages.
Phillips suggested that there was a trade-off in the short–run between unemployment and inflation
What does the Phillips curve highlight?
how the unemployment % rate affects the % change in the wage rate and therefore, inflation
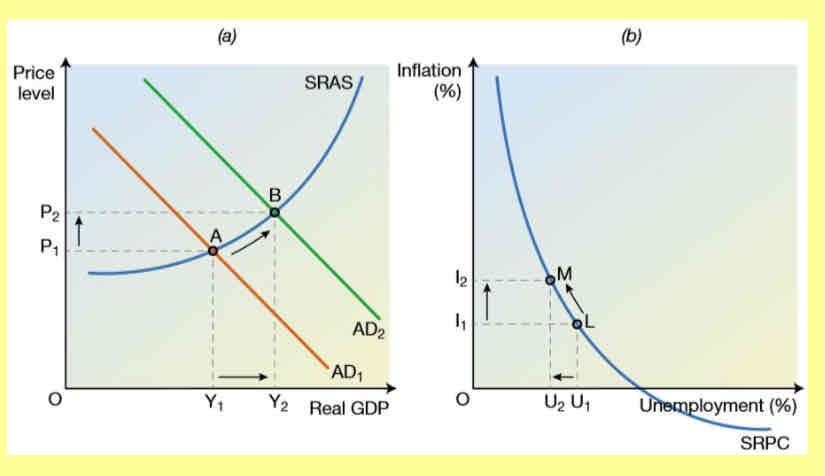
What would the Trade off be?
lower inflation is achievable at the expense of higher unemployment.
Show an AS/AD curve to highlight the impact of the trade off
What is a trade off?
where gaining one advanatge means sacrificing another, a balancing act of compromises when many factors are at play
What does stagflation mean?
when an economy experiences both high inflation and high unemployment at the same time
What does Non accelerating inflationary rate of unemployment (NAIRU) mean?
rate of unemployment that is associated with stable rates of inflation
What does money illusion mean?
individuals and firms don’t distinguish between nominal & real values of money when taking decisions
What is the Long run Phillips curve/ L-shaped Phillips curve mean?
A vertical Phillips curve developed by Milton Friedman and Edmund Phelps.
Free market economists believe that the Phillips curve is vertical, as expectations play a key role in the link between unemployment and inflation and therefore trade-offs are not possible.
Explain the Long Run Phillips Curve:
Free-market economists believe that in the long-run, output always returns to a long run equilibrium path.
They also argue that the economy will revert back to a level of output where unemployment returns to the natural rate of unemployment (NRU)
The LR Phillips curve is drawn vertical to show the limited
relationship between unemployment and inflation
It intersects the SRPC where the rateof inflation is zero. At this point the natural rate of unemployment (NRU) shown by UN
Talk about the NAIRU in more detail:
level of unemployment where there is no inflationary pressure
The short-run Phillips curve showed that as unemployment fell, aggregate demand would rise and so create inflationary pressure
However, due to the existence at times of supply- side slack, it is possible to reduce unemployment without creating inflationary pressure
Beyond a certain point, any reductions in unemployment will lead to inflation
This point is known as the Non-Accelerating Inflation Rate of Unemployment (NAIRU)
What are implications of the Long Run Phillips Curve?
➢The LRPC, or L-Shaped Phillips Curve, demonstrates that any attempts to reduce unemployment below its natural rate would only lead to inflation
➢Therefore, attempts by government to reduce unemployment through expansionary policies that seek to boost aggregate demand are ineffective and simply create another problem
➢Consequently, the theory of the LRPC demonstrates that improvements must be made to the supply-side of the economy
➢Due to the role of expectations in the model, governments should also attempt to keep control of inflationary expectations amongst all economic agents
➢It has been argued by some economists that the government decision to make the Bank of England independent in 1998 with sole responsibility for monetary policy and the inflation target, has helped to anchor inflationary expectations around the 2% level until now
What are the implications of the SRPC and LRPC on government policy?
• Policies that enhance the supply side of the economy and labour market are most appropriate, given the issues highlighted by the LRPC theory
• These should focus on reducing the problems caused through frictional and structural unemployment
Such policies might include:
✓ Education and training to enhance skills and employability
✓ Reducing JSA to enhance incentives to work and reduce the unemployment trap
✓ Encourage firms to offer flexible working patterns
✓ Improve job centres/job information to help workers
✓ Improve geographical mobility through e.g. affordable housing