Hypothesis testing part 1
1/13
There's no tags or description
Looks like no tags are added yet.
Name | Mastery | Learn | Test | Matching | Spaced | Call with Kai |
|---|
No analytics yet
Send a link to your students to track their progress
14 Terms
hypotheiss testing
quantify observed difference
asses how likely it is that this differenced occured by chance alone
choose a critical value in terms of probability
e.g. 95% etc
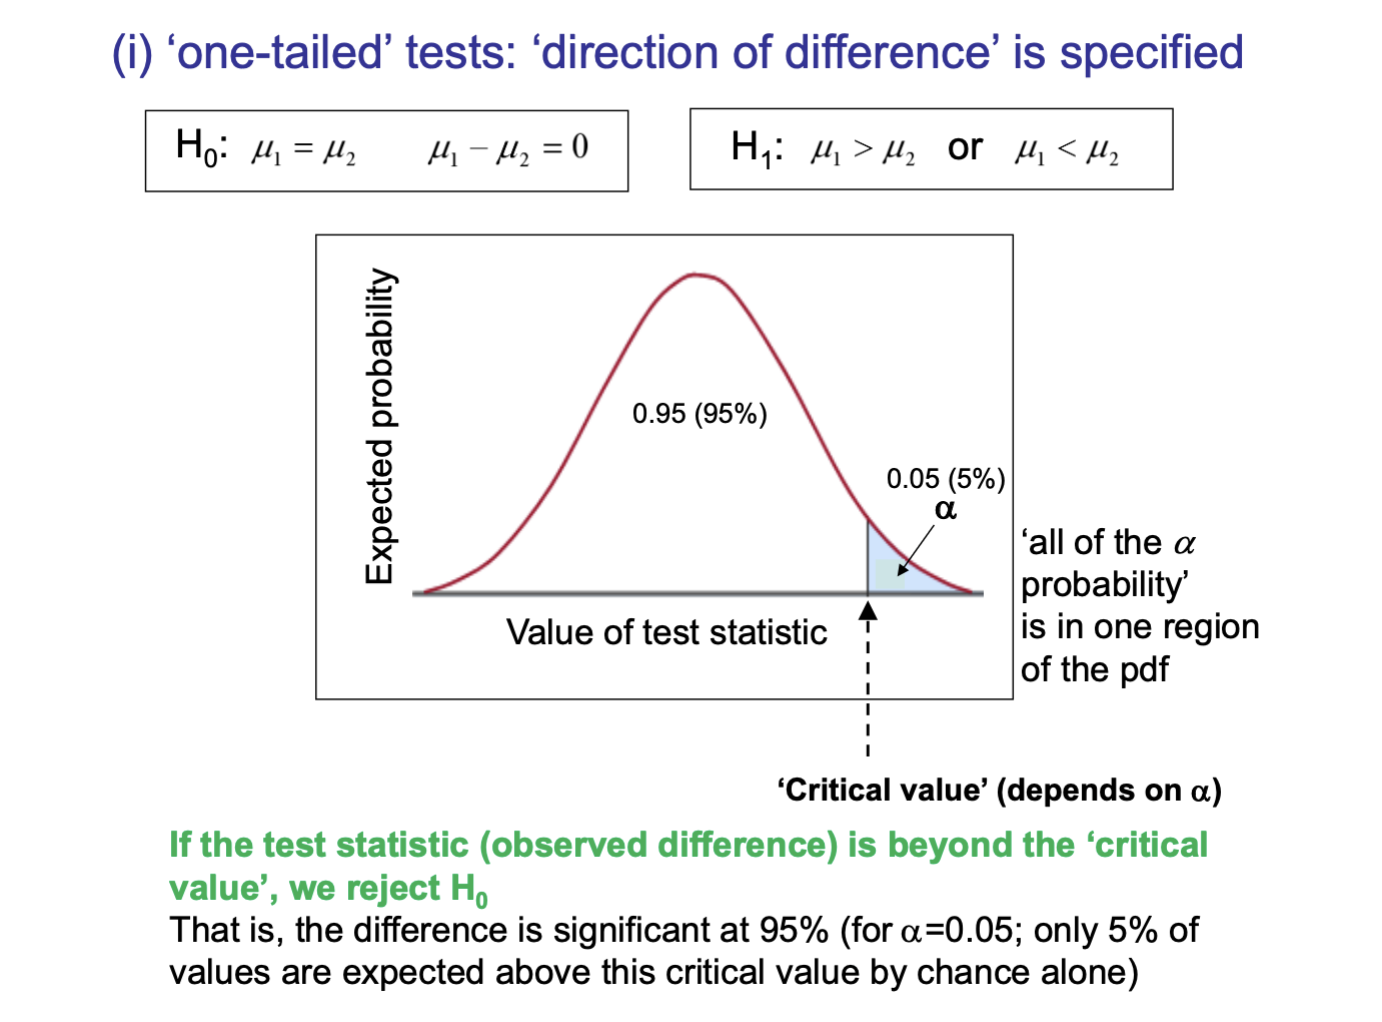
one tailed tests
direction of difference is specified
alpha is the area shaded in the graph / the bit we are looking at
rest of of the curve is the confidence level
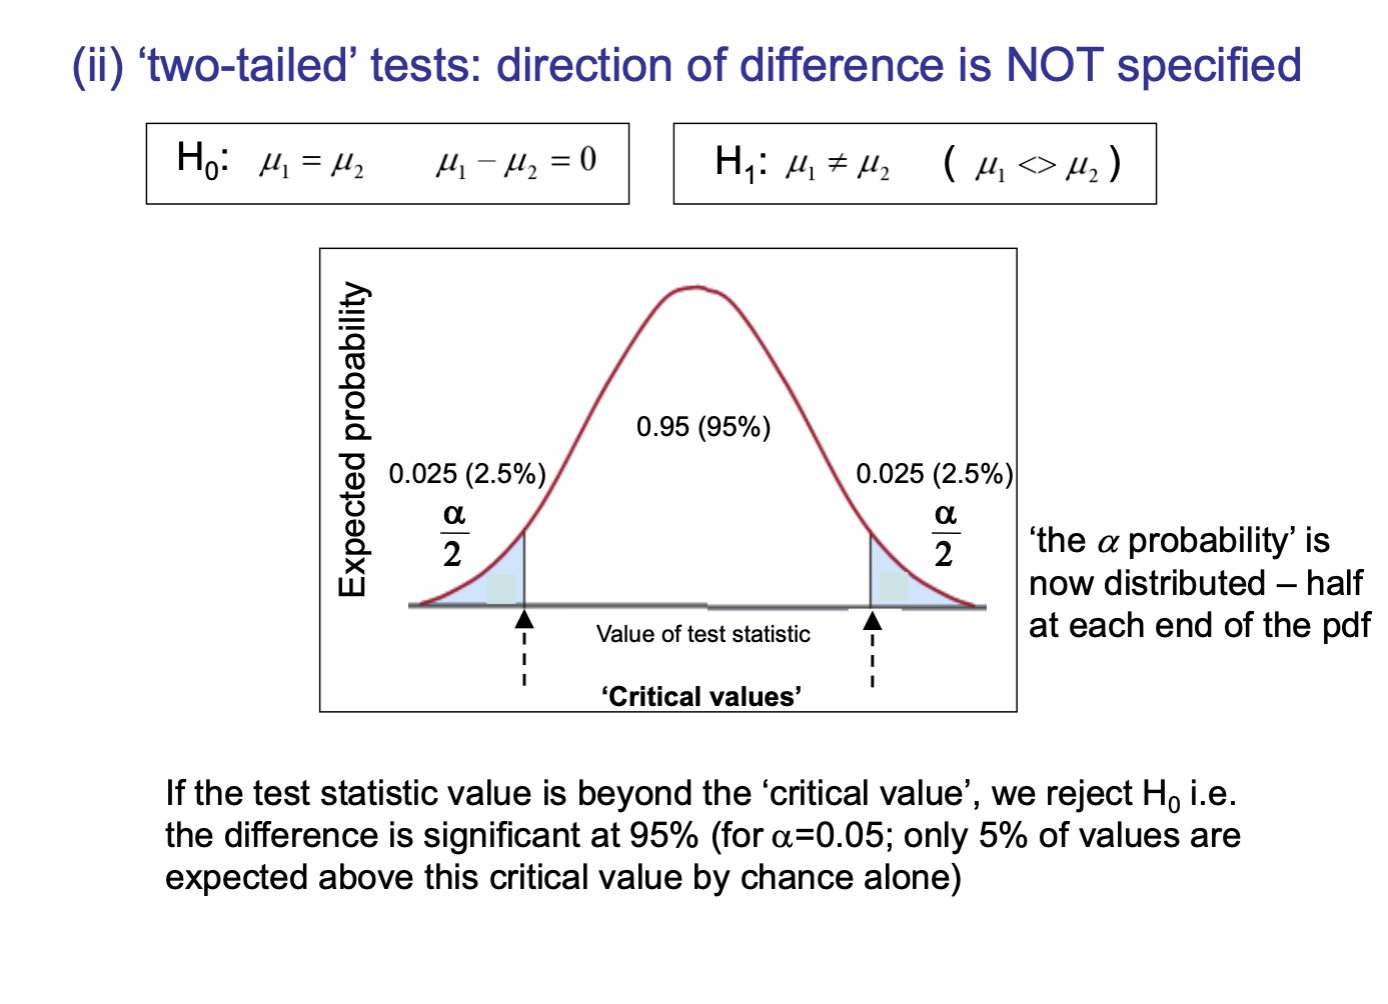
two tailed tests
direction not specified
alpha split in half
hypothesis test details
formulate null and alternative hypothesis
decide on significance level
select appropriate test
look up critical value - threshold for rejection null
if test is beyond the critical value reject null at a level of confidence equal to 1 - alpha in %
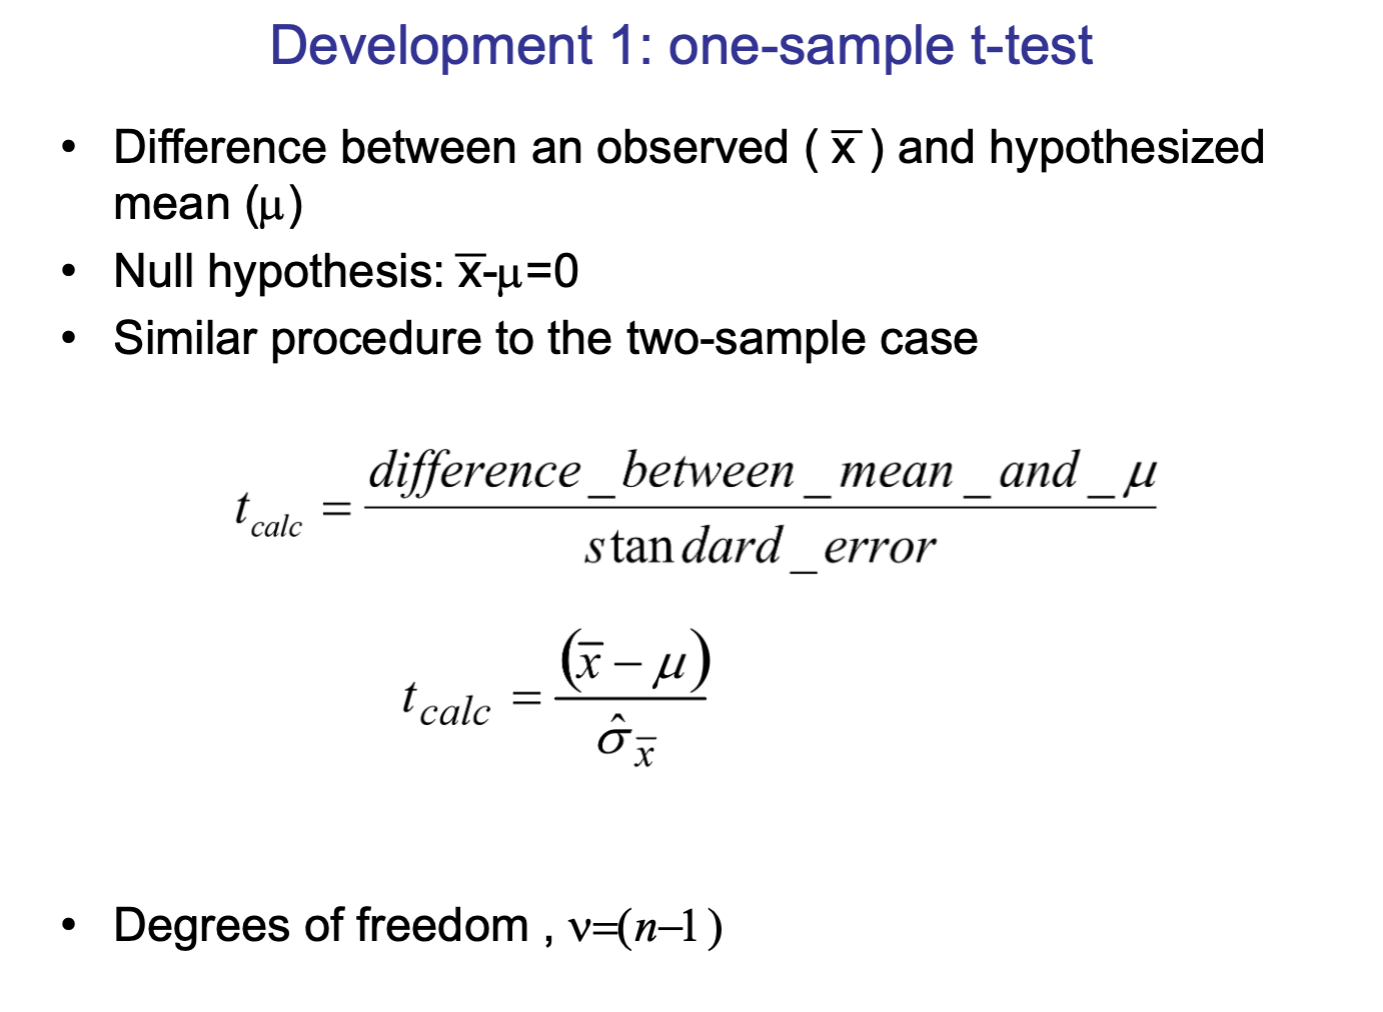
1 sample t test
compare a sample mean to a chosen value
2 sample t test
compare 2 means each from their won sample
smaller than 30 - will not be normal distribution
larger than. 30 - will roughly resemble normal distribution
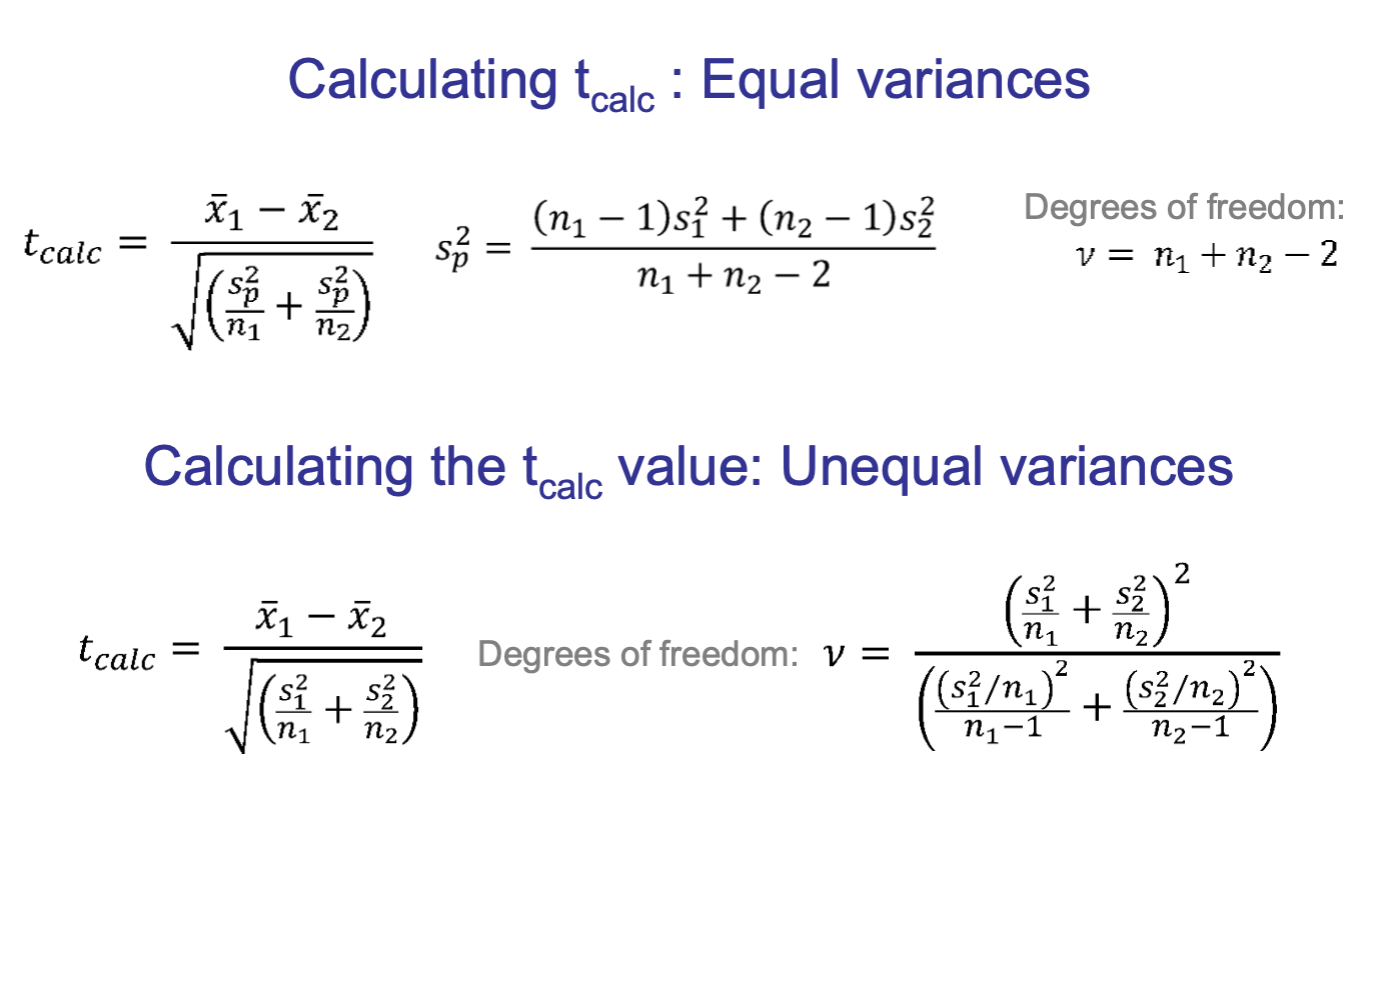
equal or unequal variances ?
stds similar = equal variances
otherwise - use unequal variances
for this one do the sp formula first, then the t calc formula
then use the degrees of freedom formula
look up critical value
if t crit is greater than t calc - have evidence to reject null
calculate t statistic
for this one do the sp formula first, then the t calc formula using the value u get from the first formula
then use the degrees of freedom formula
remember in degrees of freedom to divide sample number by 2

compare the test statistic and the critical value
reject the null as a level of confidence equal to 100(1- alpha) of the t calc value is greater that the t critc value
type 1 error
rejecting null hypothesis which is true
is alpha is set too high
Type 2 error
failing to reject a null hypothesis which is true
ANOVA
comparing multipel samples
between 3 or more samples