Macroeconomics Theme 2 <3
5.0(1)Studied by 4 people
Card Sorting
1/119
Earn XP
Description and Tags
Last updated 5:47 PM on 4/30/23
Name | Mastery | Learn | Test | Matching | Spaced | Call with Kai |
|---|
No analytics yet
Send a link to your students to track their progress
120 Terms
1
New cards
ceteris paribus
all other things stay the same
2
New cards
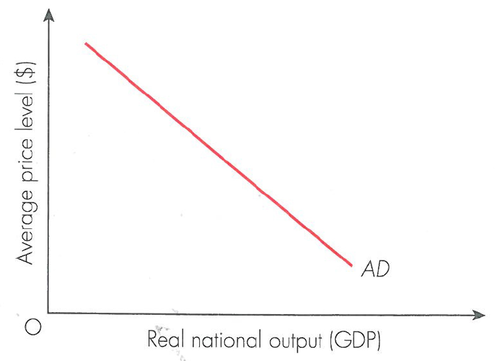
aggregate demand
the total amount of planned spending on goods and services
3
New cards
aggregate demand formula
AD = C + I + G + (X-M)
4
New cards
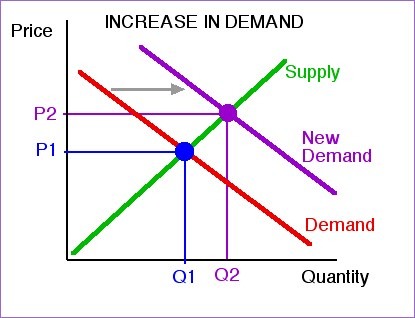
shift in AD
changes to components of AD
5
New cards
consumption
spending by households on goods and services
6
New cards
disposable income
The amount of money that households have available for spending and saving after taxes
7
New cards
marginal propensity to consume (MPC)
the proportion of additional income that is spent on goods and services
8
New cards
marginal propensity to save (MPS)
the proportion of additional income that is saved not spent
9
New cards
MPC
change in consumption/change in income
10
New cards
MPS formula
1-MPC
11
New cards
wealth
the value of assets owned
12
New cards
income
flow of money
13
New cards
collateral
an asset that a borrower pledges to a lender as a security for a loan
14
New cards
interest rates
the reward of saving and cost of borrowing
15
New cards
wealth effect
increase in house prices
higher perceived wealth
increase consumption
higher perceived wealth
increase consumption
16
New cards
investment
accumulation of capital stock
17
New cards
gross investment
total amount that the economy spends on new capital
18
New cards
net investment
gross investment - capital depreciation
19
New cards
factors that affect investment
1 rate of economic growth
2 confidence levels
3 interest rates
4 government decisions
5 access to credit
6 regulation
7 animal spirits (not rational)
2 confidence levels
3 interest rates
4 government decisions
5 access to credit
6 regulation
7 animal spirits (not rational)
20
New cards
recession
2 consecutive quarters of negative real GDP
21
New cards
budget deficit
G > T
22
New cards
budget surplus
G < T
23
New cards
austerity
decrease spending to lower the budget deficit
24
New cards
automatic stabilisers
factors that automatically work toward stabilising the economy by reducing the short term fluctuation of the business cycle(income tax and unemloyment benefits)
25
New cards
fiscal stimulus
increasing the growth of the economy through fiscal policy and government spending
26
New cards
trade balance (net exports)
the value of exports - the value of imports
27
New cards
exchange rate
the value of one currency against another
28
New cards
current account deficit
M > X
29
New cards
current account surplus
M < X
30
New cards
marginal propensity to import (MPM)
the proportional increase in imports from an increase income
31
New cards
SPICED
strong pound imports cheap exports dear
32
New cards
WPIDEC
weak pound imports dear exports cheap
33
New cards
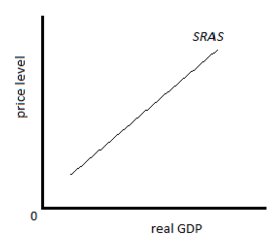
short run aggregate supply
atleast on factor of production is fixed
34
New cards
factors of production
1 land
2 labour
3 capital
4 enterprise
2 labour
3 capital
4 enterprise
35
New cards
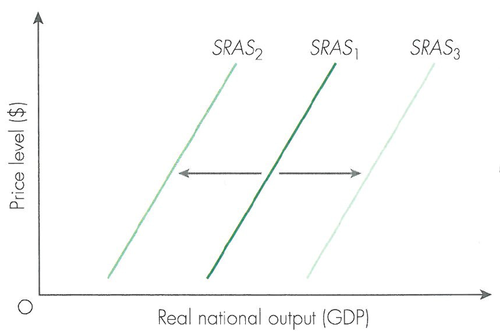
shifts in SRAS
1 changes in cost of raw materials
2 changes in the level of international trade
3 changes in exchange rate
4 changes in tax
2 changes in the level of international trade
3 changes in exchange rate
4 changes in tax
36
New cards
long run aggregate supply
all factors of production are variable
37
New cards
shifts in LRAS
changes in productivity or quantity of factors of production
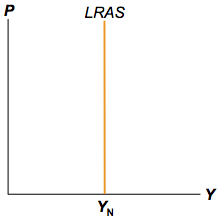
38
New cards
classical LRAS curve
in the LR the economy will have full capacity
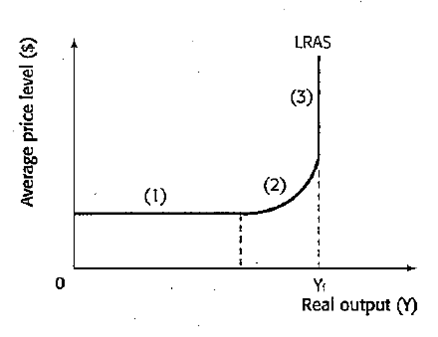
39
New cards
keynesian LRAS curve
in the LR there is spare capacity
40
New cards
gross domestic product (GDP)
the total value of all goods and services produced annually in an economy
41
New cards
real GDP growth
percentage increase in the total value of good and service adjusted for inflation
42
New cards
economic growth
real GDP growth
43
New cards
actual growth
% increase in real GDP
44
New cards
potential growth
shift in LRAS
45
New cards
sustainable growth
an increase in GDP that can be maintained without creating other problems
46
New cards
output gap
the difference between actual and potential GDP
47
New cards
factors that influence a reccession
1 fall in GDP growth
2 fall in confidence
3 fall in consumption
4 fall in global trade
5 increasing unemployment
2 fall in confidence
3 fall in consumption
4 fall in global trade
5 increasing unemployment
48
New cards
benefits of growth
1 more employment
2 more investments
3 more tax revenue
4 increase in living standards
2 more investments
3 more tax revenue
4 increase in living standards
49
New cards
cost of growth
1 inequality in wealth
2 inflation will go above 2%
3 negative externalities
4 leakages from the circular flow of income
2 inflation will go above 2%
3 negative externalities
4 leakages from the circular flow of income
50
New cards
characteristics of a boom
1 high rates of economic growth
2 near full capacity or positive output gaps
3 low unemployment
4 high inflation
5 High confidence
6 budget surplus
2 near full capacity or positive output gaps
3 low unemployment
4 high inflation
5 High confidence
6 budget surplus
51
New cards
characteristics of a recession
1 negative economic growth
2 lots of spare capacity and negative output gaps
3 high unemployment
4 low inflation
5 low confidence
6 budget deficit
2 lots of spare capacity and negative output gaps
3 high unemployment
4 low inflation
5 low confidence
6 budget deficit
52
New cards
business cycle
alternating periods of economic booms and economic recessions
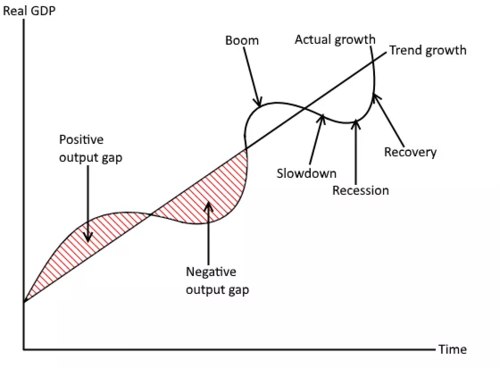
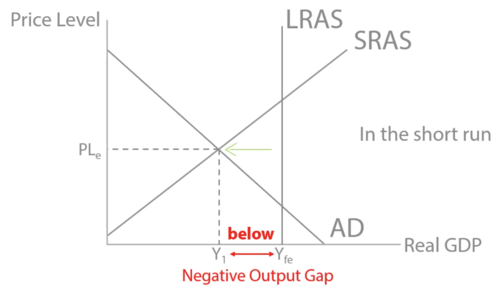
53
New cards
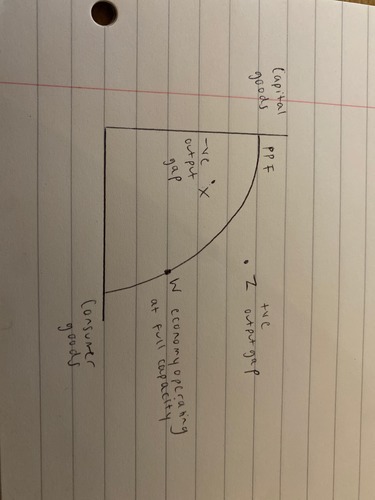
negative output gaps
where the economy is producing less than potential output
54
New cards
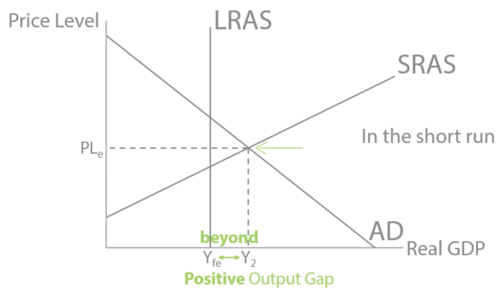
positive output gap
where the economy is producing more than potential output
55
New cards
production possibility frontier (PPF)
maximum combinations of goods and services that can be produced if all resources are used efficiently
56
New cards
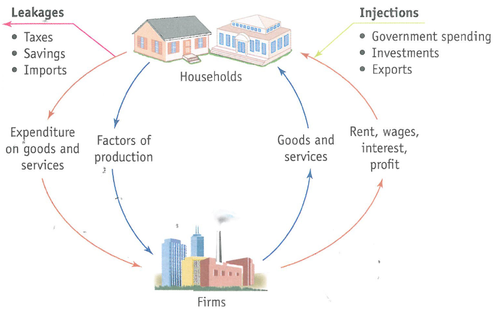
circular flow of income
a model of the economy that shows the flow of goods, services and factors of production around the economy
57
New cards
injection
investment
exports
government spending
exports
government spending
58
New cards
withdrawal
spending
imports
taxes
imports
taxes
59
New cards
multiplier effect
an increase in spending, increases national income and consumption greater than the initial amount spent
60
New cards
multiplier formula
1/(1-MPC)
61
New cards
MPW formula
MPW = MPS + MPT + MPM
62
New cards
MPC formula
1 - MPW
63
New cards
Change in GDP formula
change in GDP = change in injections x multiplier
64
New cards
measuring GDP
total output = total income = total expenditure
65
New cards
problems with GDP
1 underground markets
2 income distribution
3 size of public sector
4 quality of data
2 income distribution
3 size of public sector
4 quality of data
66
New cards
gross national income (GNI)
GNI = GDP + net income from abroad
67
New cards
nominal GDP
GDP measured in current prices not adjusted for inflation
68
New cards
real GDP formula
(nominal GDP/price index) x 100
69
New cards
GDP per capita formula
real GDP/population
70
New cards
purchasing power parity (PPP)
the amount of money needed in one country to purchase the same goods and services in another country
71
New cards
base year
benchmark year which other years are compared against
72
New cards
price level
average value of goods and services as an index value
73
New cards
inflation
sustained increase in the general price level
74
New cards
deflation
a sustained decrease in the general price level
75
New cards
disinflation
a fall in the inflation rates
76
New cards
consumer price index (CPI)
weighted average of basket of good
77
New cards
basket of goods
weighted by percentage expenditure compared to income
78
New cards
percentage change
change/original x 100
79
New cards
problems with CPI
1 might not be relevant to everyone
2 not measured accurately
3 ignores substitution effect
4 ignores changes to quality of goods
2 not measured accurately
3 ignores substitution effect
4 ignores changes to quality of goods
80
New cards
retail price index (RPI)
a measure of inflation
81
New cards
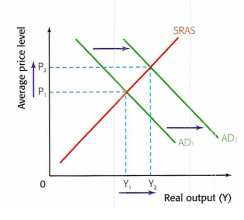
demand pull inflation
increase in AD
82
New cards
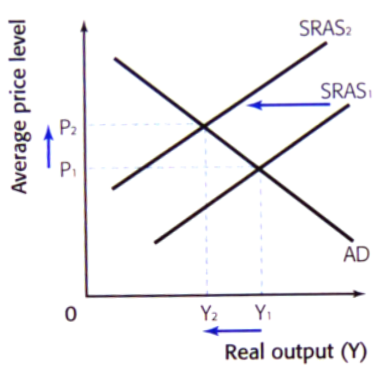
cost push inflation
decrease in SRAS
83
New cards
wage price spiral
expected inflation
wage bargaining
increase in cost
increase in inflation
wage bargaining
increase in cost
increase in inflation
84
New cards
effects of high inflation
borrowers - real value of debt decreases
savers - value of your saving decreasing
savers - value of your saving decreasing
85
New cards
cost of inflation
1 higher cost of living
2 wage price spiral
3 decrease the value of savings
4 increase in unemployment
5 value of exports decreases
6 bad for people with fixed incomes
2 wage price spiral
3 decrease the value of savings
4 increase in unemployment
5 value of exports decreases
6 bad for people with fixed incomes
86
New cards
benefits of deflation
1 increase in value of savings
2 technology improvements and decrease in costs of production
3 increase in current account
2 technology improvements and decrease in costs of production
3 increase in current account
87
New cards
cost of deflation
1 value of our debt increases
2 downward wage price spiral
3 unemployment
4 investments are shifted abroad
2 downward wage price spiral
3 unemployment
4 investments are shifted abroad
88
New cards
causes of deflation
increase in LRAS
decrease in AD
decrease in AD
89
New cards
measures of unemployment
claimant count
ILO measure
ILO measure
90
New cards
claimant count
The number of people claiming jobseekers allowance
91
New cards
international labour organisation (ILO)
a survey asked to people aged 16-65 if they have been out of work for the past 4 weeks and if they are ready to work within the next 2 weeks
92
New cards
unemployment formula
unemployed/(unemployed + employed) x 100
93
New cards
types of unemployment
1 frictional
2 structural
3 cyclical
4 seasonal
2 structural
3 cyclical
4 seasonal
94
New cards
frictional unemployment
when people are between jobs
95
New cards
structural unemployment
mismatch of skilled workers and skills demanded
96
New cards
cyclical unemployment
when demand for labour is low in a recession
97
New cards
seasonal unemployment
demand for labour is relatively low in certain times of the year
98
New cards
underemployment
workers are overqualified for their jobs or work fewer hours than they would prefer
99
New cards
occupational mobility of labour
The ability to change occupations
100
New cards
geographical mobility of labour
The ability to move from one location to another for work