PSAT mid term
1/42
There's no tags or description
Looks like no tags are added yet.
Name | Mastery | Learn | Test | Matching | Spaced | Call with Kai |
|---|
No analytics yet
Send a link to your students to track their progress
43 Terms
Quantitative variables
Expressed as numbers
Categorical
In categories not, numbers
Distribution is
The values a variable can take on
What is range
Range = maximum - minimum
What is the sample median
The middle number of data set (set is in numerical order)
How do you find the IQR
Find the overall median, then the median of the lower half of data (q1) then find median of upper half of data(q2). Then calculate for IQR. IQR=Q3-Q2
What would happen to the IQR if a student's travel time of 35 minutes was mistakenly entered as 65 minutes?
Nothing, the median of the data set would not be affected
Box plots don’t show…..
Distribution of data
to calculate the mean…
Add all the numbers of the data set, and divide by the amount of data points
What is the standard deviation
How much a point departs from the mean
Deviation=
Data point - mean
S is
The sample standard deviation
N is
Sample size
To describe a distribution you need to use SCOS. What does SCOS stand for
S is shape/ modes and symmetry. O is outliers. C is center/ using mean for symmetric data and meadian for skewed data. S is spread/ standard deviation for symmetric data and IQR for skewed data
_
X
Is the mean statistic notation
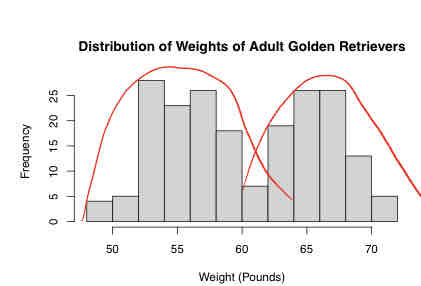
Bi-modal
Means there’s two different sections in the data
Unimodal
Data is all in one group
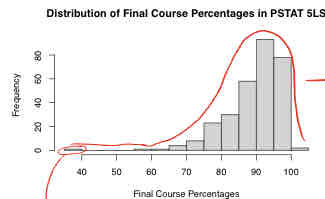
What direction is the skew
Left
The graph is skewed…..
in the direction that has the longer tail
A parameter is
The entire population (all of ucsb students)
The mean parameter notion
Standard deviation parameter notion
Variance parameter notion
Mean statistic notion
Standard deviation Statistic notion
Variance statistic notation
Explanatory variable might effect ________
Response variable
Random assignment is
Casual
Random sampling is
Generalizable
SRS is
Random sampling
SRS means that everyone in the population
Has an equal chance of being selected, the resulting sample is representative of the population
Stratified Sampling:
Divide the population into groups (strata) and sample within each.
Multistage Sampling:
Combine clustering and individual sampling.
p
population proportion
^
p
sample proportion
the null always assumes
nothing special is happing
null is denoted by
Ho
the alternative hypothesis is denoted by
Ha
a normal distribution is shaped like a
bell

describes….
the spread/ variability of the distribution

specifies….
the center of distribution
a z-score is also a
standard score, aka a standard deviation
the z- score formula is
x - u
—-
o