Macroeconomic objectives
1/35
There's no tags or description
Looks like no tags are added yet.
Name | Mastery | Learn | Test | Matching | Spaced | Call with Kai |
|---|
No study sessions yet.
36 Terms
economic growth
an increase in real GDP
short term economic growth
changes to any components of AD causes short term economic growth
illustrated by shift right in AD
can also be illustrated by PPC
increase in production causes a point inside the curve to move to a point closer to the curve
this is an increase in real GDP
long term growth
caused by any improvements to determinants of LRAS
illustrated by right shift of LRAS
or shift outwards of PPC
calculating economic growth rates
measured by change in real GDP between 2 time periods
calculate nominal GDP for 2 time periods
calculate real GDP for each period using GDP deflator
calculate percentage change in real GDP between 2 time periods
living standards - impact of economic growth
positives
increased income leads to better SOL
increased employment resolves negative social impacts of unemployment
negatives
rising AD causes inflation
increased income leads to greater consumption of demerit goods
greater output requires more time from workers, decreasing wellbeing
environment - impacts of economic growth
positives
improvement in quality/quantity of environmentally friendly technology
negatives
environmental damage caused by negative externalities of production
resources depleted more rapidly
income distribution - impact of economic growth
positives
decreased levels of poverty
higher levels of employment, more tax revenue for govs to distribute on welfare payments
negatives
lack of equity - rich may get richer, poor get poorer
employment
economic use of labour as a factor of production
unemployment
someone not working but actively seeking work
labour force
all workers actively working, plus the unemployed
non labour force: all those not seeking work
full employment
ideal situation where everyone in the economy willing to and able to work has a job
measuring unemployment
ILO labour force survey, claimant count
unemployment rate = no. actively seeking / total labour force x 100
employment rate = no. in employment / population of working age x 100
difficulties in measuring unemployment
underemployment
these people are working
they want to work more hours, they’re working in a job that requires lower skills than they have
often a result of cyclical or structural unemployment
hidden unemployment
when workers lose their jobs, attempt to get a new one for a while, then give up
unemployment rate would be much higher if this was shown
unemployment disparities
unemployment rate is an average
doesn’t provide insight into ethnic, gender, etc disparities that exist in an economy
labour market equilibirum
when demand for labour DL = supply of labour (SL)
diagram has wage rate on y-axis, quantity on x-axis
different causes of unemployment cause disequilibrium of labour market
real wage unemployment
when wages are inflexible at a point higher than free market equilibrium wage
because of minimum wage laws, higher wage creates excess supply of labour
real wage unemployment diagram
market equilibrium at WeQe
government impose minimum wage (NMW)
incentivised by higher wages, supply of labour increases from Qe to Qs
facing higher production costs (increased wage), demand for labour decreases from Qe to Qd
at wage rate W1, there is excess supply of labour equal to QdQs

structural unemployment
when there’s mismatch between jobs and skills in economy, no need for a specific type of worker anymore
structural unemployment diagram
labour market equilibrium at W1Q1
demand for labour shifted left from DL to DL1
wages fell from W1 to W2, quantity of workers in the industry reduced from Q1 to Q2

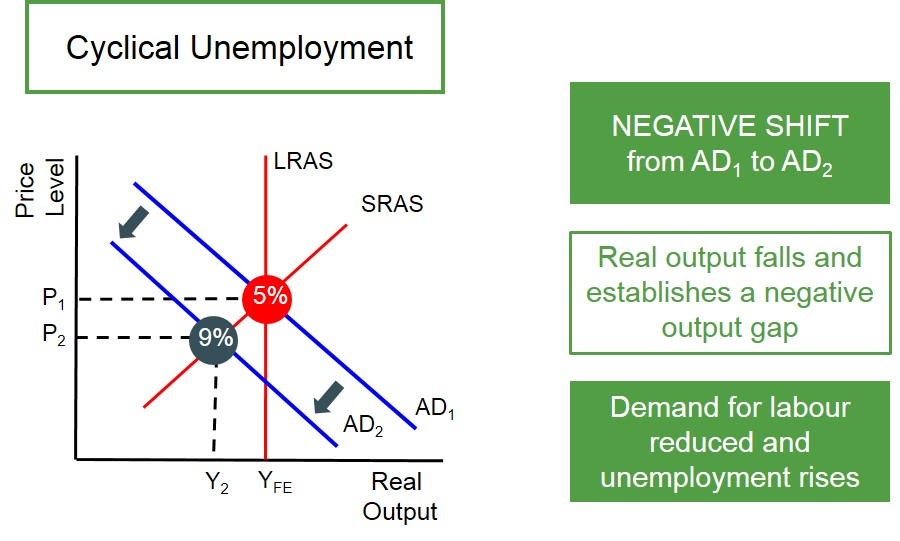
cyclical unemployment
caused by a fall in AD, as output falls, firms lay off workers
cyclical unemployment diagram
frictional and seasonal unemployment
seasonal unemployment: as certain seasons end, labour is not required until the next season
frictional unemployment: when workers are between jobs, short term unemployment
natural rate of unemployment
lowest achievable rate of unemployment
frictional + seasonal + structural unemployment
costs of unemployment
government
receive less tax revenue, higher expenditures in the form of welfare payments
individuals
suffer emotional (stress, self esteem, isolation) and financial (risk of poverty, debt) consequences
firms
harder to find workers to employ once the economy starts to recover
economy
contracts as there is higher level of inefficient use of available resources
inflation & deflation
inflation: sustained increase in average price level of goods in an economy
deflation: fall in average price level of goods in an economy
disinflation: average price levels still rising but at a lower rate than before
measuring inflation using CPI
average price level measured by checking prices of a “basket” of goods that an average household purchases each month, this turns into an index (CPI)
household expenditure survey conducted to determine what goes in basket
goods in basket weighted based on proportion of household spending
each month prices for these goods are gathered from many locations, and averaged
price x weighting determines final value of that good in basket
calculating inflation rate using CPI
CPI = cost of basket in year x / cost of basket in base year x 100
inflation rate = new CPI - old CPI / old CPI x 100
limitations of using CPI
provides a level of inflation for the average basket
CPI doesn’t capture quality of products in basket
CPI only measures changes in consumption on annual basis
CPI is prone to errors in data collection
based on survey, which is small and may be inaccurate
demand pull inflation
caused by excess demand in economy
if any of 4 components of AD increase, AD curve shifts to the right
at original price AP1, there is now excess demand in economy
as prices rise, there is contraction of AD and extension of SRAS
prices for goods increase from AP1 to AP2

cost push inflation
caused by increases in COP
if COP increases, SRAS curve shifts left
at original price AP1, there is now excess demand
as prices rise, contraction of AD and extension of SRAS
prices for goods increase from AP1 to AP2

costs of inflation
firms
uncertainty, rapid price changes create uncertainty and less investment
consumers
decreasing purchasing power
decrease in real value of savings
decrease in real income
government
decrease international competitiveness of export industries as countries exports are more expensive
economic growth slows
workers
demand higher wages to compensate for reduced purchasing power
demand side deflation
equilibrium at APY
any factor which decreases non price determinants of AD causes AD curve to shift left
shift causes fall in AP to AP1
new equilibrium at AP1Y1

consequences of demand side deflation
government
decrease in output = fewer workers required = unemployment increases
consumers
lose confidence = consumption falls = rGDP decreases
debt
debt feels more burdensome as value of any debt is worth more
firms
lose confidence, delay investment
bankruptcies
falling output and prices = reduced profits for firms
exports
falling prices are attractive to foreigners = increased exports
supply side deflation
increase in productive capacity of economy
increase in quality/quantity of FOP
any factor which causes increase in SRAS causes SRAS to shift right
causes fall in AP to AP1

consequences of supply side deflation
unemployment
decrease in costs, output of firms increase
more workers required
consumers
rising output, falling prices, more confidence, more consumption
debt
still feels more burdensome
firms
rising output, falling COP, more confidence, more investment
exports
falling prices cause more international competitiveness, exports increase
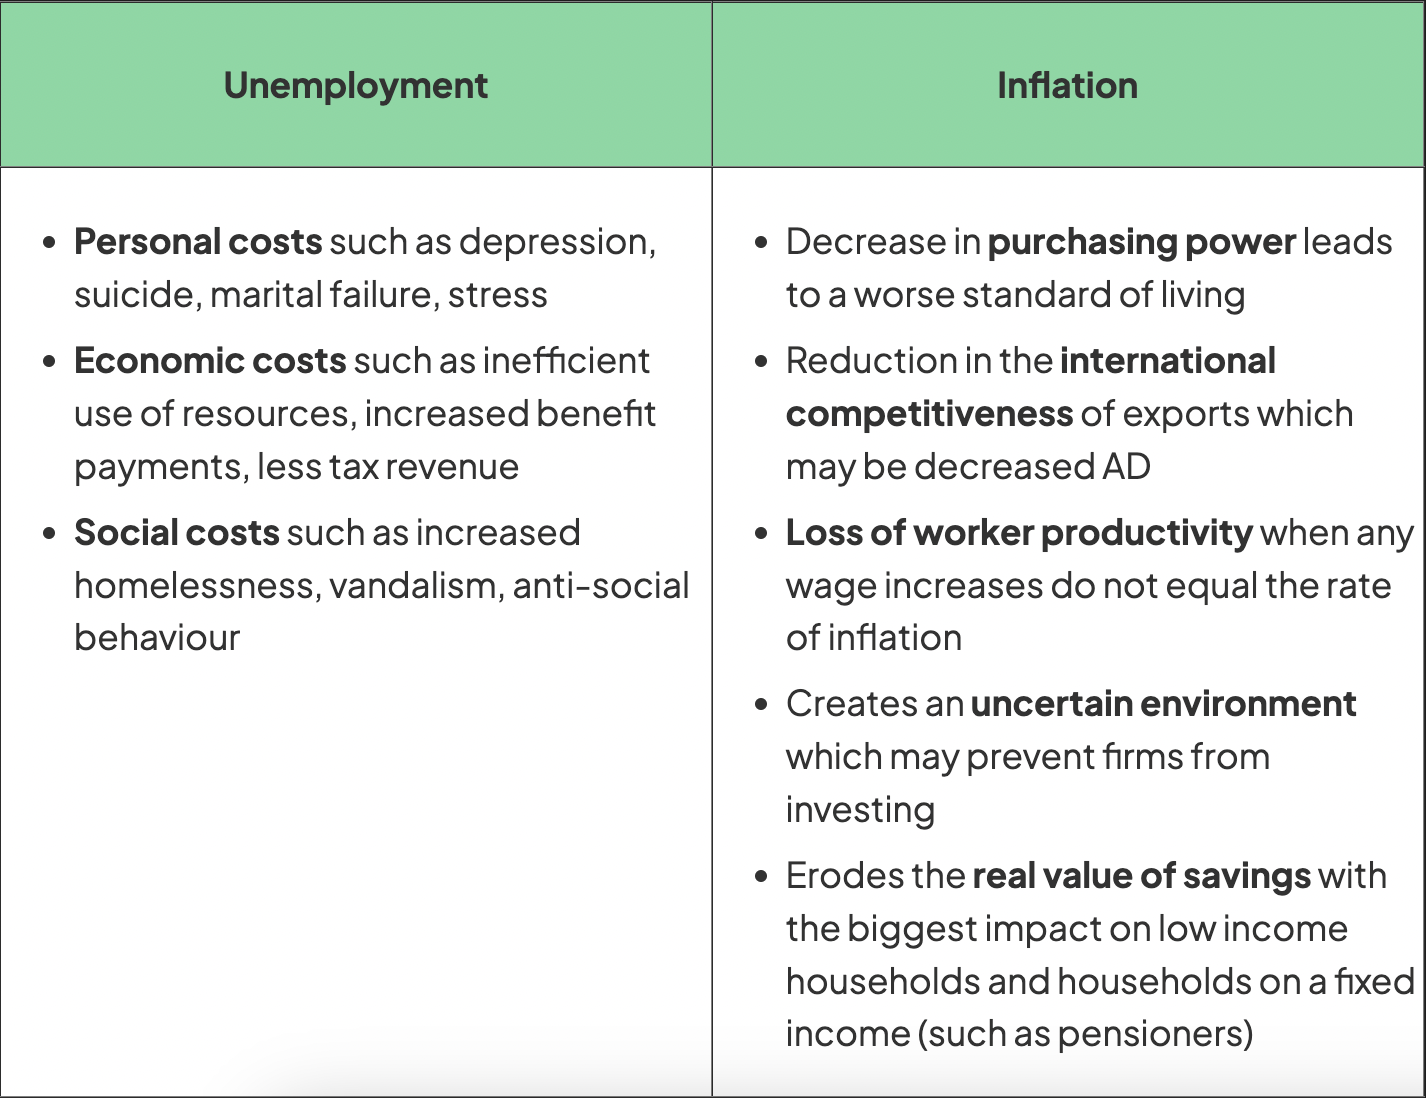
costs of unemployment vs inflation
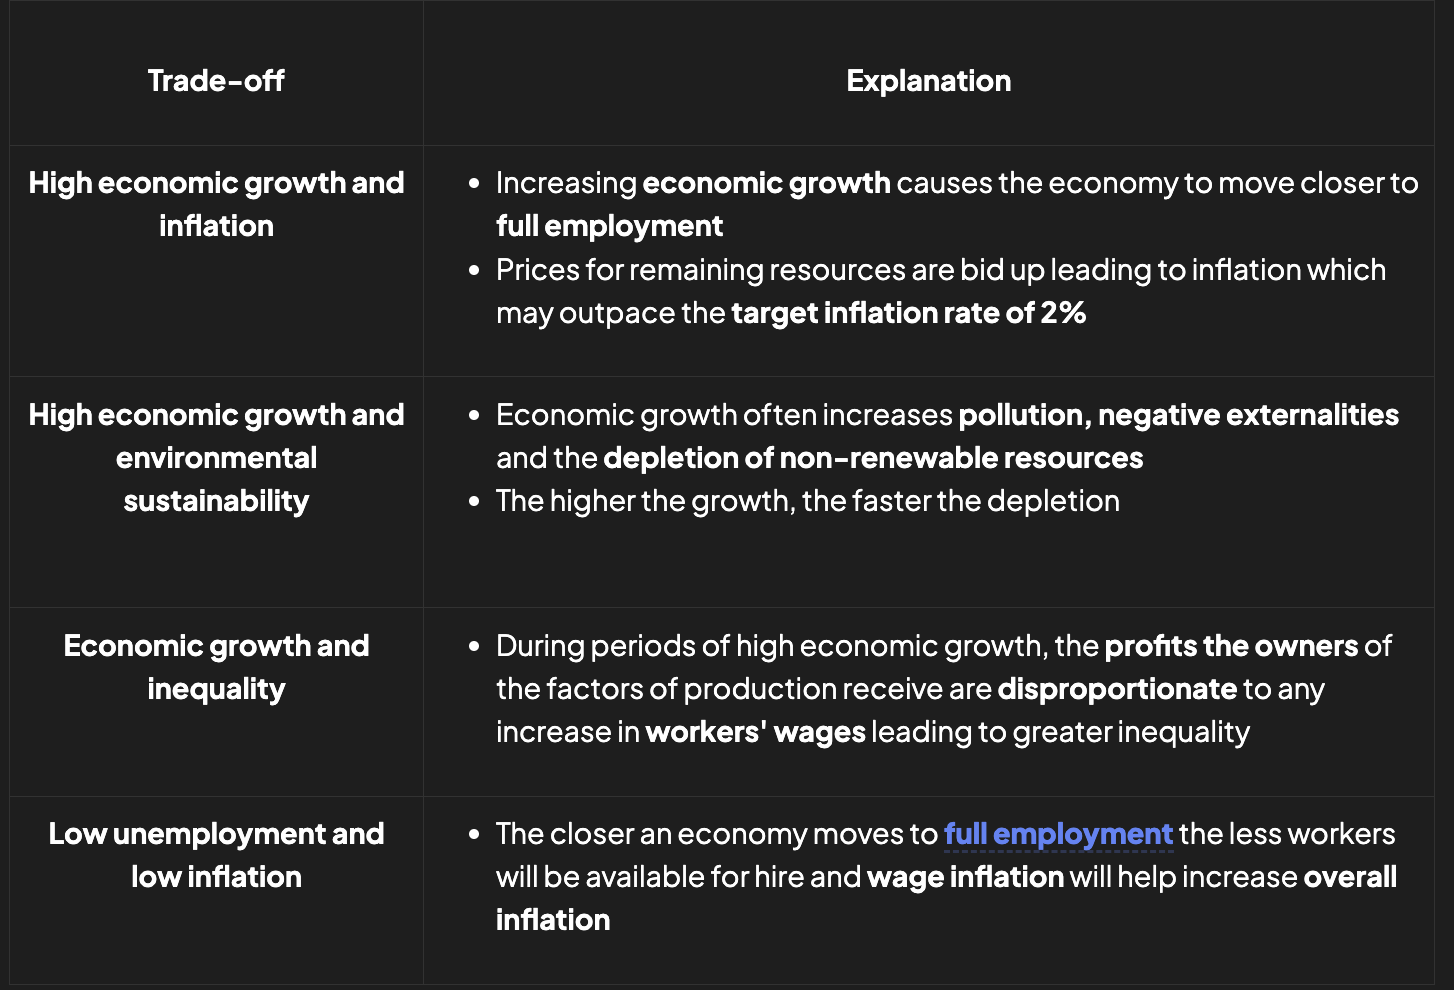
conflicts between macroeconomic objectives