9 - Real time PCR
1/10
There's no tags or description
Looks like no tags are added yet.
Name | Mastery | Learn | Test | Matching | Spaced |
|---|
No study sessions yet.
11 Terms
Comparing qPCR vs PCR
• qPCR - monitors amplification in real time using flourescence, no need for electrophoresis, quantifies gene expression, measures how much target DNA is present in sample during the early exponential phase
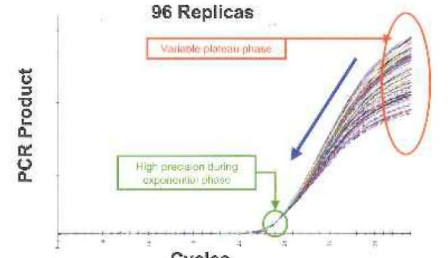
• End point PCR - amplification checked after completion by electrophoresis, no correlation between amount of starting DNA and final product due to plateu phase variability caused by reagent depletion or competition
qPRC principle
• Amplification is proportional to starting DNA at the early exponential phase
• SYBR green - dye that flouresces when bound to dsDNA
• TaqMan probe - 5’ reporter flourophore (FAM) and 3’ quencher that blocks flourescense until probe is cleaved
• Probe binds to DNA, during elongation taq polymerase 5’-3’ exonuclease activity degrades probe, reporter separates from quencher, flourescence emitted
Pros and cons of SYBR green and TaqMan
• SYBR green - low cost, simple, binds non specifically to any dsDNA, no multiplexing, requires melt curve to compare target
• TaqMan - highly specific to target due to custom sequence, expensive due to custom probes, multiplexing (different flourophores), no melt curve
qPCR machine
• Thermal cycler
• Excitation filter - optimises wavelength to excite flourophores
• Emission filter - captures flourescence emitted by dyes or probes
• Amplification plot - flourescence Y axis vs PCR cycles X axis
Applications of qPCR
• Gene expression analysis - measures mRNA levels
• Pathogen detection - quantify viral / bacterial DNA
• Genotyping - detect SNPs / mutations
• GMO testing to verify transgenic DNA
Threshold cycle (ct)
• Cycle number at which flourescense surpasses background noise (detectable amplification)
• Lowe ct indicated higher starting DNA, ct of 20 vs 30 means 1000x more DNA
• Baseline - background flourescence (3-15 cycles)
• Treshold - set 10 standard deviations above baseline, but not always
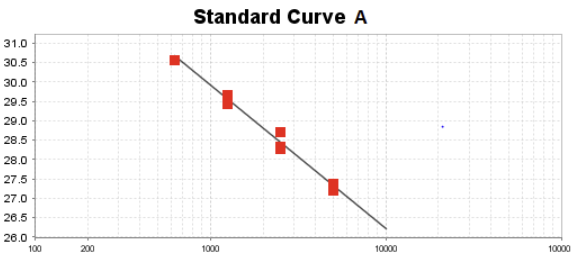
Absolute quantification
• Measures exact copy number by using a standard curve
• The log of known DNA values in plotted against their ct values, the ideal slope is -3.32 (100% efficiency)
• 3.32 change is ct implies a 10% dilution
Relative quantification (RT-qPCR)
• Measures fold changes in gene expression e.g. drug treated vs control
• Reverse transcriptase to convert mRNA to cDNA
• Housekeeping gene (endogenous control) that always has the same expresion (GAPDH) will correct errors like pipetting
• You will get two ct values, one for housekeeping gene and one for sample, compare the fold change
• Compare the change to the calibrator sample (e.g. cells with normal expression) (ΔΔCt)
Example of calculating fold change
• Ct target gene = 22
• Ct housekeeping gene = 20
• Change = 2
• Subtract change of test sample from change of calibrator e.g. 2-5 = -3
• 2^3 = 8x more expressed(change sign)
• 2^-2 = 0.25 = 4x less expressed
ROX dye, melt curve analysis and no template control
• ROX - passive reference flourescent dye that normalises flourescence across samples, corrects pipetting errors or machine variability
• MCA - checks amplicon purity by measuring Tm, single peak means specific amplification, multiple means primer dimers or contamination
• NTC - negative control to detect contamination (ct over 35), amplification in this well invalidates results
Rn value
• Normalised reporter flourescence
• Divide reporter flourescence by ROX flourescence value