Unit 1: Exploring One-Variable Data
1/117
Earn XP
Description and Tags
AP Statistics | 2024-2025
Name | Mastery | Learn | Test | Matching | Spaced | Call with Kai | Chat |
|---|
No analytics yet
Send a link to your students to track their progress
118 Terms
What are statistics?
the science and art of collecting, analyzing, and drawing conclusions from data
What is data analysis?
the process of collecting, analyzing, and drawing conclusions from data
What are individuals?
objects described in sets of data
What are variables?
attributes that can take different values for different individuals
What does a categorical variable do?
assigns labels that place each individual into a particular group, called a category
What does a quantitative variable do?
takes number values that are quantities
How do you tell whether a variable is categorical or quantitative?
if you can take the average of the variable, it’s quantitative, and if you can’t take the average, it’s categorical
What are examples of a categorical variable?
color, type, phone number, ID number
What are examples of a quantitative variable?
age, money, minutes, miles
What are we interested in when looking at variables?
the pattern of variation
What does the distribution of a variable tell us?
what values the variable takes and how often it takes those values
What should you do when analyzing data?
examine each variable by itself, then study the relationships among the variables
start with a graph, then add numerical summaries
What are descriptive statistics?
the process of explanatory data analysis
What are inferential statistics?
the process of drawing conclusions that go beyond the data at hand
What types of graphs are useful when analyzing a distribution?
bar graphs and pie charts
How do bar graphs work?
they compare several quantities by comparing the heights of bars that represent those quantities
Why should you draw the bars of a bar graph equally wide?
because our eyes react to width of bars as well as their heights
What should you keep in mind when analyzing data?
beware pictographs
watch the scales
When is it inappropriate to use a pie chart?
when data comes from different variables
What is a two-way table?
a table of counts that summarizes data on the relationship between 2 categorical variables for some group, organizing counts according to a row and a column
What does a marginal distribution do?
it gives the percent or proportion of individuals that have a specific value for one categorical variable
How do you examine a marginal distribution?
use the data in the table to calculate the marginal distribution (in percentages) of the row or column totals
make a graph to display the marginal distribution
What does a conditional distribution do?
it describes the values of that variable among individuals who have a specific value of another variable
How do you examine or compare conditional distributions?
select the row(s) or column(s) of interests
use the data in the table to calculate the conditional distribution (in percentages) of the row(s) or column(s)
make a graph to display the conditional distribution
use a side-by-side var graph or segmented bar graph to compare distributions
What is marginal relative frequency?
the percent or proportion of individuals that have a specific value for one categorical variable
What is joint relative frequency?
the percent or proportion of individuals that have a specific value for one categorical variable and a specific value for another one
What is conditional relative frequency?
the percent or proportion of individuals that have a specific value for one categorical variable among individuals who share the same value for another categorical variable
What is a side-by-side bar graph?
it displays the distribution of a categorical variable for each value of another categorical variable; bars are grouped together based on the values of one categorical variables and placed side by side
What is a segmented bar graph?
it displays the distribution of a categorical variable as segments of a rectangle, with the area of each segment proportional to the percent of individuals in the corresponding category
When does an association occur?
when knowing the value of one variable helps us predict the value of the other
What is a mosaic plot?
a modified segment bar graph in which the width of each rectangle is proportional to the number of individuals in the corresponding category
How does a dot plot display data?
it shows each value as a dot above its location on a number line
How do you make a dot plot?
Draw a horizontal axis and label it with the quantitative data
Scale the axis from the minimum to the maximum value
Mark a dot above the location on the horizontal axis corresponding to each data value
What should you always ask after making a graph?
“what do I see?”
When is a distribution roughly symmetric?
if the right and left sides of the graph are approximately mirror images of each other
When is a distribution skewed to the right?
if the right side of the graph is much longer than the left side
When is a distribution skewed to the left?
if the left side of the graph is much longer than the right side
What is the direction of a distribution’s skewedness toward?
the long tail
When is the distribution of a quantitative variable unimodal?
if it has a single peak
When is the distribution of a quantitative variable bimodal?
if it has two distinct clusters and peaks
When is the distribution of a quantitative variable approximately symmetric?
if the frequencies are about the same for all values
What do we look for in any graph?
the overall pattern and any clear departures from that pattern
How do we describe the overall pattern of a distribution?
by its:
shape
center
variability
What do we call an important kind of departure from the overall pattern of a distribution?
outlier
What is it important to remember when comparing distributions?
to give context and use comparative language
How do you make a stemplot?
Separate each observation into a stem (all but the final digit) and a leaf (the final digit)
Write the stems in a vertical column with the smallest at the top. Draw a vertical line to the right of the column
Write each leaf in the row to the right of the stem
Arrange the leaves in increasing order out of the stem
Provide a key that identifies the variable and explains what the stems and leaves represent
How can we get a better picture of a distribution with “bunched up” data values?
by splitting stems
How can we compare two distributions of the same quantitative variable?
by using a back-to-back stem plot
How does a histrogram display data?
it shows each interval of values as a bar, with the heights of the bars showing the frequencies or relative frequencies of values in each interval
How do you make a histogram?
Choose equal-width intervals that span the data
Make a table that shows the frequency or relative frequency of individuals in each interval
Draw horizontal and vertical axes. Label the axes
Scale the axes
Draw bars above the intervals. The bar heights correspond to the frequency or relative frequency of individuals in that interval
What is the most common measure of center?
mean
How do you find the mean?
by adding all values in a set of observations and then dividing that sum by the number of observations
What is the median of a distribution?
the center
What does the symbol x̄ represent?
the mean of a sample
What does the symbol μ represent?
the mean of a population
What is a statistic?
a number that describes some characteristic of a sample
What is a parameter?
a number that describes some characteristic of a population
When is a statistical measure resistant?
if it isn’t sensitive to extreme values
How do you find the median of a distribution?
Arrange all observations from smallest to largest
If the number of observations n is odd, the median is the middle obesrvation in the ordered list
If the number of observations n is even, the median is the average of the two center observations in the ordered list
When are the mean and median of a distribution similar?
if the distribution is roughly symmetric and has no outliers
How does the skewness of a distribution affect its mean and median?
if the distribution is strongly skewed, the mean will be pulled in the direction of skewedness but the median won’t
How do the mean and median react to outliers?
the median is resistant to outliers but the mean isn’t
What is the range of a distribution?
the distance between the minimum value and the maximum value
Is range a resistant measure of variability?
no
What does standard deviation measure?
the typical distance of the values in a distribution from the mean
How do you calculate standard deviation?
Find the mean of the distribution
Calculate the deviation of each value from the mean
Square each of the deviations
Add all the squared deviations, divide by n-1
This is the sample variance
Take the square root
What is the formula for standard deviation?
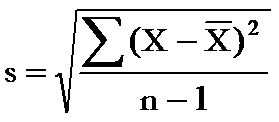
What is the standard variance?
standard deviation before you square root it
What is standard deviation always greater than or equal to?
0
What do larger values of standard deviation indicate?
greater variation
Is standard deviation a resistant measure of variability?
no
What do the quartiles of a distribution do?
divide the ordered data set into four groups having roughly the same number of values
How do you find the quartiles of a distribution?
arrange the data values from smallest to greatest and find the median, then find the middlemost value of both lists on either side of the median
What is the first quartile Q1 of a distribution?
the median of the data values that are to the left of the median in the ordered list
What is the third quartile Q3 of a distribution?
the median of the data values that are to the right of the median in the ordered list
What is the interquartile range (IQR)?
the distance between the first and third quartiles of a distribution
IQR = Q3 - Q1
What is the rule for outliers?
an observation is an outlier if it falls 1.5 x IQR above the third quartile or below the first quartile
low outliers < Q1 - 1.5 x IQR
high outliers < Q3 + 1.5 x IQR
Why do we look for outliers?
they might be inaccurate data values
they can indicate a remarkable occurrence
they can heavily influence the values of some summary statistics, like the mean, range, and standard deviation
What does the five-number summary of a distribution consist of?
the minimum, the first quartile Q1, the median, the third quartile Q3, and the maximum
What is a boxplot?
a visual representation of the five number summary
How do you make a boxplot?
Find the five-number summary
Identify the outliers using the 1.5 x IQR rule
Draw and label the horizontal axis
Scale the axis
Draw a box (from the first quartile to the third quartile)
Mark the median
Draw whiskers (to the minimum and the maximum)
Outliers are marked with a special symbol such as an asterisk
What is percentile used to do?
to describe the location of a value in a distribution
How do you find the percentile of a value?
count the number of values less than or equal to it, then divide by the total number of values
What is a cumulative relative frequency graph?
a graph that plots a point corresponding to the percentile of a given value in a distribution of quantitative data and connects consecutive points using line segments
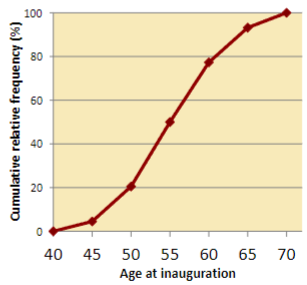
cumulative relative frequency graph
What does a z-score tell us?
how many standard deviations from the mean an observation falls and in what direction
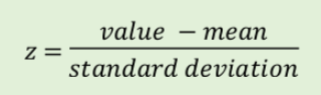
formula for z-score
What is a standardized score often called?
z-score
What does transforming data do?
converts the original observations from the original units of measurement to another standardized scale
can affect the shape, center, and variability of a distribution
What are the effects of adding/subtracting a constant to/from a distribution?
adding/subtracting the same positive number a to/from each observation:
adds/subtracts a to/from measures of center and location (mean, five-number summaries, percentile)
does not change measures of variability (range, IQR, standard deviation)
does not change the shape
What are the effects of multiplying/dividing a constant by the distribution?
multiplying/dividing each observation by the same positive number b:
multiplies/divides measures of center and location (mean, five number summaries, percentiles) by b
multiplies/divides measures of variability (range, IQR. standard deviation) by b
does not change the shape
What is a density curve?
a curve that
is always on or above the horizontal axis
has an area of exactly 1 underneath it
What does a density curve describe?
the overall pattern of a distribution
What does the area under the density curve and above any interval of values on the horizontal axis estimate?
the proportion of all observations that fall in that interval
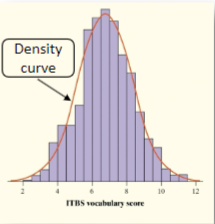
density curve
What is the mean of a density curve?
the point at which the curve would balance if made of solid material
What is the median of a density curve?
the equal-areas point, the point that divides the area under the curve in half
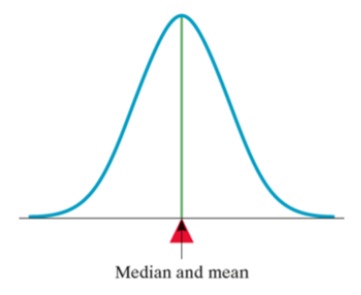
mean and median of a symmetric curve
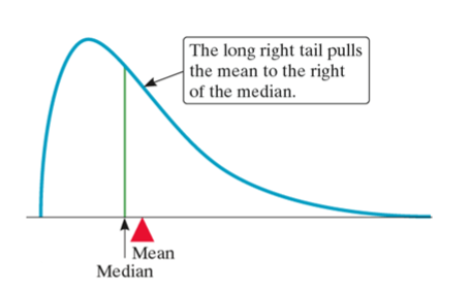
mean and median of a right skewed curve
What is a density curve an idealized description of?
a distribution of data