AP HuG - Unit 1 Flashcards
1/42
There's no tags or description
Looks like no tags are added yet.
Name | Mastery | Learn | Test | Matching | Spaced |
|---|
No study sessions yet.
43 Terms
Reference maps
general information/navigation/location
Thematic maps
communicate information about a place - spatial aspects - what is it like there?
Choropleth maps
use various colors, shades of one color, or patterns to show the location and distribution of spatial data
Dot Density
Each dot represents a specified quantity of a spatial characteristic.
Graduated/Proportional Symbol
Use symbols of different sizes to indicate different amounts of a variable.
Cartogram
The sizes of countries are shown according to a specific variable. Area is distorted to show a variable.
Isoline map
Use lines that connect points of equal value to depict variations in the data across space. Used for weather and elevation.
Topographic Map
Isoline maps that demonstrate elevation.
Absolute Location
Exact location, address, latitude & longitude
Absolute distance
EXACT, PRECISE Miles/Kilometers/Feet Oak Hills is 21.3 miles away from my house. Map Scale
Relative Location
Relationship to another place
Relative Distance
Spatial Interaction: Connections, contacts, movement, and flow of things between places.
Map Projection
The process of a cartographer (map maker) showing the curved surface of the earth on a flat surface (map).
S.A.D.D.
Map projections are SADD because they distort shape, area, distance, and direction
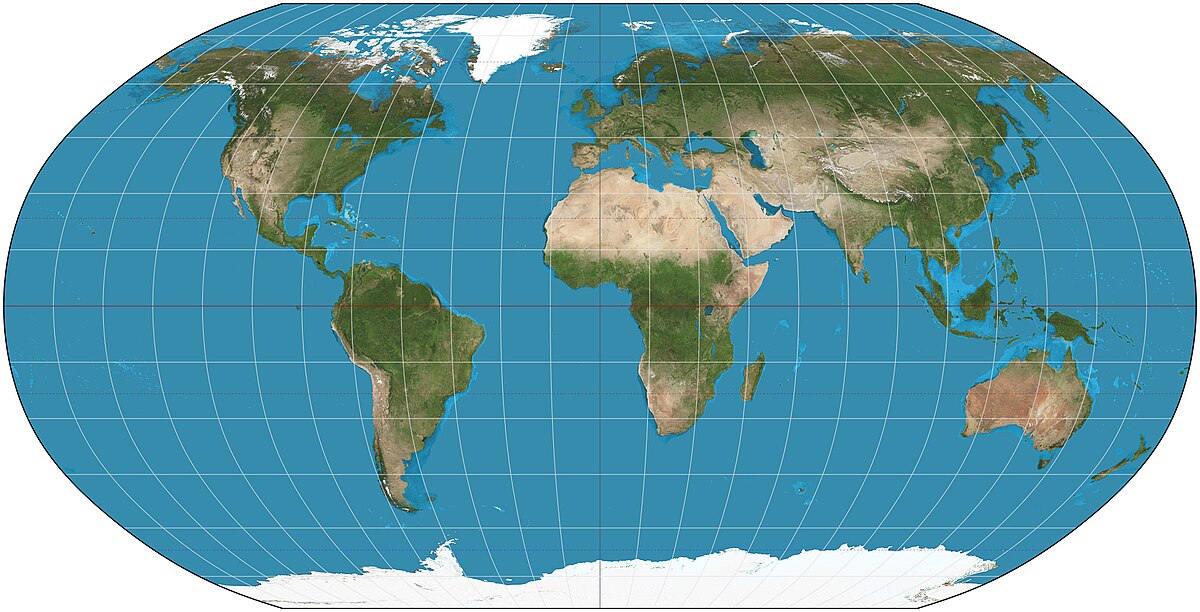
The Robinson Projection
Advantages: No major distortions
Purpose-compromise
Disadvantages: All aspects are slightly distorted
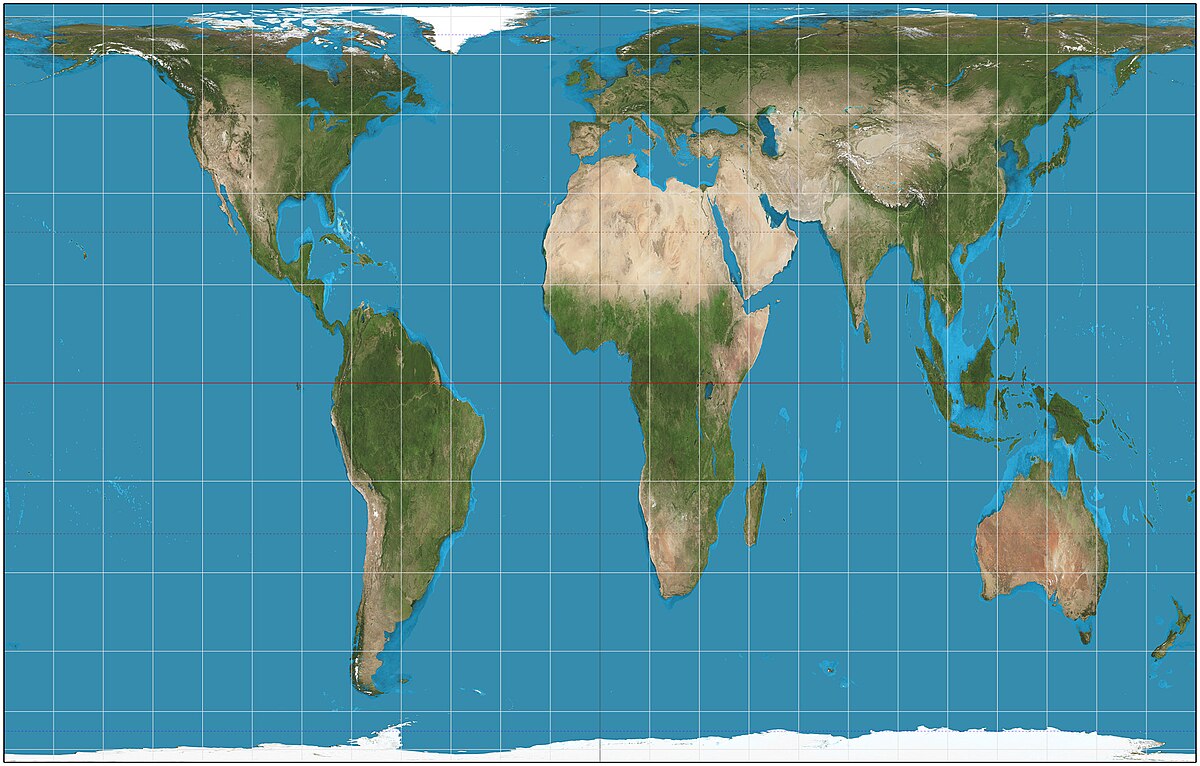
The Peters Equal Area
Advantages: Area of landmasses are accurate
Repositions many countries to their rightful size
Disadvantages: Shapes are inaccurate near the poles Vertically stretched near the equator
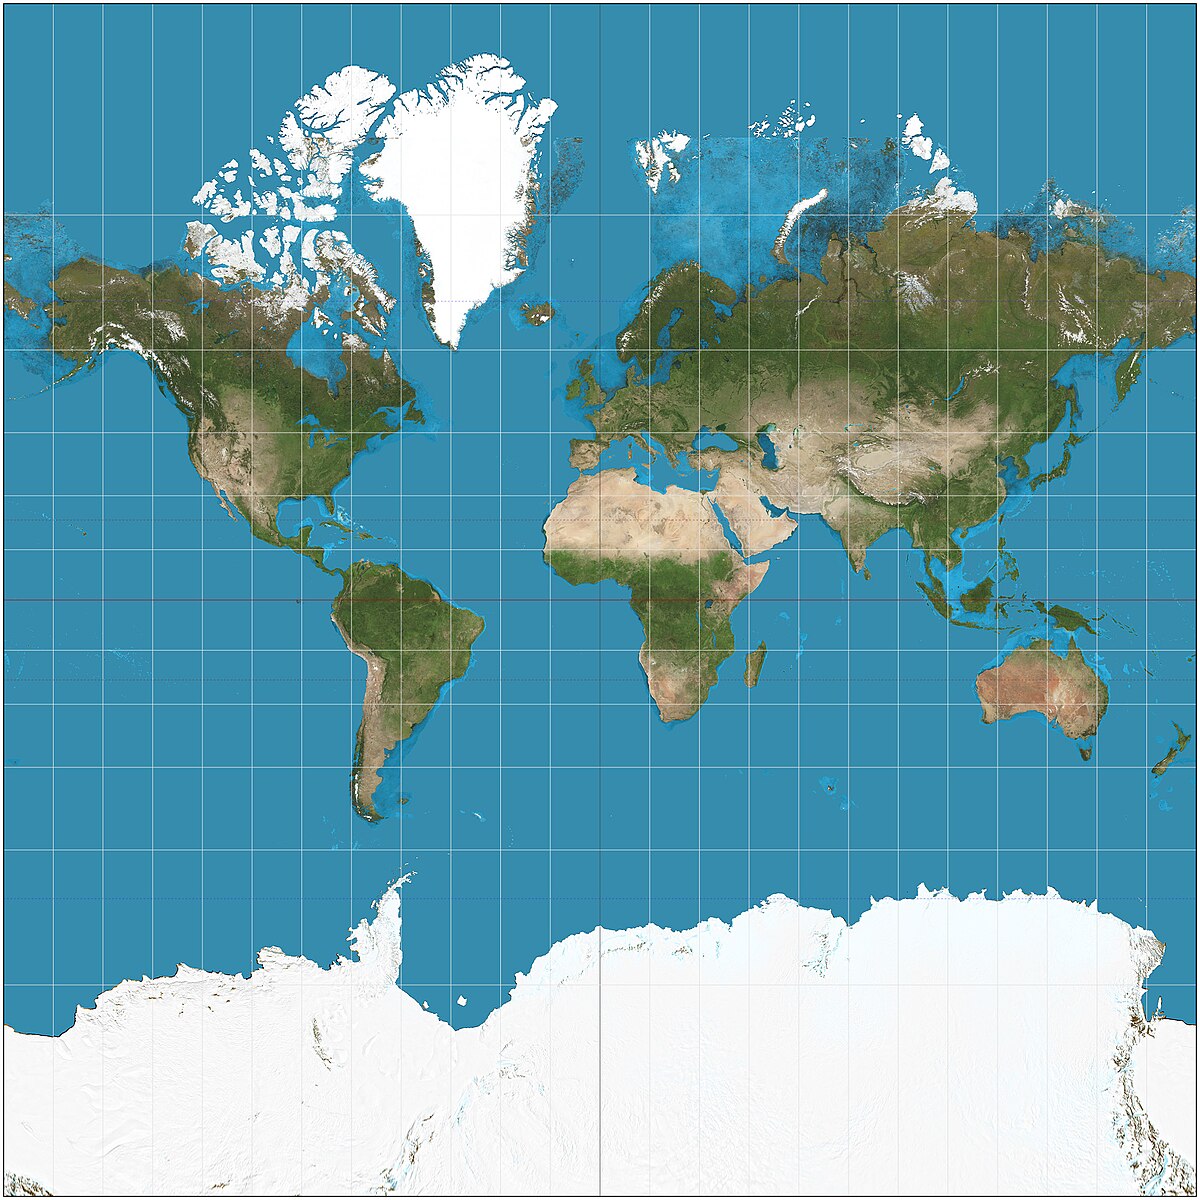
The Mercator Projection (1569)
Advantages: Direction Shape
Purpose: Navigation
Preserves right angles of latitude and longitude
Disadvantages: Area distorted near the poles Increases size of high latitude areas
Fieldwork/Field Observations
The act of an individual physically visiting a location or place and recording, firsthand, information there.
Satellite Navigation Systems/Global Positioning System (GPS)
•Satellites orbits the earth and communicate locational information to GPS receivers •Absolute location
•Navigation > ships, cars, aircraft
Geographic Information System (GIS)
A computer system that stores, organizes, analyzes, and displays geographic data.
Remote Sensing
The use of cameras or other sensors mounted on aircraft or satellites which orbit the earth above the atmosphere to collect digital images of the earth's surface
Toponym
Location's name - usually reflective of the culture & history of a place.
Ex.: Georgetown, Washington
Site/Physical Landscape
Environmental features of a location
Clustering
•Close together
•Density - the # of something in a defined area
Dispersal/Distribution
•Far apart
•Distribution - the way something is spread out over an area
Patterns & Spatial Associations
Indication that two (or more) phenomena may be related, associated, or correlated with one another.
Regionalization
the process geographers use to divide and categorize space into smaller areas of analysis
Expansion Diffusion
A trend is spread from its originating place, outward
Relocation Diffusion
The physical spread of a feature or trait by people migrating
Stimulus Diffusion
When a feature or idea spreads, but is changed by those adopting the idea
Contagious Diffusion
when a cultural trend is transmitted from person to person from an original source to numerous others, similar to a virus or viral video
Cultural Ecology
The study of how humans interact or adapt to the environment
Environmental Determinism
•18th century •The belief that climate and land forms are the most powerful sources shaping human behavior and socio-cultural development •Used to justify racism
Possibilism
•More modern interpretation
•Acknowledges the limitations imposed by the natural environment, but focuses on the role of human culture to modify and respond to the environment to better fit human needs
Scale of the map
Scale of the map is the extend of what is visible in the map. For example, if you are looking at the entire world, the scale map is global
Scale of analysis
Scale of analysis, or level of aggregation, is a reference to the unit of land that is being depicted or measured
Small scale maps
Show large area with small amount of data
Large scale maps
Show small area with large amounts of data
Global scale map
National level of comparing & contrasting countries of the world
National scale map
Substate level
Regions
one or more unifying characteristics (human or physical) or patterns of activity
Physiological Population Density
The number of people per unit area of available land •Also called real population density
Crude Population Density
Explains density in terms of people per total square unit