STATS test 1
1/29
There's no tags or description
Looks like no tags are added yet.
Name | Mastery | Learn | Test | Matching | Spaced | Call with Kai | Chat |
|---|
No analytics yet
Send a link to your students to track their progress
30 Terms
two branches of statistics
descriptive and inferential
define population
the set of all subjects/things/elements of interest to the study
define sample
a subset, or part, of a population which the data is actually obtained
used to make inferences
define statistic
a description about a sample
define parameter
a description about the population
usually unknown/estimated
four levels of measurement
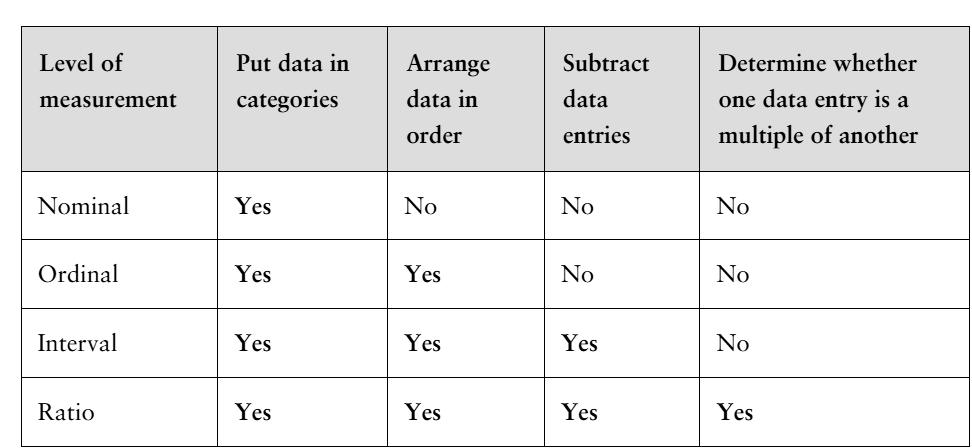
Nominal
yes/no
put data into categories without any order
Ordinal
low/middle/high
can be qualitative or quantitative
Interval
involves numerical data with equal intervals between values but no true zero point
subtract data entries
ex. temperature measurements
Ratio
a numerical value with equal intervals and no negativity
ex. $75,025 / $ 150,000 (exactly double)
Types of Data Collection
Observational Study
Experiment
Stimulation
Survey
Convenience Sampling
easy to obtain, not reliable though
Simple Random Sampling
every sample has an equal chance of selection
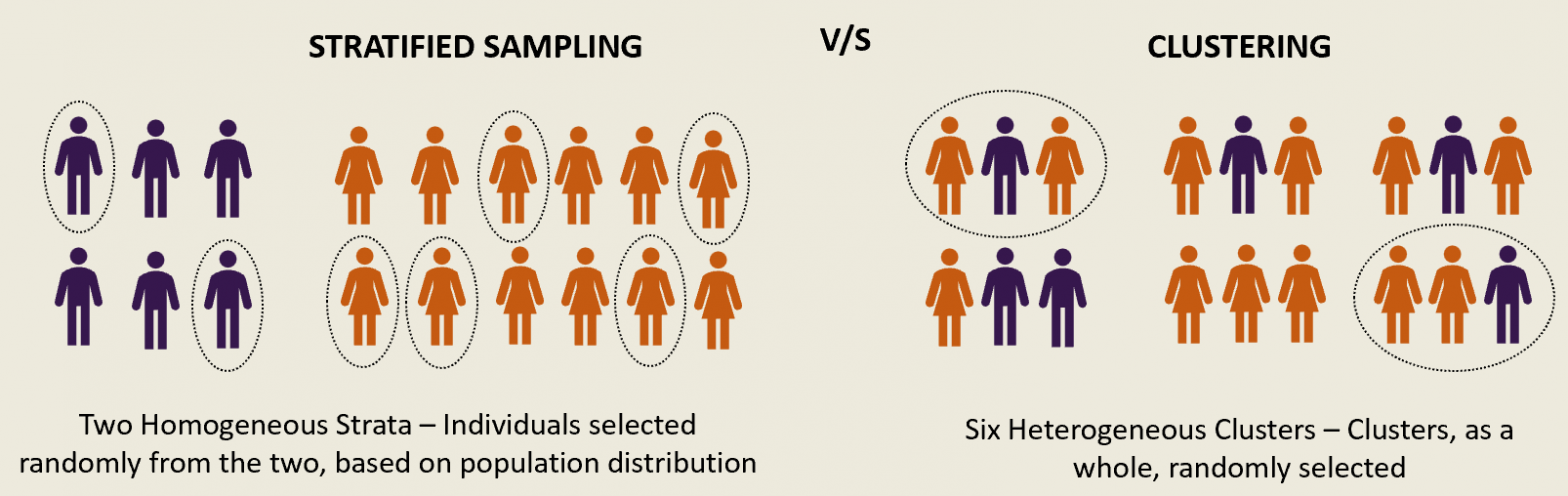
Stratified Random Sampling
the population id divided into subgroups and random samples are taken from those groups
Cluster Random Sampling
mini populations
Systematic Random Sampling
ex. selecting every 100th household and start randomly
The difference between Stratified and Cluster
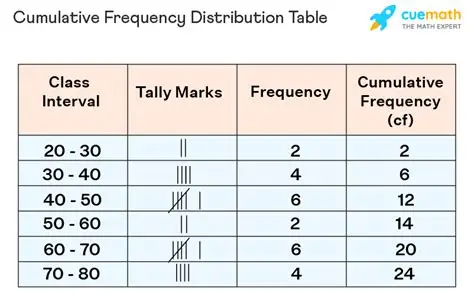
Frequency Distribution
a table that shows classes of data entries with a count of the number of entries in each class
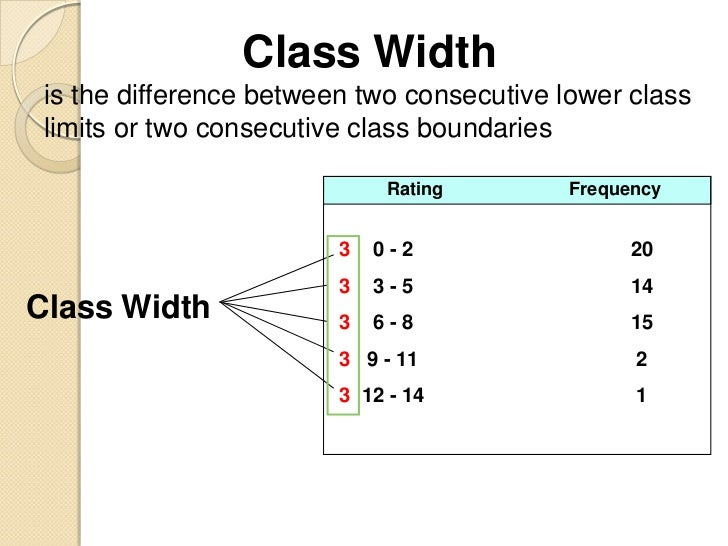
class width
the distance between lower or upper limits of consecutive classes
cumulative frequency
the sum of the frequencies of that class and all previous classes
is equal to the sample size (n)
relative frequency
the portion, or percentage, of the data that falls in that class
formula: class frequency/sample size OR f/n
class midpoint
the middle of each class
formula: (lwr class lim) - (uppr class lim) / 2
for every class set / can use it for any class
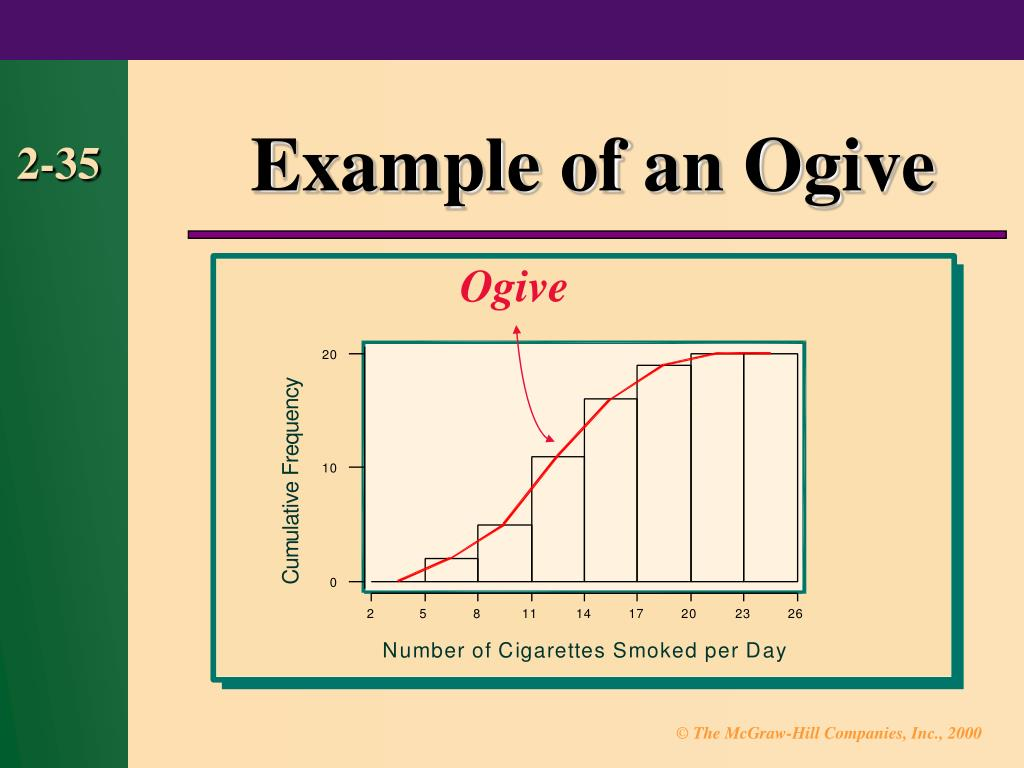
Ogive
a cumulative frequency graph / a line graph that displays the cumulative frequency of each class at its upper class boundary
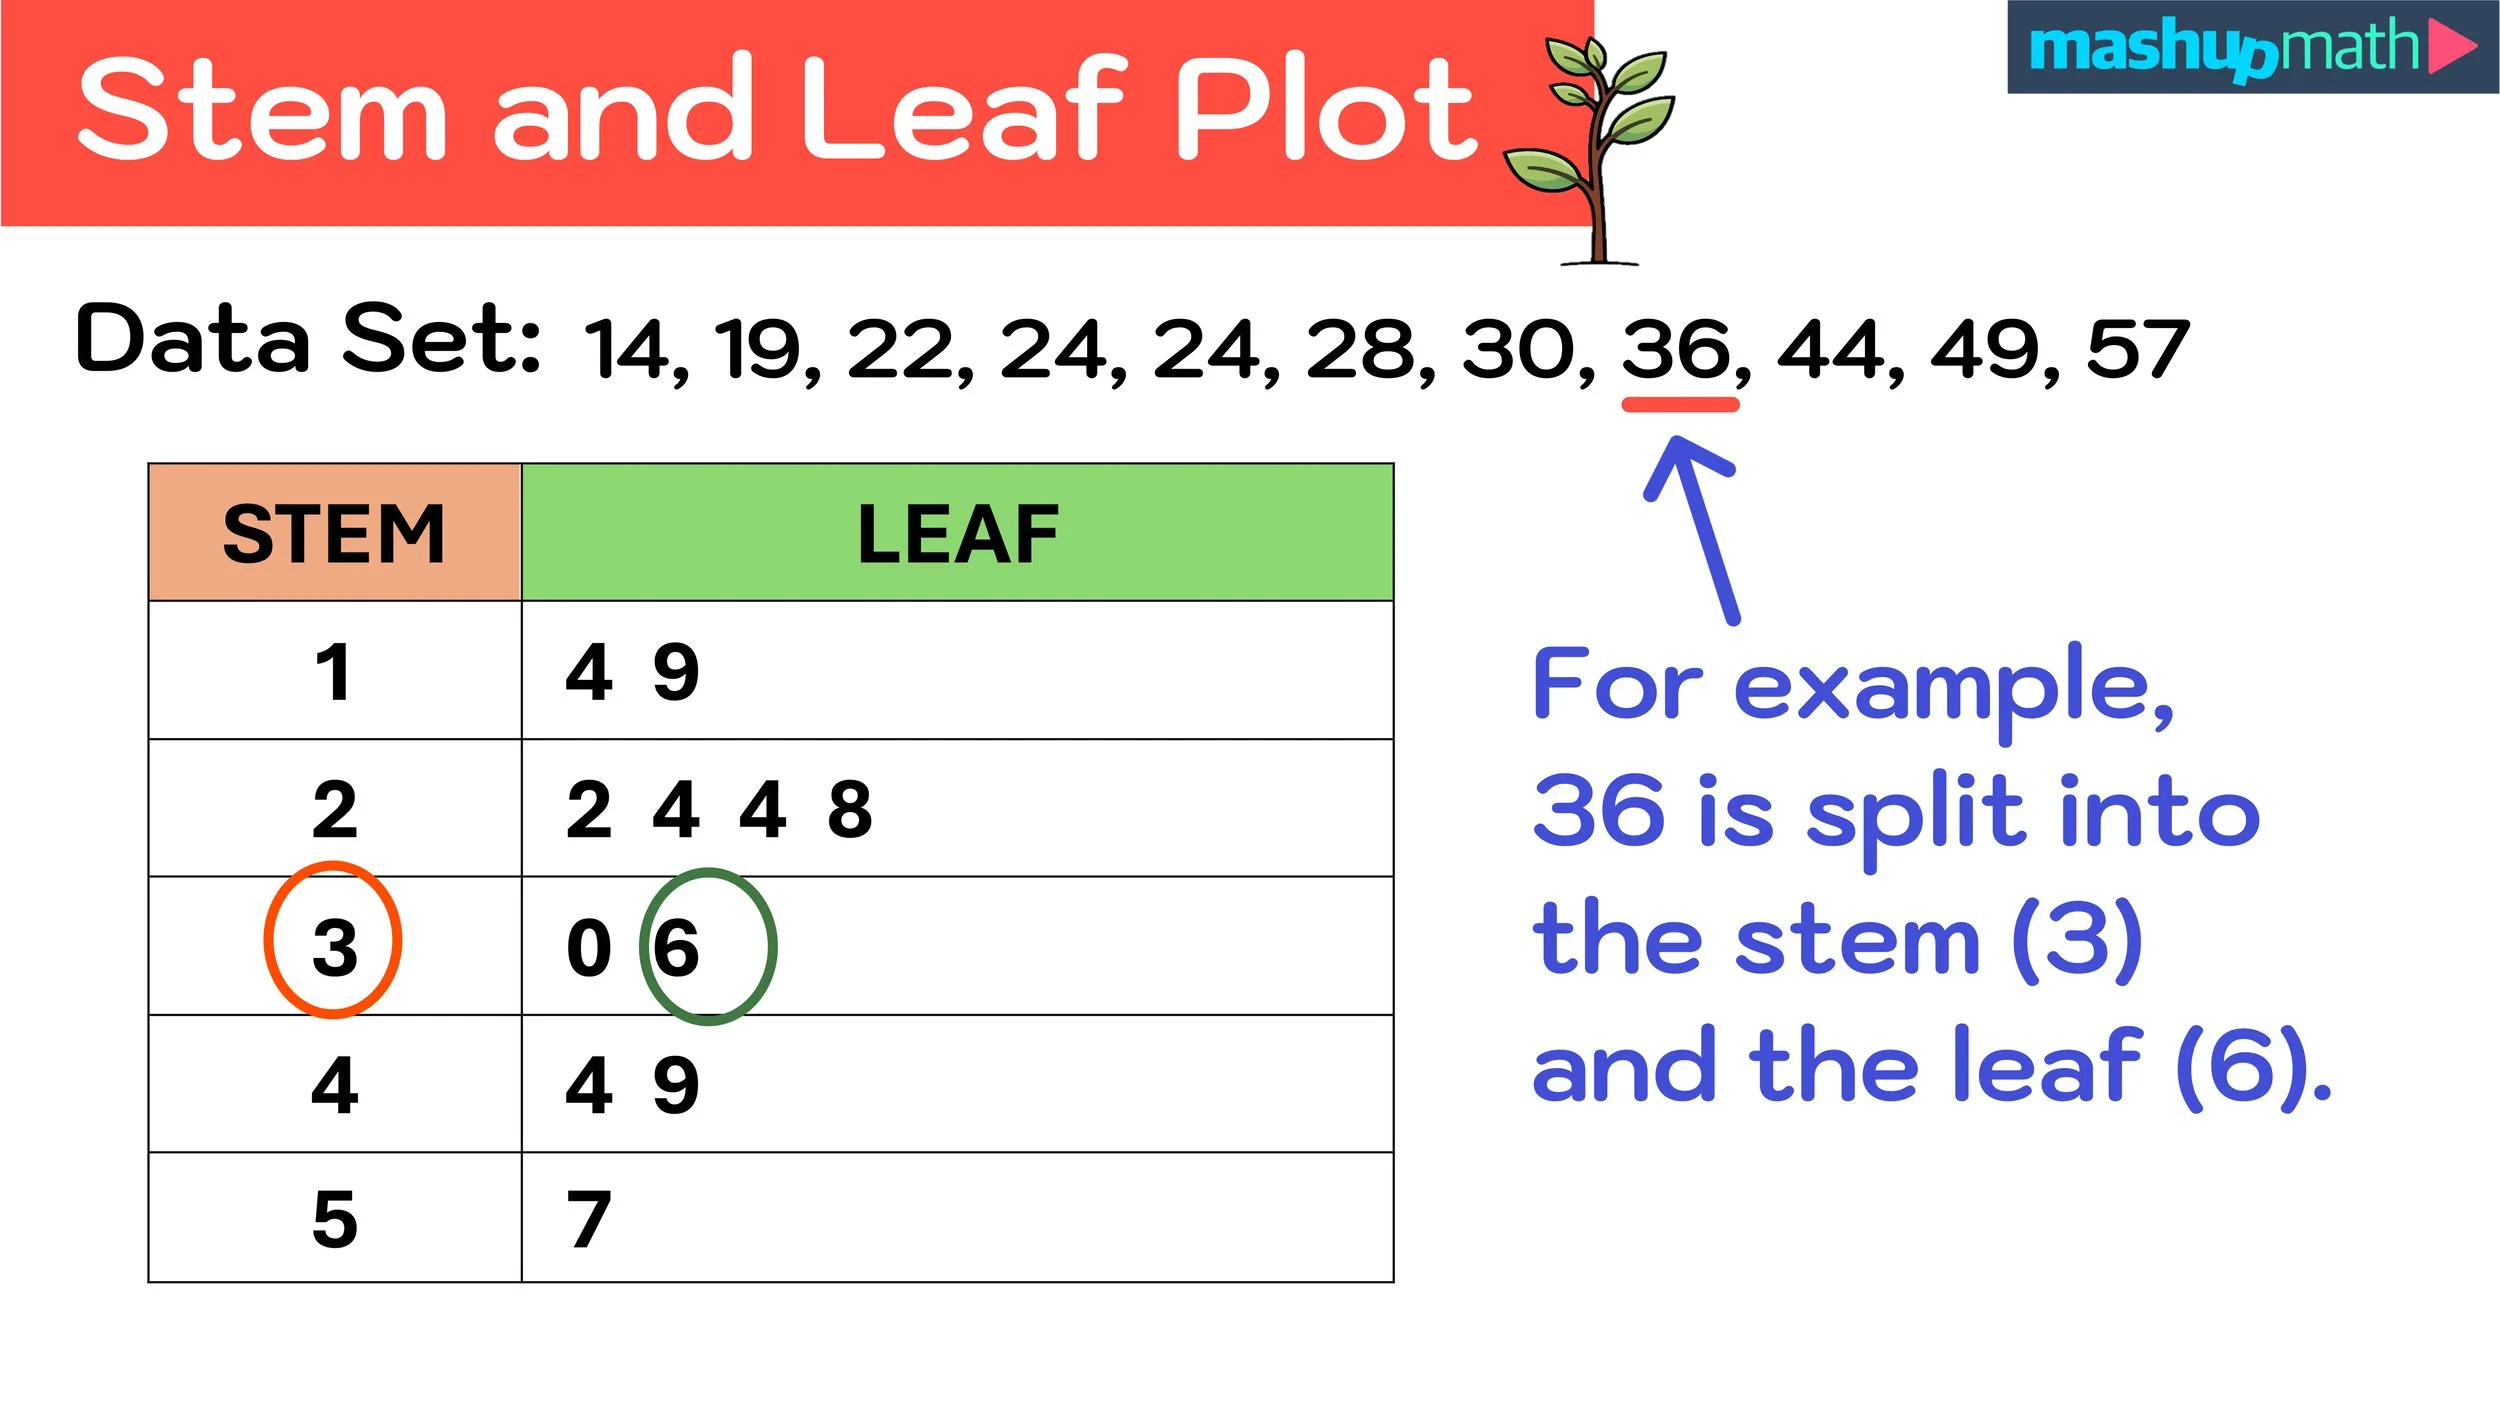
stem and leaf plot
finding the mean
x̄ = ∑x / n (finding the mean of the sample)
μ = ∑x / n (finding the mean of the population)
When do we use the mean?
taking every single data value into account
requires consistency, outliers have an affect
When do we use the median?
often preferred when the data contains outliers (data is skewed)
When do we use the mode?
nominal
not used much
categorical
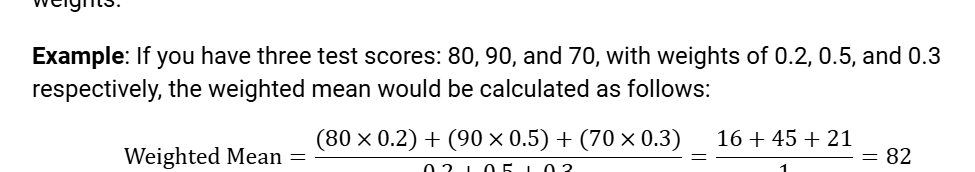
weighted mean
different data values that have varying weights
ex. syllabus hw/tests percentage weights
Data that has been “binned” into groups/classes/intervals
uses the midpoint to estimate
mean = ∑frequency x midpoint / ∑ frequency