Econ Data Analytics Midterm Spring 2025
1/80
Earn XP
Description and Tags
Name | Mastery | Learn | Test | Matching | Spaced | Call with Kai |
|---|
No analytics yet
Send a link to your students to track their progress
81 Terms
What does each row of a rectangular dataset represent?
An Observation
What does each column of a rectangular dataset represent?
A Variable (for observations)
What is Personally Identifying info? (PII)
Any information from a data set that could be used to individually identify a person
Give an example of PII:
address, first and last name, SSN, birthday etc
What is the difference between POPULATION and SAMPLE?
Population refers to the entire group of individuals or items being studied, while a sample is a subset of that population selected for analysis
Some studies collect and utilize qualitative data. Name one type of qualitative data.
An interview transcript
Name two steps you may need to take to prepare your data for Analysis?
Transpose Records – e.g. from horizontal to vertical or vice verse — to get the right units.
Collapse Records so that smaller, more specific information is combined or summed together and the data is easier to make observations from.
What are imputations? Give methods of imputation.
methods of filling in the gaps in data
Methods:
use a value of related information —> someone in the same household
to the mean —> overall or subgroup
Regressions, multiple regressions
Name the three measures of central tendency
mean
median
mode
Name the three measures of variability (spread)
range
standard deviation
variance
Which measure(s) of variability is expressed in the same unit as
the variable? Why is that important?
range because it is just the difference
standard deviation —> makes it easier to interpret and use
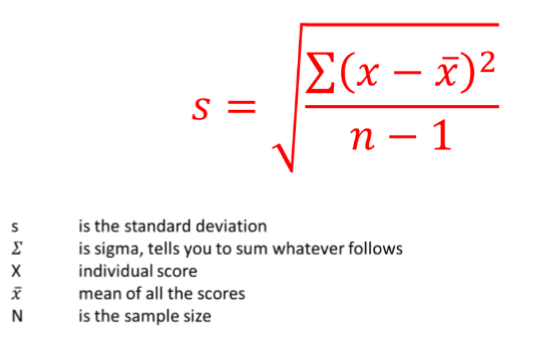
Formula for Standard Deviation: (STDEV.S or STDEV.P)
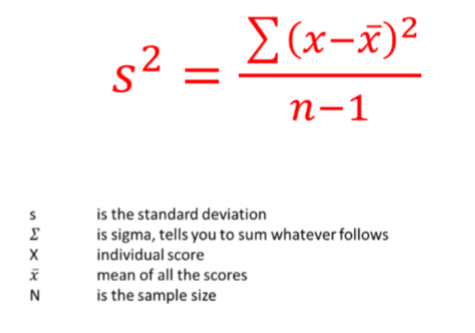
Formula for Variance: (VAR.S or VAR.P)
equal to std Dev squared
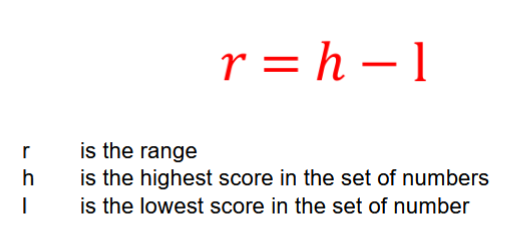
Formula for Range: (=max-min)
can also use “h-L+1” to make it inclusive
What does the correlation coefficient measure? What can’t you
say based on correlation coefficient?
how related two variables are from -1 (strongly unrelated) to +1 (strongly related)
no relation is 0
canNOT say that one causes the other
Is 0.5 or -0.9 a stronger correlation coefficient?
-0.9 is a stronger correlation. Although it is negative, implying that the variables are strongly UNrelated, that is still more correlation that a 0.5 which is only half related.
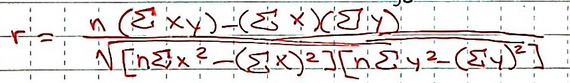
Formula for Correlation Coefficient:
What is the difference between validity and reliability?
Validity: does it measure what it’s supposed to? measure of accuracy
Reliabiltiy: does it work every time? measure of consistency
What are the types of numeric variables?
categorical
ordinal
continuous
discrete
binary
What is a categorical (nominal) variable?
two or more categories, but the numbers themselves have no value.
example: hair color: 1 = brunette, 2 = blonde, 3 = red, 4 = grey
What is an ordinal variable?
two or more categories but with levels.
example: level of edu: 1 = elementary, 2 = 2ndary
What is a continuous variable?
any number between two points (line of a graph)
what is a discrete variable?
number of children in household, cars in garage, trees in yard etc
What is a binary variable?
value of 1 or 0
example: female (0=no, 1= yes)
example: did you attend? (0=no, 1=yes)
What is time series data?
collected over time —> think Dad’s time-lapse of pond puddle
regular equal intervals
usually collected for same interval
example: ocean tides, quarterly revenue
What is cross-sectional data?
collected on different individuals
collected at one time or same period of time
Example: opinion polls, census
What is pooled data?
mixture of time series and cross-sectional
same piece of info for multiple people
example: annual GDP for multiple countries
What is panel data/logitudinal data?
info for same cross-sectional same is repeated
some variables collected @ once are constant
Gender
DOB
Race
others over time
Edu level
Earnings
Marital Status
What is extant data?
already available from organizations
was not collected FOR analysis but could be useful
HW and projects and art from schools
What is client data?
data that firms collect about themselves
sales, revenue, etc
usually proprietary so only in-house
What are Public Use Data Files (PUF)
end of some studies —> data made public
stripped of all Personally Identifying Info (PII)
other data-masking techniques
What is Personally Identifying Data (PII)?
anything that could attach data to a person
DOB
Social Security Number
First and Last Names
Address
What are data-masking techniques?
dropping sensitive variables entirely
collapsing categorical variables with small cell sizes
What is a Restricted-Use Data File? (RUF)
most PII is stripped but other data not masked
higher risk, may need
Data Use Agreement (DUA)
Memorandum of Understanding (MOU)
may need to work on computer in locked room etc
What may you find in Data Codebooks and Documentation?
list of variables
lots of time-saving info
sample definiitions
description of data collection —> annotated survey
What are four methods are analysis?
Experimental
Quasi-experimental
Correlational
Descriptive
What are examples of quantitative data?
mean, median, mode
distributions, frequencies
Ways to collect qualitative Data?
interviews
observations
focus groups
survey write-in responses
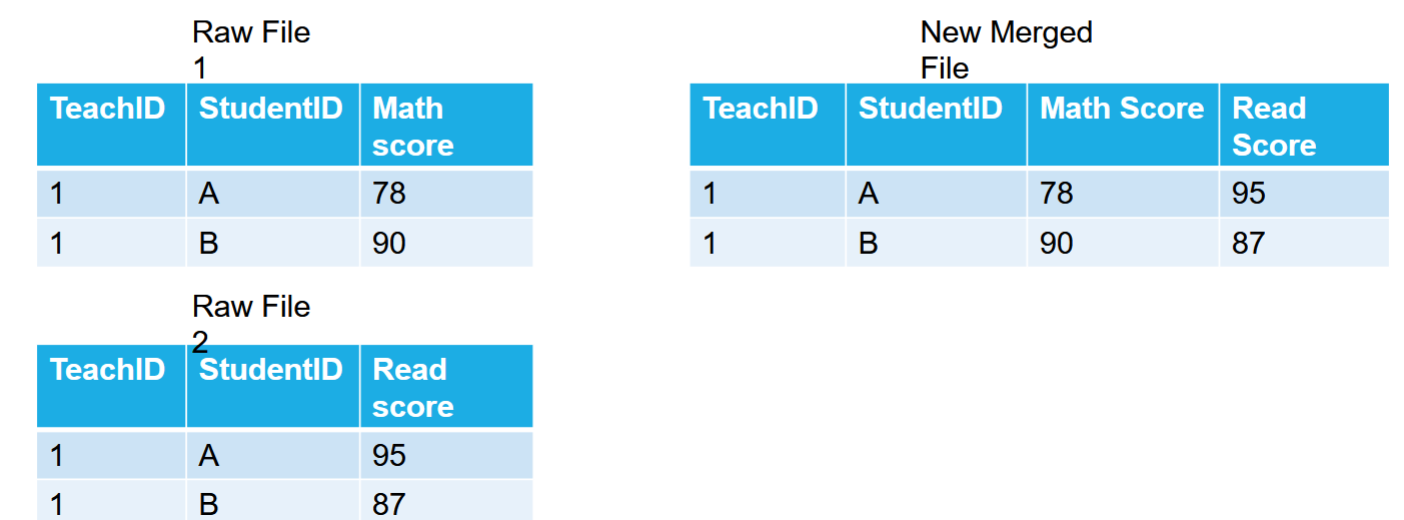
How can you combine data from multiple files if they have observations under the same variables?
append/stack together the files one after the other
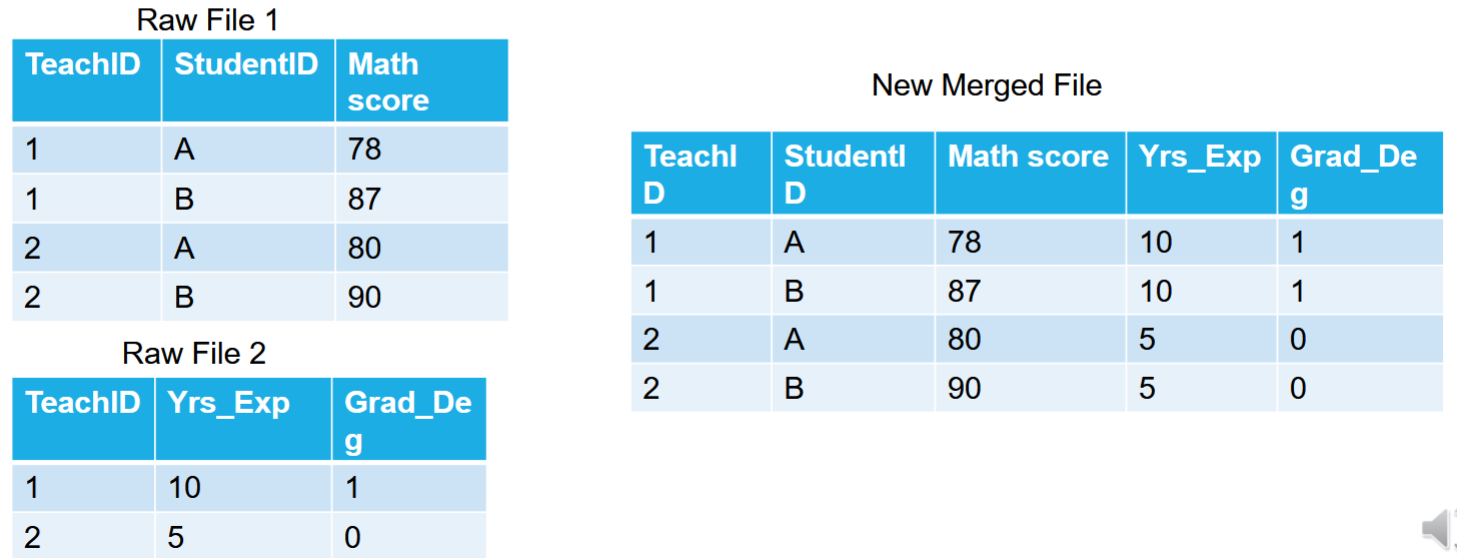
What are the three ways to merge files when the variables are split up between them?
one-to-one
one-to-many
many-to-many
What is a one-to-one file merger?
Take two files each with half the needed variables
combine them into one new file with all variables
What is a one-to-many file merger?
not sure?
What is a many-to-many file merger?
very tricky!
to be avoided
What to do with extra data?
Leave extra variables/observations and filter with “if/when” statements
Create a new file and delete extras — keep raw file just in case
How to spot poor data quality?
will need a Data Dictionary
does variable take on expected values?
look for outliers
How much data is missing?
could use different notations: “missing” “.” “9999”
How to fix poor data?
Conditional formatting on Excel
create a rule to find out of range
“top” and “bottom” rules to see outliers
filters —> view only certain values
visualization methods
histograms and box plots
What is a business rules document and what would be found on it?
a file that lists all the analytical decisions you made
explain to other what you did
show WHY you did it
lets someone else replicate your process
any dropped or constructed variables
any other imputations
What are the three quartiles based on the median?
Lower (QL) or First (Q1) —> 25% of data below
Median or Second (Q2) —> 50% of data below
Upper (QU) or Third (Q3) —> 75% of data below
Why would you use median instead of mean?
insensitive to extreme values
if data has outliers, median better reflects central tendency
depends on distribution
normal distribution - mean
skewed data - median
Where is the “mode” a useful measure of central tendency?
measure of non-numeric variables
most common hair color
party affiliation
college majors
Why use “N-1” for variation measures?
observation values typically closer to sample than population mean
N-1 does more when N is small —> less correction needed for large sample
variance and std dev are calculated from sample mean
N would underestimate, N-1 doesn’t
How to deal with outliers in data?
adjust up TOP CODE or down BOTTOM CODE
set outliers to missing
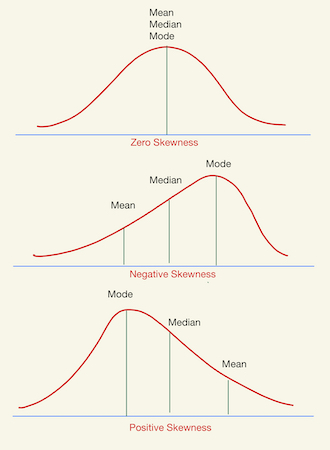
What are the four ways a distribution can vary?
average value (shift left or right)
variability (change shape of curve)
skewness
kurtosis
What is skewness? What are the two directions?
measure of lack of symmetry
positive skewness —> mean is greater than median
negative skewness —> median is greater than mean
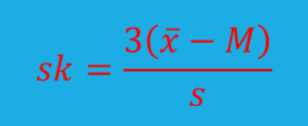
What is formula for skewness?
xbar is mean
s is std dev
M is median
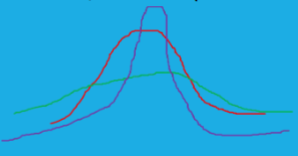
What is Kurtosis?
a measure of how flat or peaked the distribution is
What are the three forms of Kurtosis?
Mesokurtosis - bellshaped (red)
Platykurtic - flatish with thin tails (green)
Leptokurtic - peaked with fat tails (purple)
What are two visual ways to represent interval grouping of data?
histograms —> each bar is one interval
covers the whole set of data
Cumulative Frequency Distribution
shows intervals and their frequency + total frequency
What are dashboards and what are they used for?
visual presentations
used to track
historic and real-time data
Key Performance Indicators (KPI)
What is the correlation coefficient (r value) and how does it work?
measure of how two variables relate to each other
ranges from -1 to 1, with the magnitude being the strength
0 means no correlation
Rate the strength of several intervals of correlation coefficient
0.8 to 1.0 —> very strong
0.6 to 0.8 —> strong
0.4 to 0.6 —> moderate
0.2 to 0.4 —> weakish
0.0 to 0.2 —> weak
What is the formula for correlation coefficient?
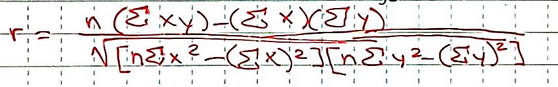
What is a correlation matrix used for?
Comparing several variables all to each other
What is measurement?
assignment of values to outcomes following a set of rules
What are the four scales of measurement?
Nominal —> least precise
Ordinal
Interval
Ratio → includes absolute zero
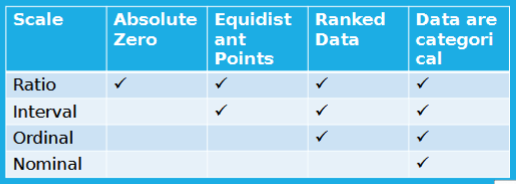
What is the nominal level of measurement?
named categories - least precise
outcome only fits in one category
we know categories are different
DONT know how they relate
blonde/brunette/red/grey
What is the Ordinal level of measurement?
“ord” means order
categories are ordered
we know theyre different
we know how they rank
we DONT know how different the rankings are
job applications
What is the interval level of measurement?
intervals are ordered along a scale of equal positions
we know theyre different, how they rank, difference between categories
tests - 10 questions right is twice 5 right
What is the ratio level of measurement?
most precise, includes absolute zero
only works in some disciplines:
physics —>no light, no molecular movement
BAD for knowledge tests —> zero on spelling test does NOT mean no spelling ability
What is the difference between observed and true score?
observed —> score they were given “i got 55!”
true —> what they actually know
can never really be tested perfectly
What is the error score and where can error come from?
difference between observed and true score
True = Observed + Error
goal is to minimize error score
outside factors that cause error
room too hot, too loud, i was sick, etc
measurement problems
What are the four forms of reliabiliy?
test-retest
Parallel forms
Internal consistency —> within one test
Interrater
What is test retest reliability?
is it good over time?
same test, same ppl, two diff times
good test gives similar/same answer
calculate correlation between two sets of scores
What is parallel forms Reliability?
make sure two diff forms of a test are the same
“version A” (Blu) and “Version B” (Gre)
ensure that same ideas are tested
calculate correlation between two sets
What is internal consistency Reliability?
used to check consistency within a test
how well do diff measures for same concept yield the same result?
would a certain concept do better with multiple-choice or true-false?
Calculate Cronbach’s Alpha
What is Interrater Reliability?
see if diff judges scores same way
judges at Olympics expected to give same score
whenever humans are used there is error
#of agree/ #of possible agreements
What are the main goals for reliability coefficients?
need to be positive/direct
should be as large as possible
-0.7 is really bad, 0.3 still isn’t great
What are the three types of validity?
content
criterion
construct
What is content validity?
does the sampled content really represent the population
use on achievement tests
ask experts to make judgement that the items represent the universe of possible items on the same topic
What is criterion validity?
are scores systematically linked to other variiables to show that the testee understands material
Concurrent validity —> is the new measure simular to tried-and-true ones?
correlate new scores with proven ones
Predictive validitiy —> ability of test to predict future outcomes
What is Construct validity?
the test measures a psychological construct
correlate test scores with theorized outcome that reflect the construct you’re testing
example of measuring aggression from correlation with fights and suspensions