Unit 1: Exploring Data
1/30
There's no tags or description
Looks like no tags are added yet.
Name | Mastery | Learn | Test | Matching | Spaced | Call with Kai |
|---|
No analytics yet
Send a link to your students to track their progress
31 Terms
data
recorded information, with context
categorical variable
a variable with named categories (usually named with words)
quantitative variable
a variable that uses numerical values (with units)
contingency table or 2-way table
a table that displays counts (or percents) for individuals organized by two categorical variables
marginal distribution
in a contingency table, the distribution of just one of variables, which can be seen in the margins of the table
conditional distribution
the distribution of a variable when adding a restriction to only a portion of the variable
independence
two variables are independent when knowing something about one variable does not add any new information to what you know about another variable
association
two variables have an association when knowing something about one of the variables increases what you know about the second variable
graphs for categorical variables
bar graphs and pie charts
area principle
the area of a graph should equal the magnitude of the data it is representing
graphs for quantitative variables
dotplot, stem & leaf, boxplot, histogram
shape descriptors (draw with your finger in the air as you say them)
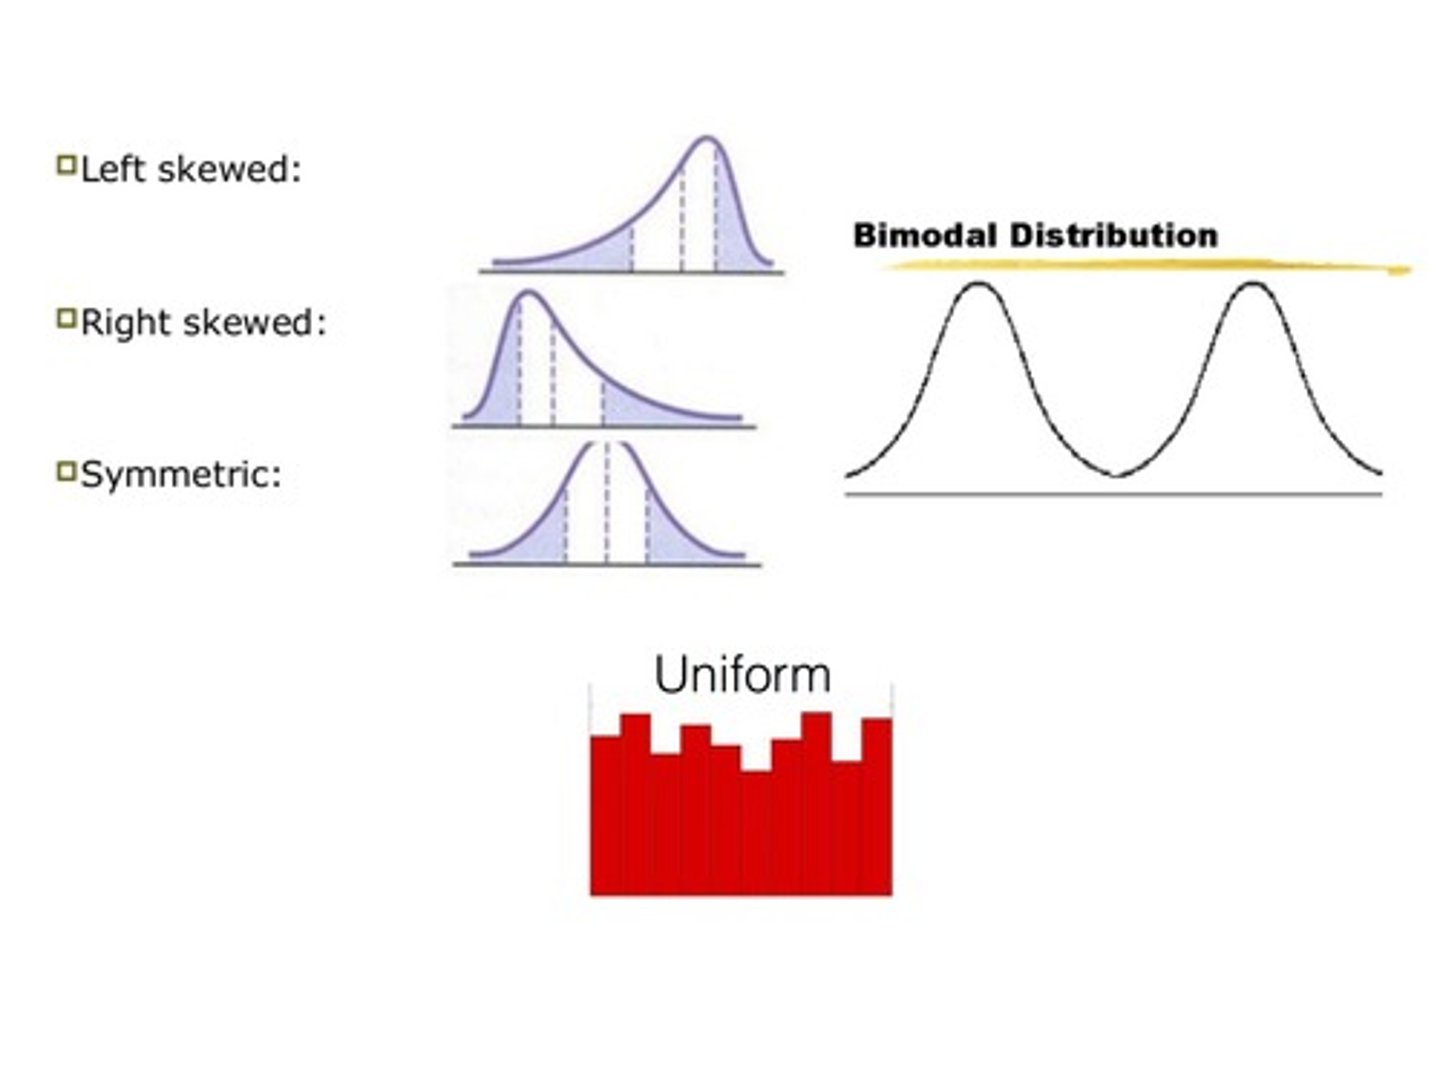
Four things to describe about a quantitative distribution
center, shape, spread, unusual features (outliers)
2 measures of center
mean and median
3 measures of spread
range, IQR, and standard deviation
how to describe symmetrical data
mean and standard deviation
how to describe skewed data
median and IQR
upper fence formula
Q3 + 1.5*IQR
lower fence formula
Q1 - 1.5*IQR
In a skewed right distribution, the mean is ______ than the median.
greater than
standard deviation is ....
the typical distance from the data to the mean
IQR
Interquartile Range = Q3 - Q1
percentile
The nth percentile means that n% is BELOW that value.
variance
standard deviation squared
z-score
standardized score
Standard normal distribution
The mean is 0 and the SD is 1.
Empirical rule
68-95-99.7
continuous variable
A variable (such as age, test score, or height) that can take on a wide or infinite number of values.
discrete variable
variable that has specific values and that cannot have values between these specific values (usually whole numbers only, for example)
The greek letter we use for the mean of the entire population.
mu
The greek letter we use for the standard deviation of the entire population.
sigma