biology-unit 0
 Call Kai
 Learn
Learn Practice Test
 Spaced Repetition
 Match
Match Flashcards
 Knowt Play
1/36

There's no tags or description
Looks like no tags are added yet.
Name | Mastery | Learn | Test | Matching | Spaced | Call with Kai | Chat |
|---|
No analytics yet
Send a link to your students to track their progress
37 Terms
alternative hypothesis
states that there is a relationship between the two variables, and any differences in findings did not occur by chance
null hypothesis
the IV has no effect on the DV.
states a hypothesis to be proven wrong
good hypothesis
if independent variable, then dependent variable
confounding variable
an unintended factor that could skew results
bias
a systematic influence that could skew results
replication
repeating trials/increasing sample size
positive control
receives the normal or KNOWN EFFECTIVE condition
negative control
does not receive the experimental treatment (known variable which does nothing, often H2O)
experimental control
receives the treatment/condition being tested
control group
the control group shows how the IV effects the DV (comparison)
sample size
all the data points together
relationship between sample size and statistical analysis
more data=better
a bigger sample size allows for better stat. analysis = better support of the conclusion drawn from the data
want consistent data
normalcy
the researcher must first establish what is normal for their data sample as well as the population as a whole
calculated with mean, median, mode, and SD of the sample
its important for the COMPARISON of data points, confirmation of trends/patterns and statistical analysis (can only be done after establishing normalcy)
LUTES
label axes
use the right kind of graph
title the graph*
error bars (if needed)
scale axes properly
y-axis variable
dependent variable (DV)
x-axis variable
independent variable (IV)
when to use bar graph
experimental categories
mean values for each category
when to use line graph
continuous IV
numerical IV
can be used to calculate rate
when to use line of best fit
if you’re trying to find the rate of the overall trend
what needs to be included when labeling axes
the description from the question (is applicable)
graph title formulas
IV v. DV
effect of IV on DV
scaling formula (graphing)
(highest #)/(# of squares on the axis)
CER
Claim, evidence, reasoning
use to analyze a graph
1) identify the scientific question that’s being answered by the graph
2) make a claim based on what you see in the graph
3) look at the graph for trends + comparisons (evidence) that supports your claim
provide reasoning that explains how the claim and evidence are related
mean
tells you what is”normal” for the collected data
true mean
the average value for data taken from every member of a population
can true mean be calculated
no, but conceptually important when doing stat. analysis
CAN BE GRAPHED w error bars to determine if differences w/in groups are statistically significant
sample mean
the average of data points within. individual experimental groups
used to compare averages between treatment types
standard deviation (SD)
a statistical test that quantifies the amount of variation WITHIN a data set
allows for comparison of data within a sample
WITHIN ONLY, not other sets of data
± 1 SD
NOT statistically significant than the mean
± 2 SD
significantly different than the mean
0 on SD graph
the mean
SD graph
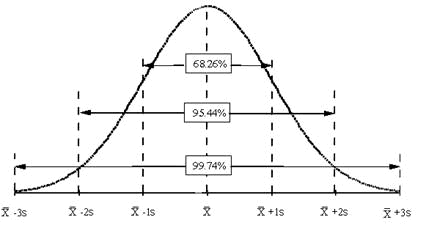
standard error of the mean (SEM)
measures the probability that you have captured the true mean of the entire population
“is the mean representative of the entire population and not just the sample?”
why a small SEM is better
the smaller the SEM value, the more likely it is that your sample mean matches the true mean and represents the population as a whole
95% confidence interval/±2SEM
error bars represent range of values between which the true mean could fall
“we can say with 95% confidence that the true mean falls within this range”
error bars overlapping
the differences in the sample means are NOT statistically significant (possible same true mean)
error bars don’t overlap
there ARE statistically significant differences
no overlap means you can say with 95% confidence that the true means are not the same for the groups