Statistical Tests: Correlation and Regression
1/40
There's no tags or description
Looks like no tags are added yet.
Name | Mastery | Learn | Test | Matching | Spaced |
|---|
No study sessions yet.
41 Terms
-Student's T test
-Mann-Whitney U (non-parametric if data is not normally distributed)
What test do you use for continuous data with 2 independent samples?
Paired T-test
What test do you use for continuous data with related or paired samples?
One-way ANOVA
What test do you use for continuous data with 3 or more independent samples?
-2 way ANOVA
-repeated measures ANOVA
What test do you use for continuous data with 3 or more related samples?
-Chi-square
-Fisher's Exact (smll sample size)
What test do you use for categorical data with 2 independent samples?
McNemar's test
What test do you use for categorical data with related or paired samples?
Chi-Sqaure for k independent samples
What test do you use for categorical data with 3 or more independent samples?
Cochran Q
What test do you use for categorical data with 3 or more related samples/
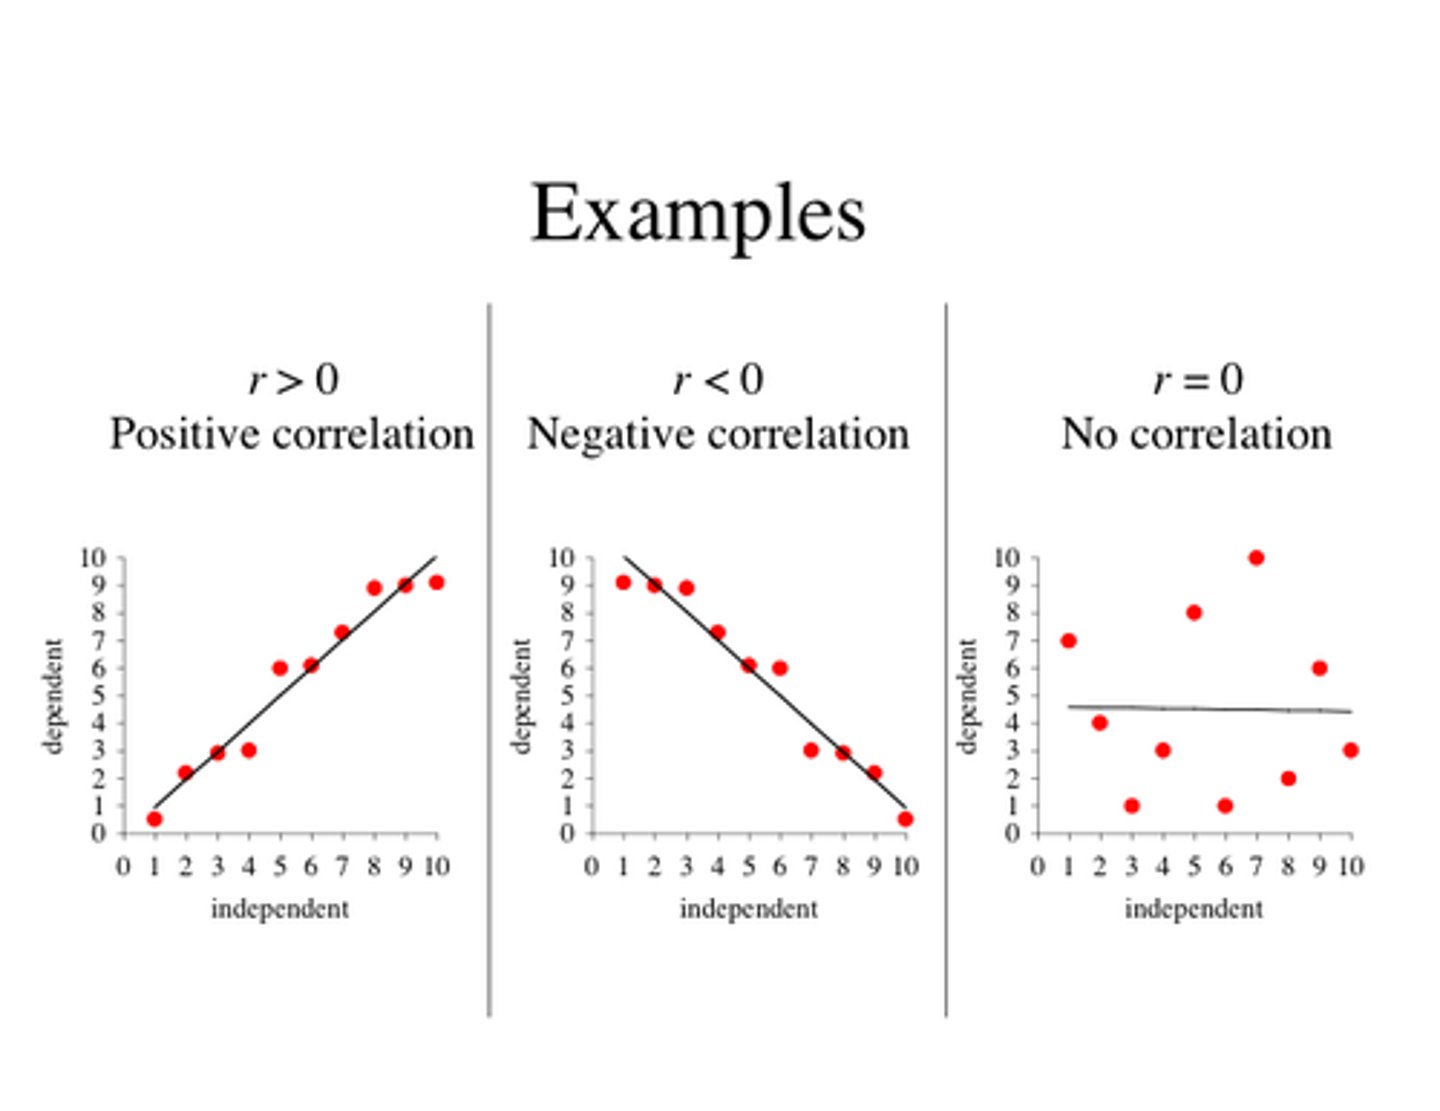
correlation coefficient (r)
•Provides a measure of how two variables are linearly associated in a sample
•Provides strength and direction of the relationships between two numerical variables
•Pearson product moment correlation coefficient
sample
r is a ____________ statistic and an estimate of an unknown population parameter
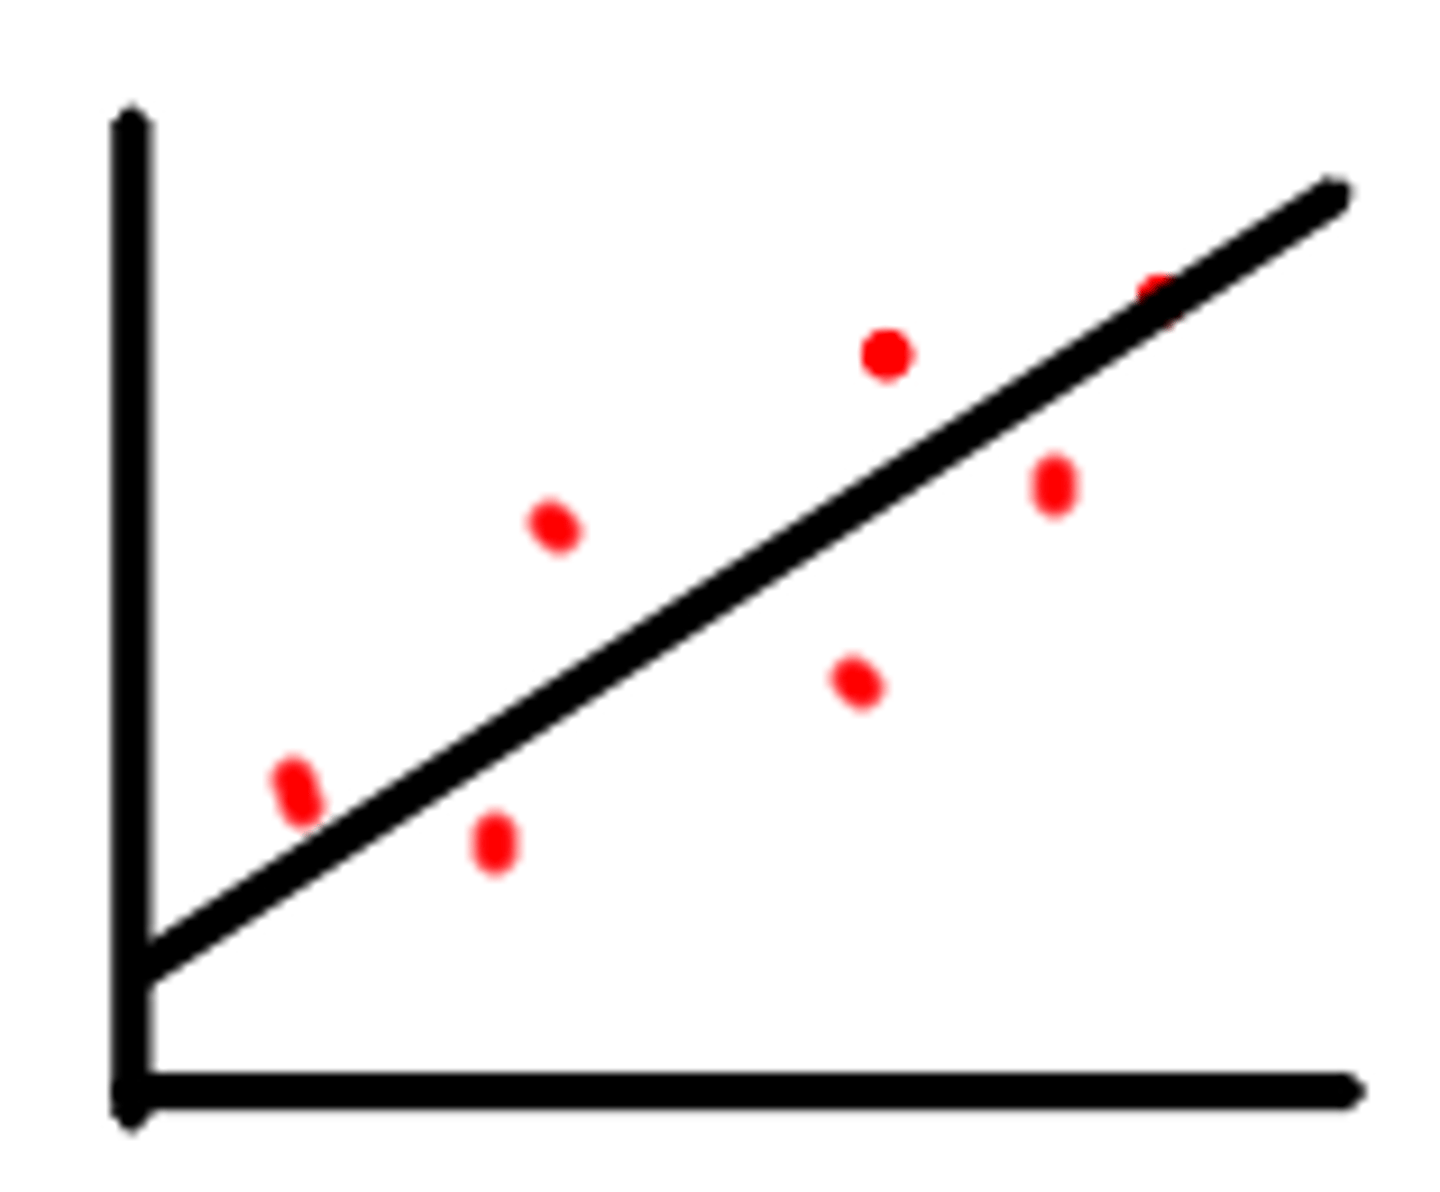
positive correlation
r is positive
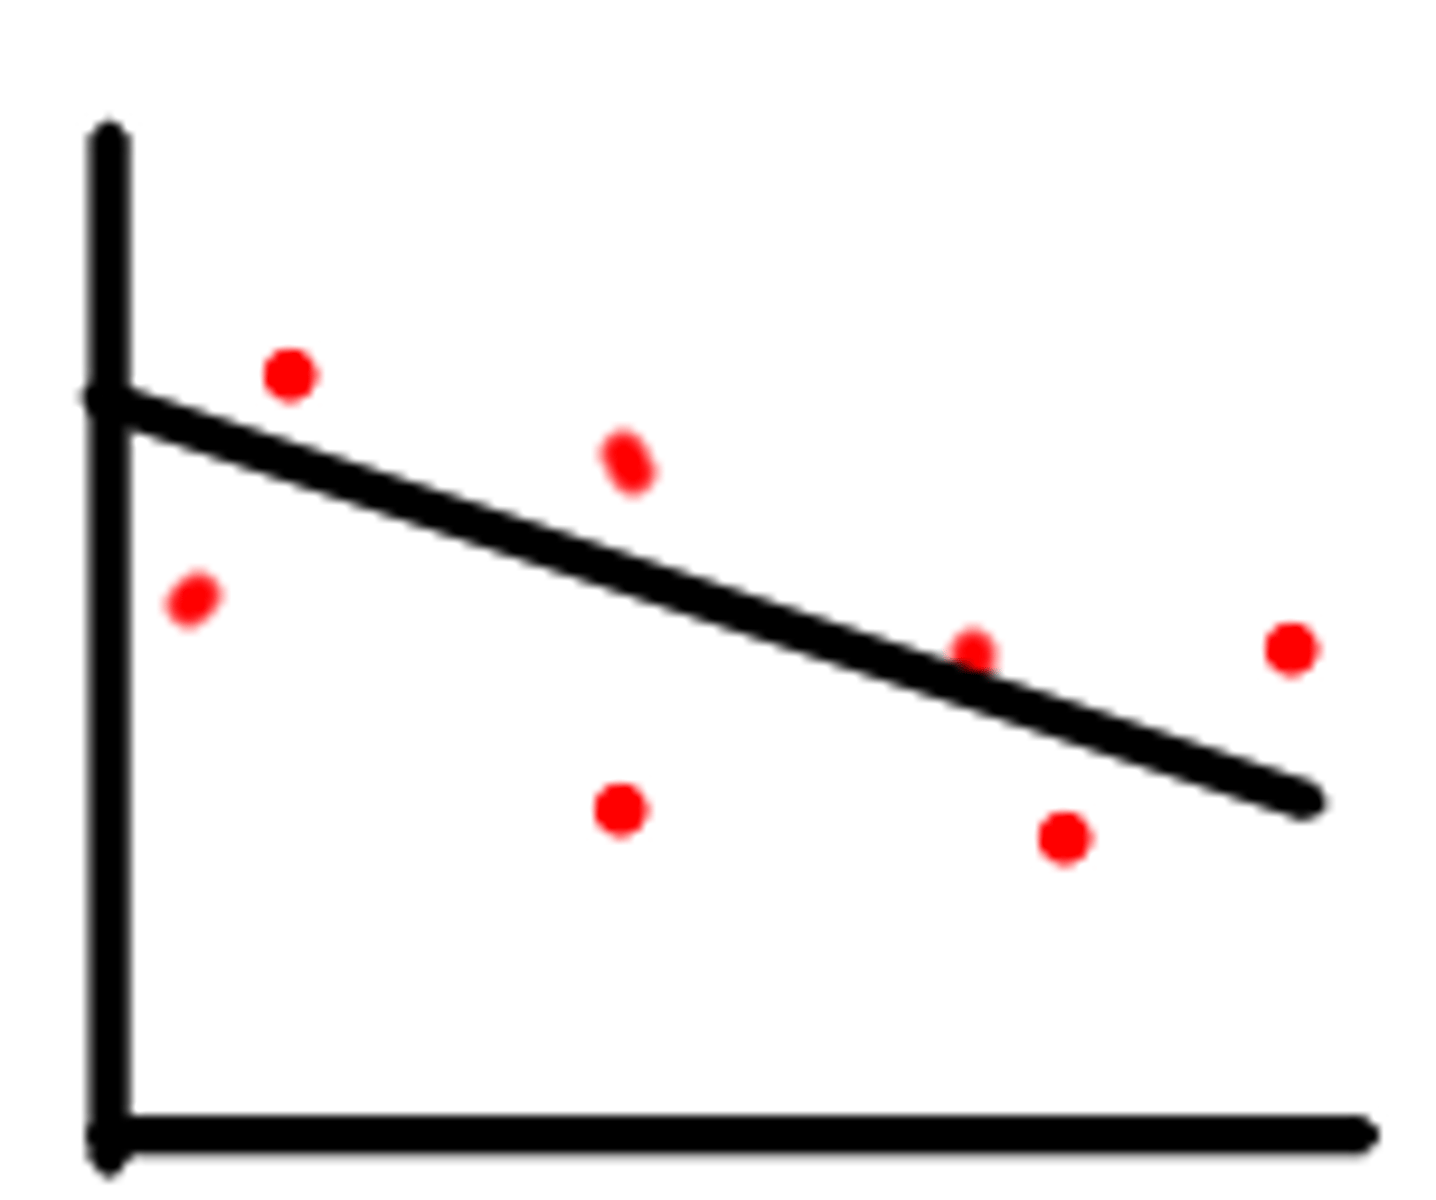
negative correlation
r is negative
no correlation
r is 0
stronger
The closer r is to 1 or -1, the _______________ the correlation.
regression analysis
is a statistical tool for evaluating the relationship of one of more independent variables X1, X2, ..., Xk to a single, continuous dependent variable Y
linear regression
What regression model would you use for a continuous outcome variable?
logistic regression
What regression model would you use for a dichotomous outcome variable?
cox regression/"survival analysis"
What regression model would you use for a dichotomous outcome variable?
linear regression
-Used for evaluating the relationship between one or more independent variables (X1, X2, …, Xk) and a single continuous dependent variable Y
–The goal is to develop a statistical model
–A model describes the relationship between variables
–For example, a model relating blood pressure to age
linear regression model
can be formulated to determine the average change in blood pressure for each additional year of age
Ordinary Least Squares (OLS)
used to estimate parameters for simple linear regression
residual
difference between observed SBP and predicted SBP
-linearity
-homoscedasticity
-independence
-normality
What are the assumptions with a linear regression model?
linearity
One assumes the relationship between X and Y is linear
homoscedasticity
Assume that error in the relationship between X and Y is distributed equally
independence
observations are independent of each other
normality
any fixed value or XY is normally distributed
multiple linear regression analysis
an extension of straight-line regression analysis (the simple linear model - which involves only one independent variable) to the situation in which more than one independent variable is considered
confounding
A regression equation can also include variables representing
__________ factors or other factors of interest
the type of outcome variable
The choice of regression model depends on what?
logistic regression
•Can be used to predict a binary outcome variable
•Provides the effect of the estimate as an odds ratio (OR) between groups for categorical predictors or with each 1-unit increase for continuous predictors
OR>1
indicates the odds of having the event increases as the predictor increases
OR<1
indicates the odds of having the even decreases as the predictor increases
outcome
the occurance and timing of an event
cox regression
- Appropriate when we follow subjects over time from a well-defined time point
- Data collection stops at event, end of study, exit for “other” reasons
-Those who do not experience the event during the study period are said to be
censored
deaths
Cox regression "survival analysis" is often applied to the study of what?
survival time
time to event outcome variable
HR=0
treatment leads to same hazard or same survival time
HR>1
greater hazard in the tx group than in the control group
HR<1
smaller hazard in the tx group than in the control group
Kaplan-Meier Curves
•Widely used for estimating survival curves for:
•Survival time for a given proportion of the sample (50%)
•Probability up to and beyond a given time (5-year, 10-year, etc.)
•Compare survival among groups