Hematology hemoglobin and RBC indices
1/43
There's no tags or description
Looks like no tags are added yet.
Name | Mastery | Learn | Test | Matching | Spaced |
|---|
No study sessions yet.
44 Terms
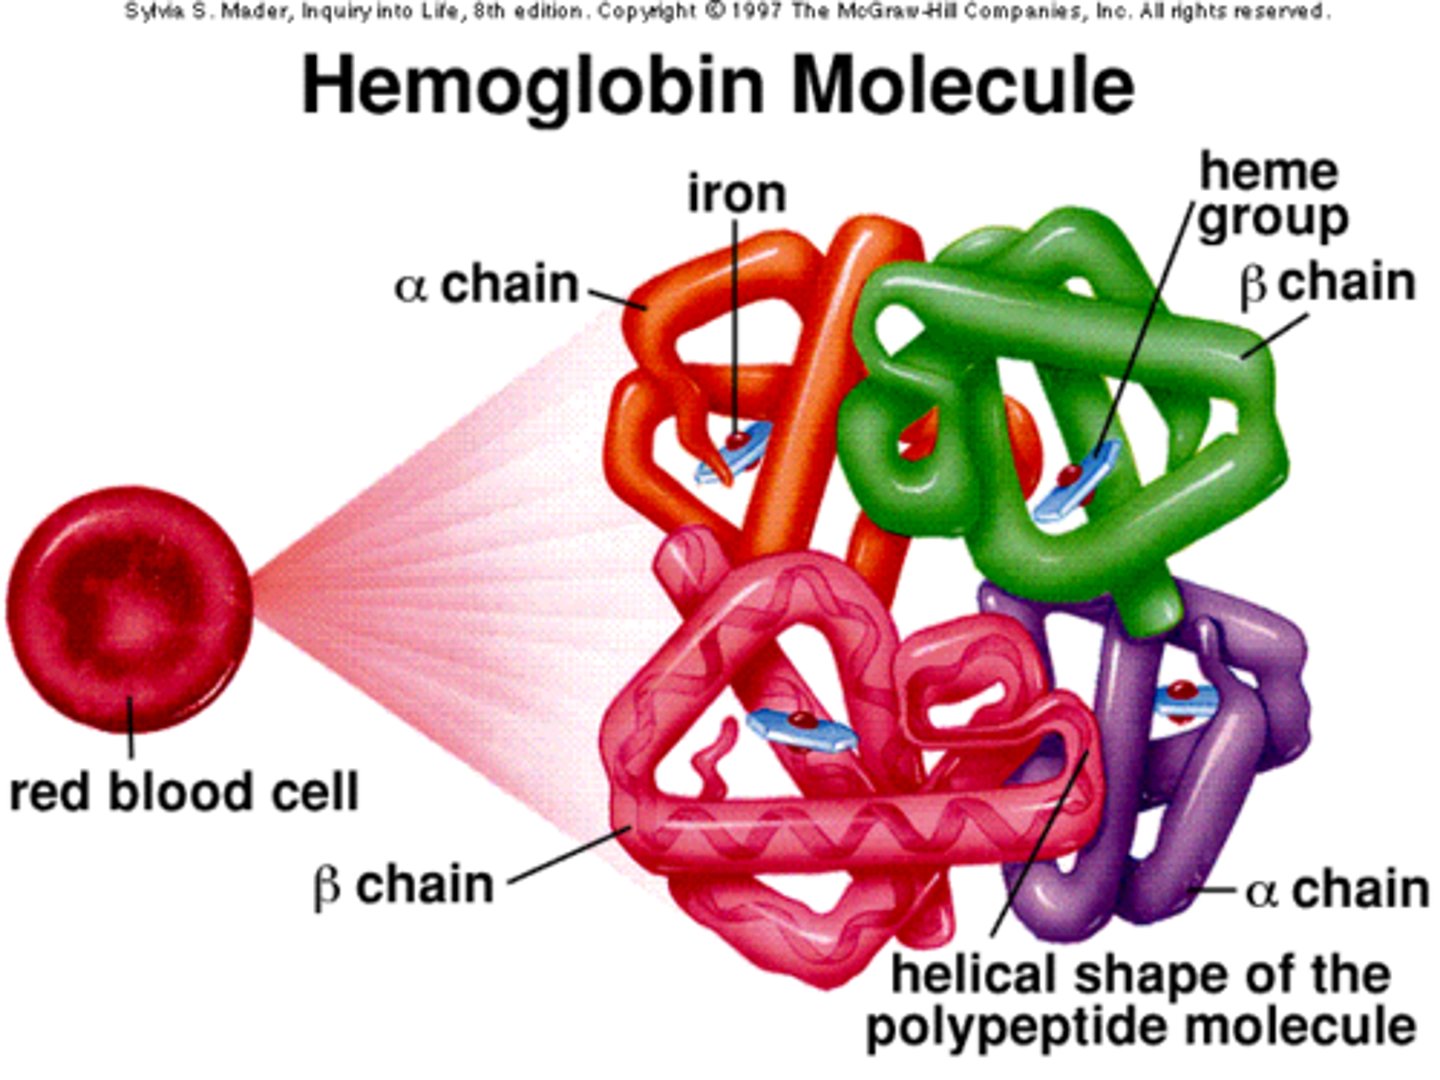
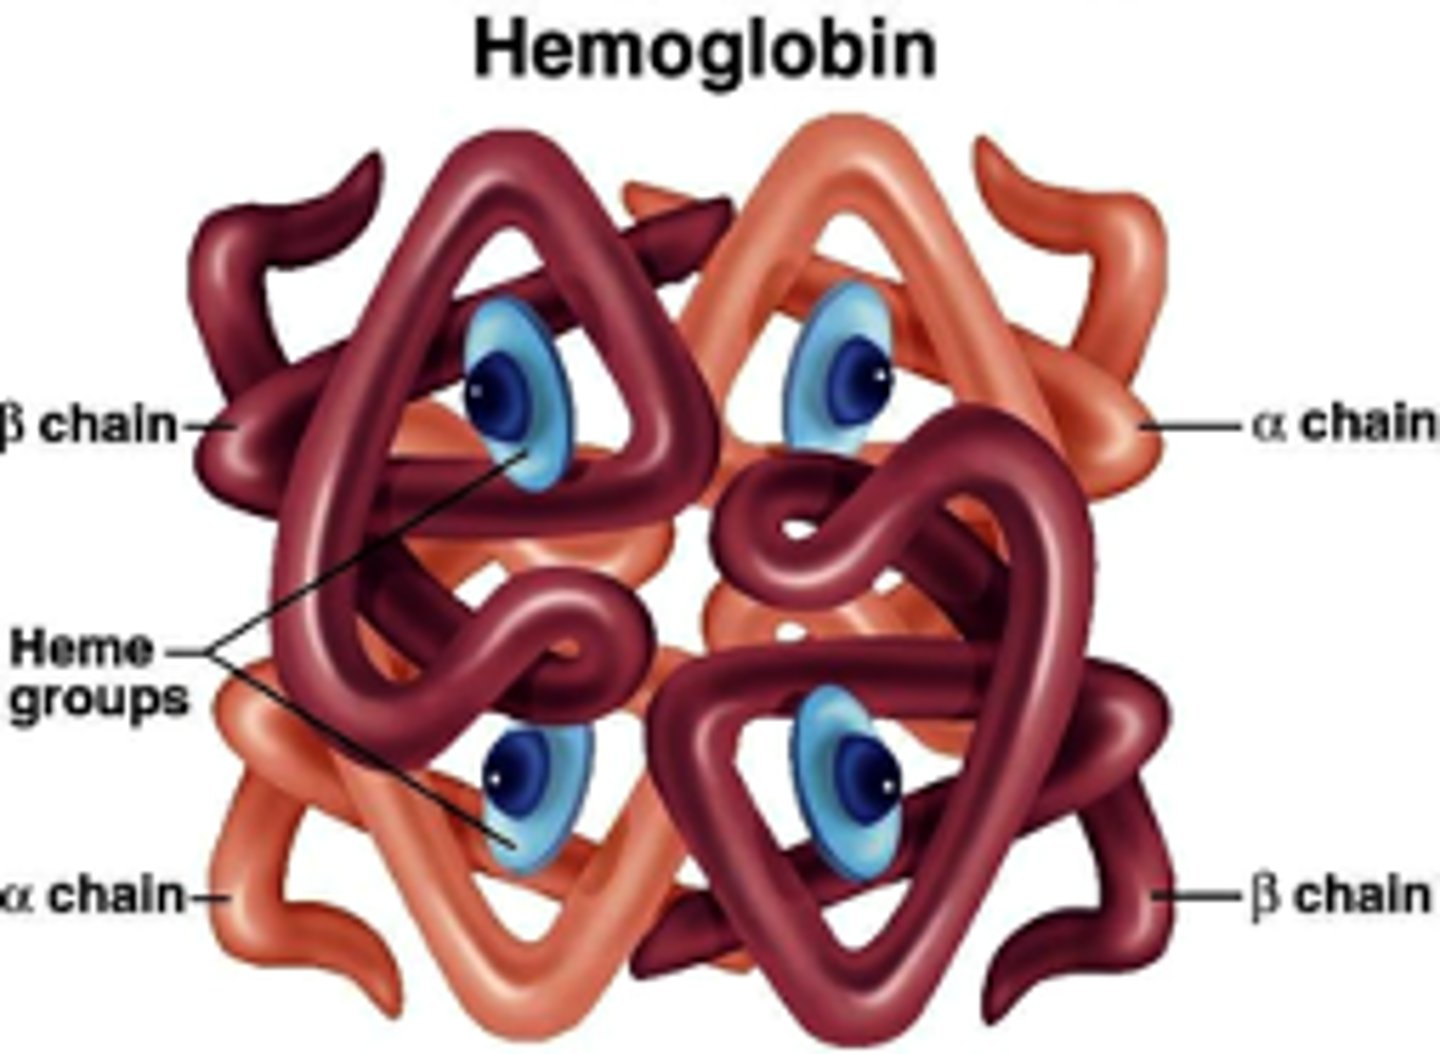
Hemoglobin
4 globular subunits (each with heme group) - one group = 1 o2
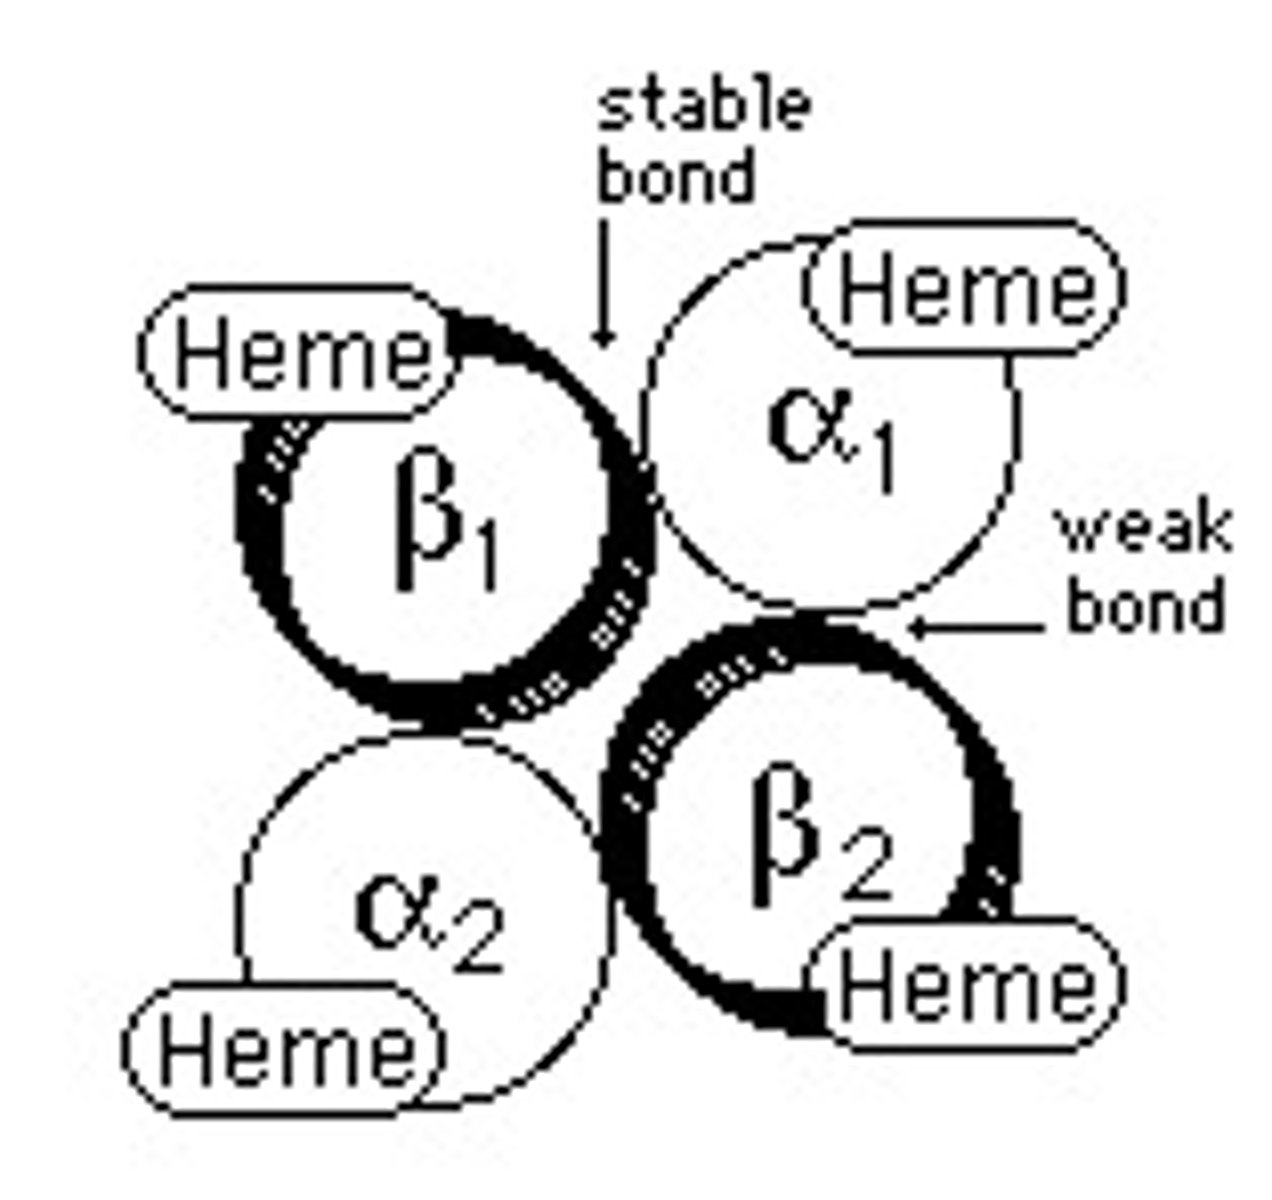
Hb dimers
2 unlike chains (one alpha, one non-alpha)
Fetal Hb
a2y2 (2 alpha 2 gamma) → 90-95% blood before birth
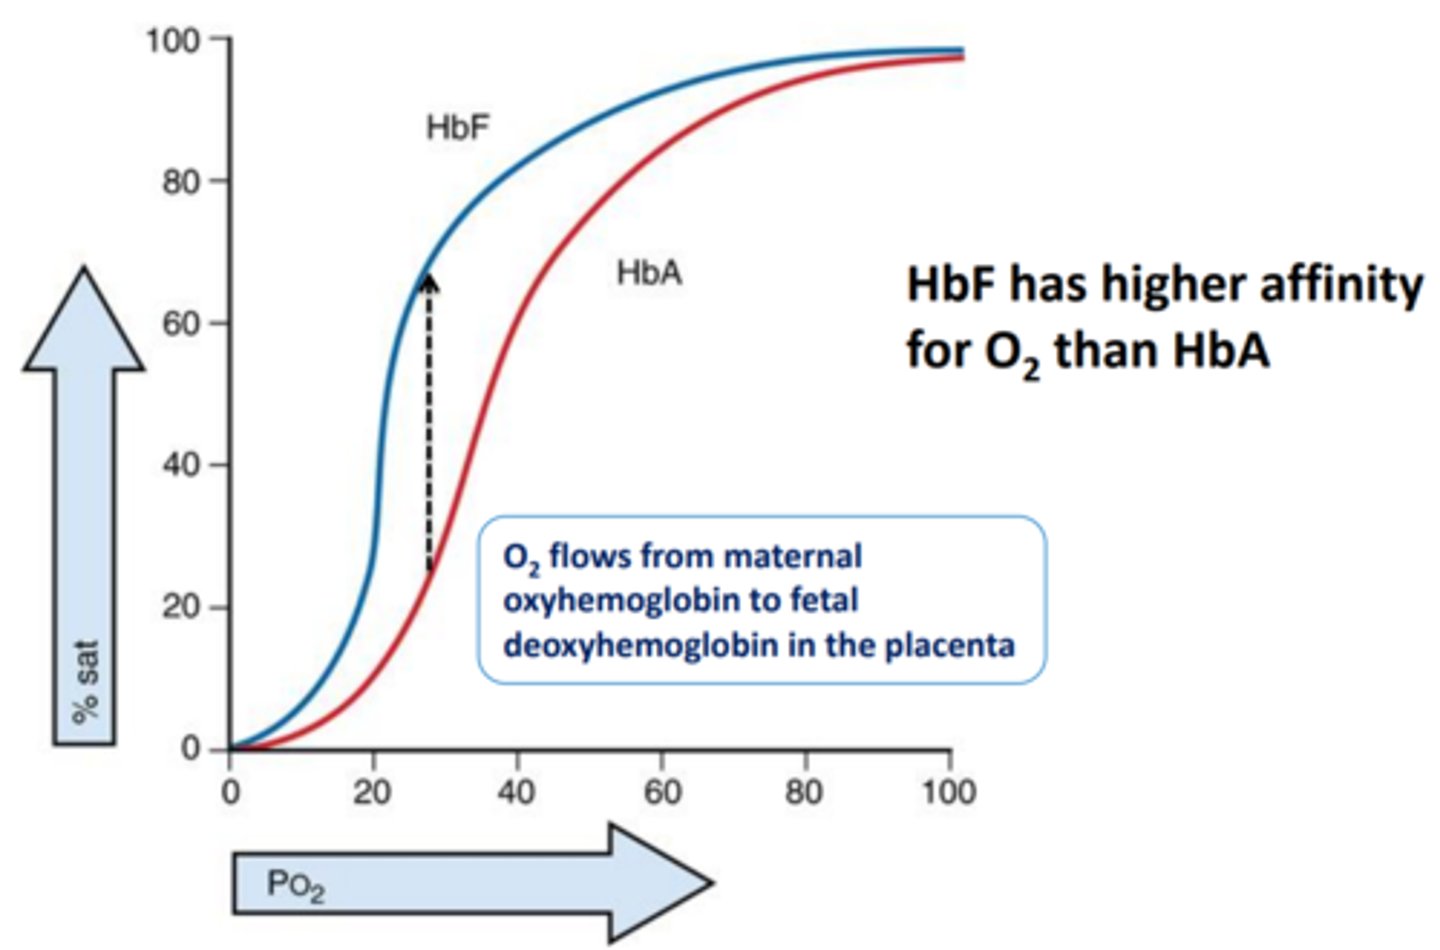
Adult (HBA)
a2b2 (95% blood)
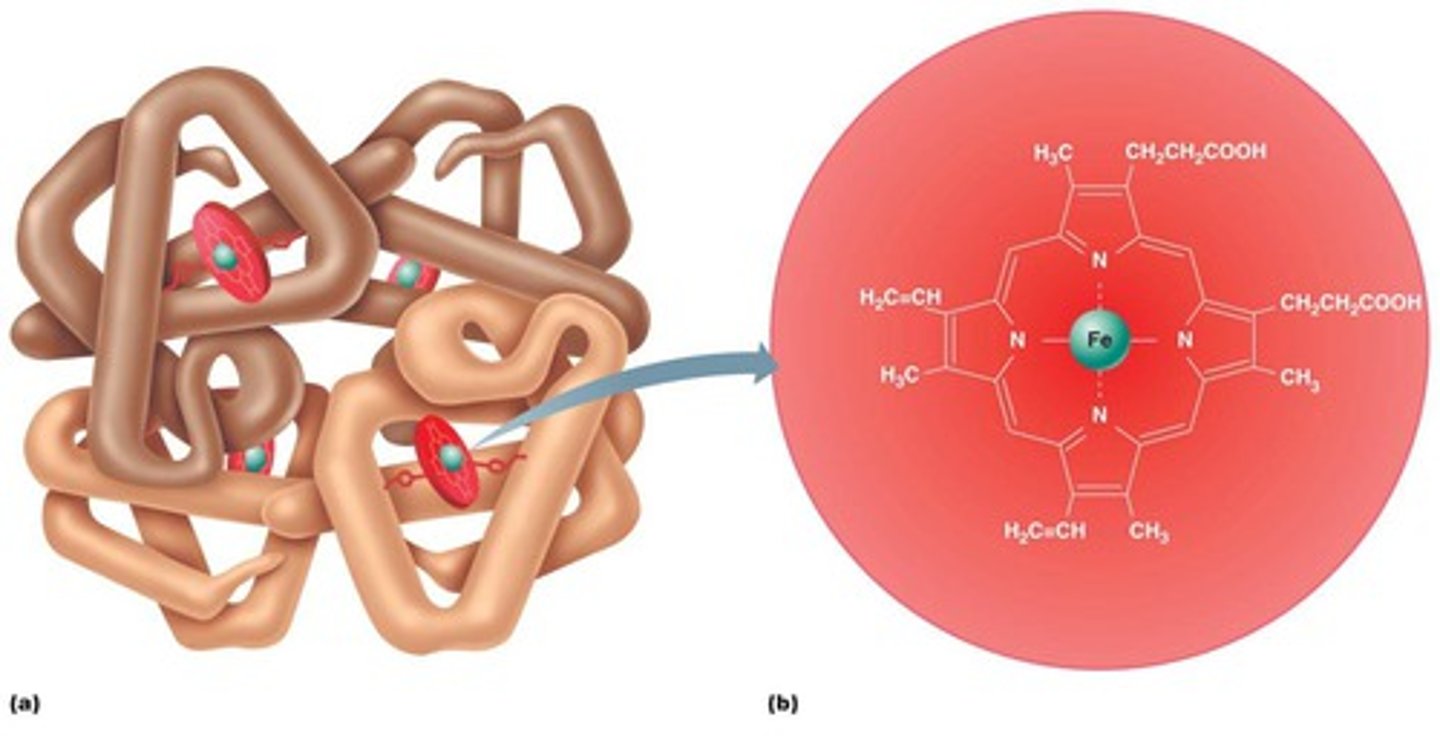
Heme
iron must be in the Fe2+ state Ferrous iron has 6e- pairs/bind sites (4 bind to nitrogen, 1 to histidine, 1 to oxygen) → synthesized in mitochondria
Deoxyhemoglobin
T state with low o2 affinity, stabilized by intersubunit salt bridges, stable at higher temperatures
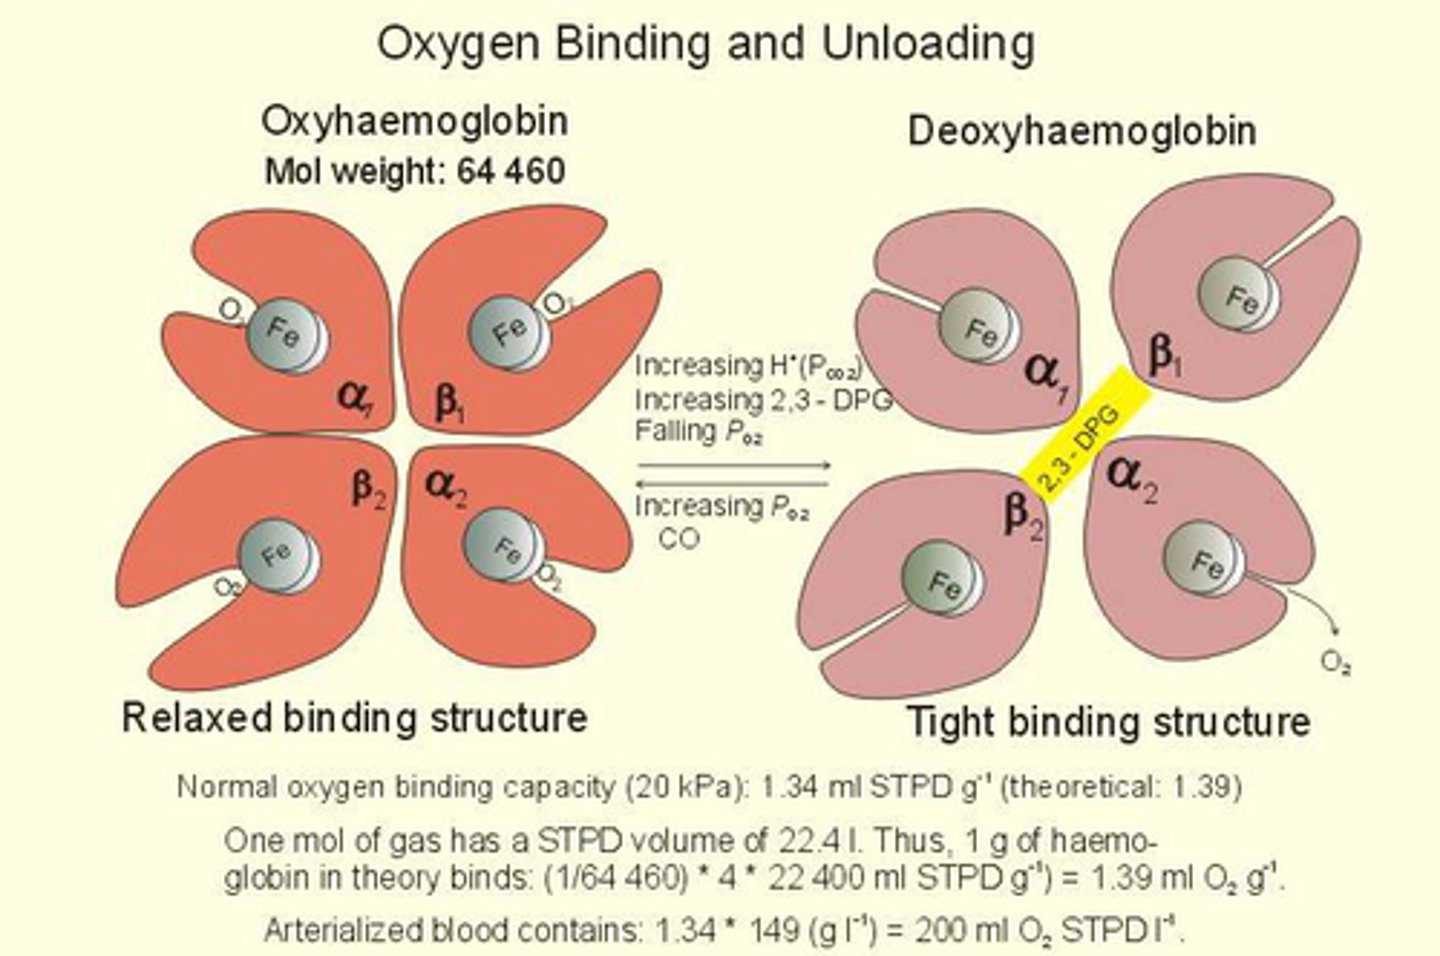
Oxyhemoglobin
R relaxed state, high o2 affinity, salt bridges gone, lower temps
Allosteric effects
o2 affinity decreases in response to allosteric effects (ph, co2, 2,3 BPG) → allosteric effectors form salt bridges for T state
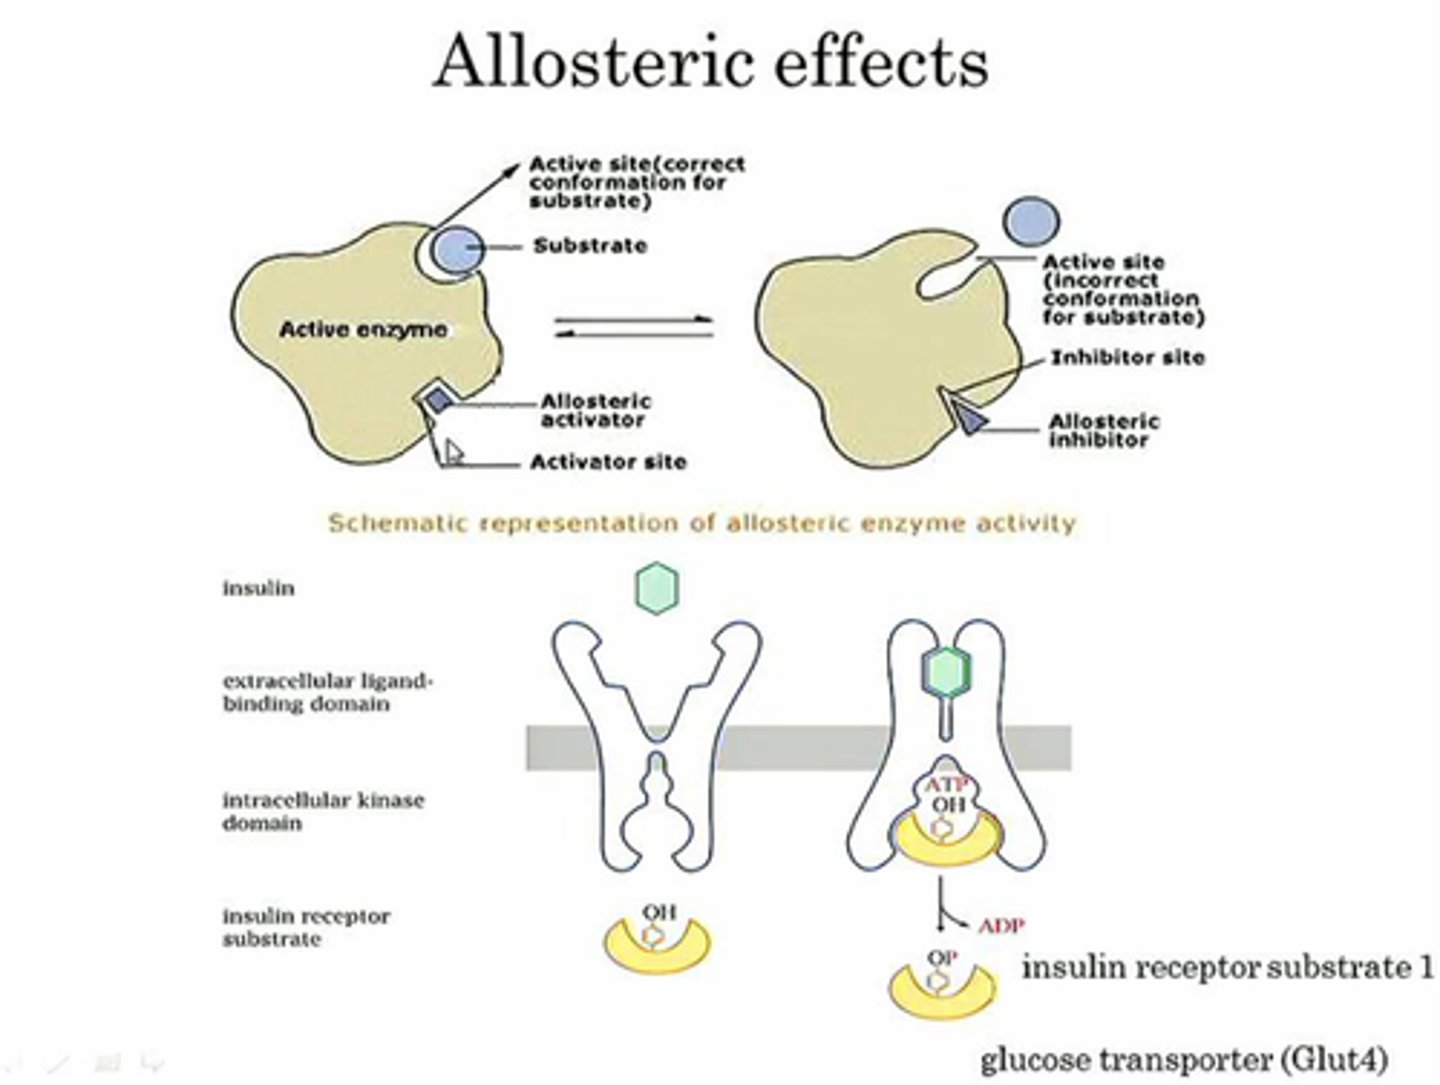
Cooperative o2 binding
o2 binding leads to higher affinity of other o2 binding → break salt bridge →hb goes T to R state → 2,3 BPG expelled
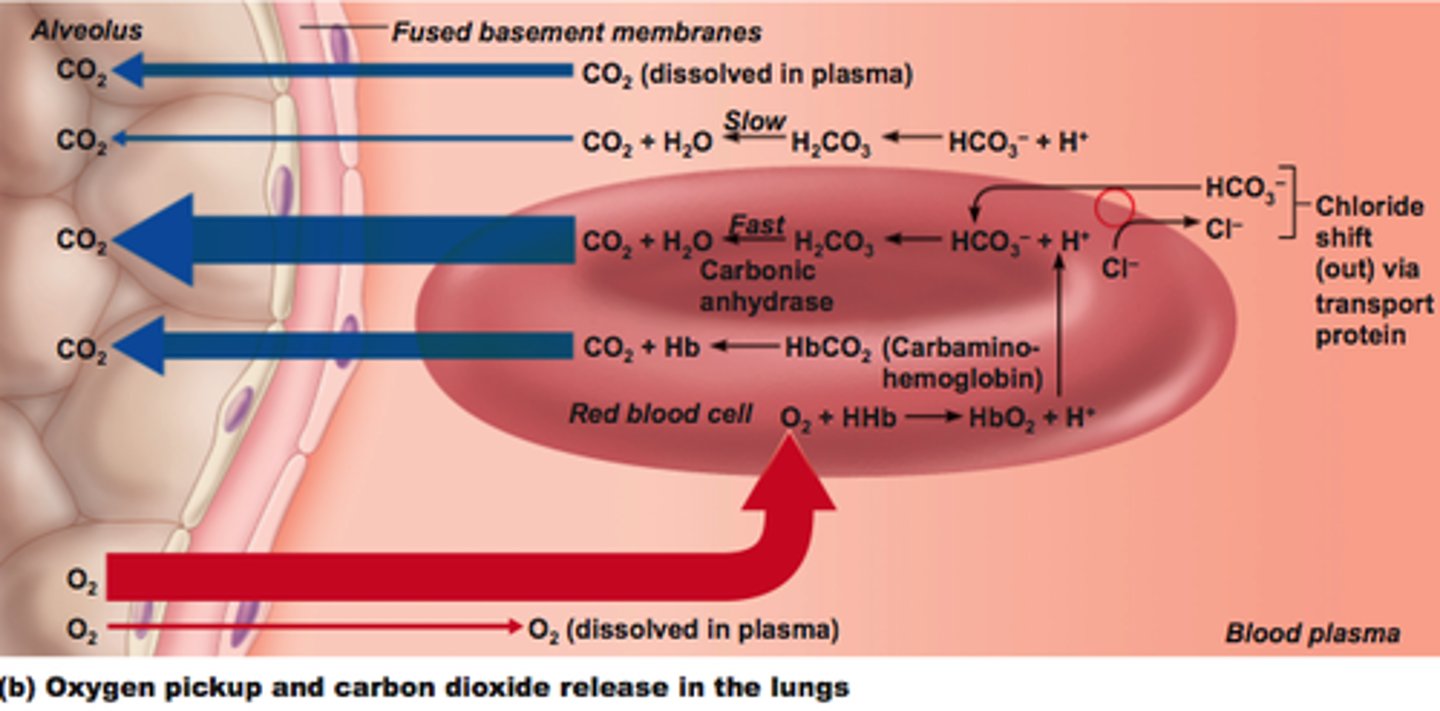
CO2 transport
most co2 as carbonic acid (in rbc) → some binds to n-terminal of hb (carbaminohemoglobin), some in plasma
Hemosiderinuria
presence of iron-containing pigment (hemosiderin) in urine (chronic hemolysis)
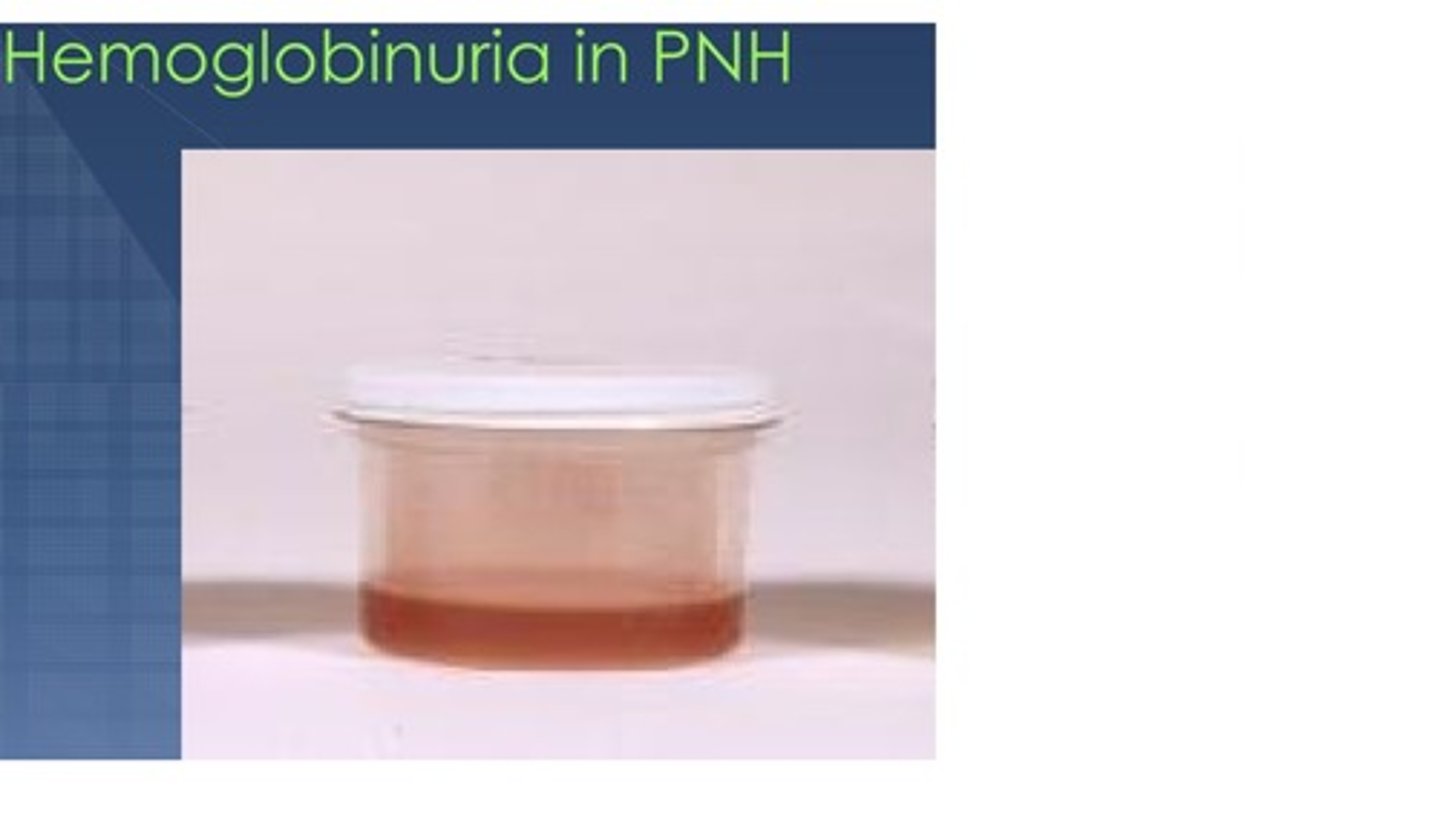
Hemoglobinuria
Presence of free hemoglobin in the urine
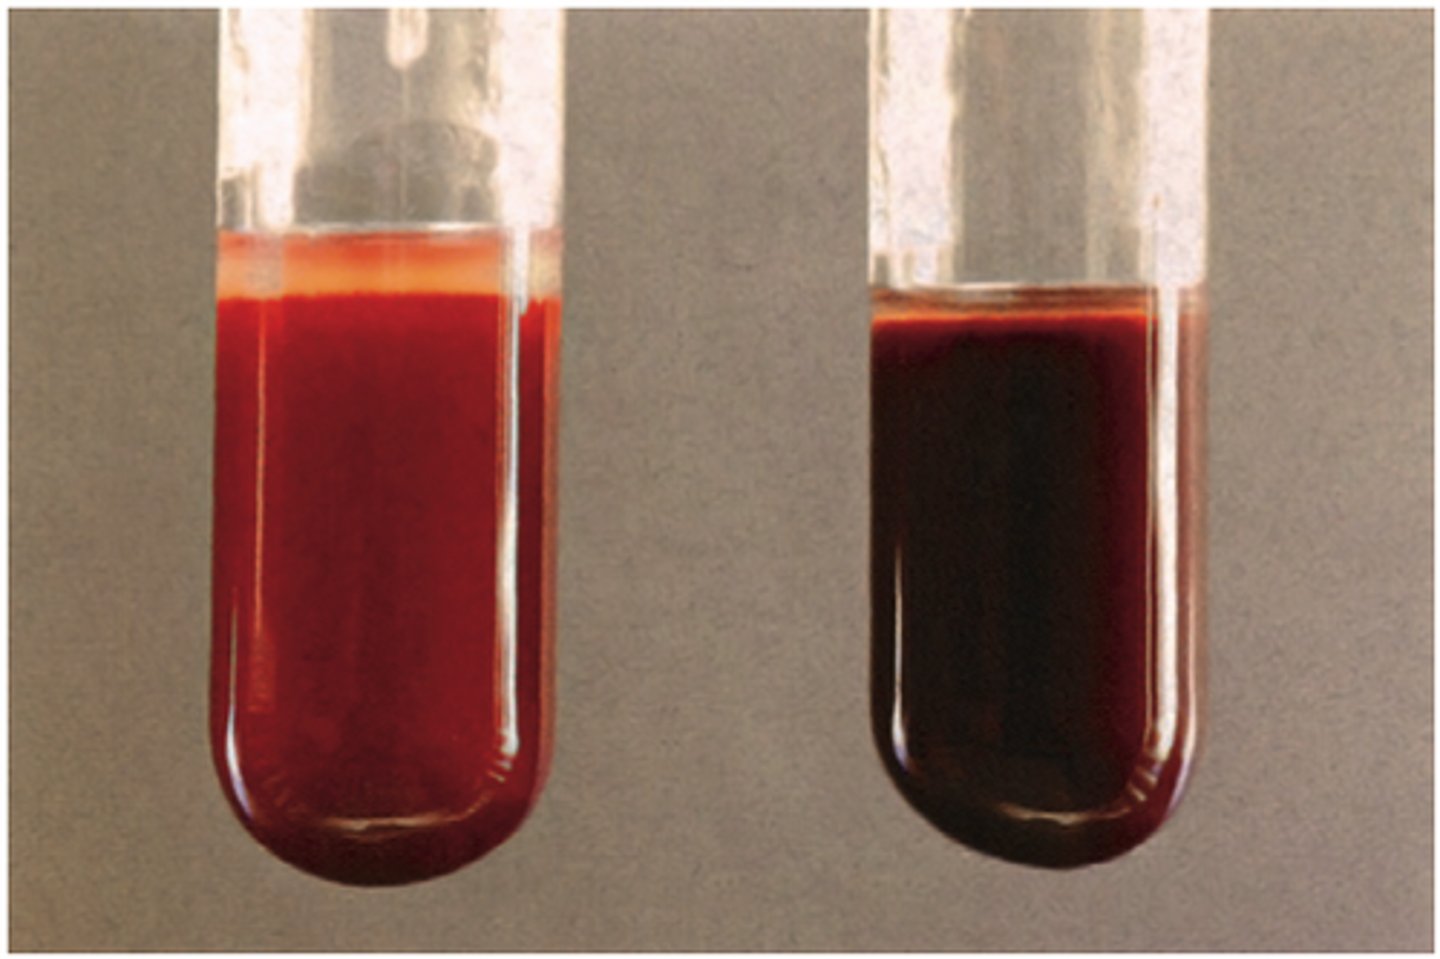
Methemoglobin
Hb iron in ferric state cannot combine with o2 → CHOCOLATE BLOOD
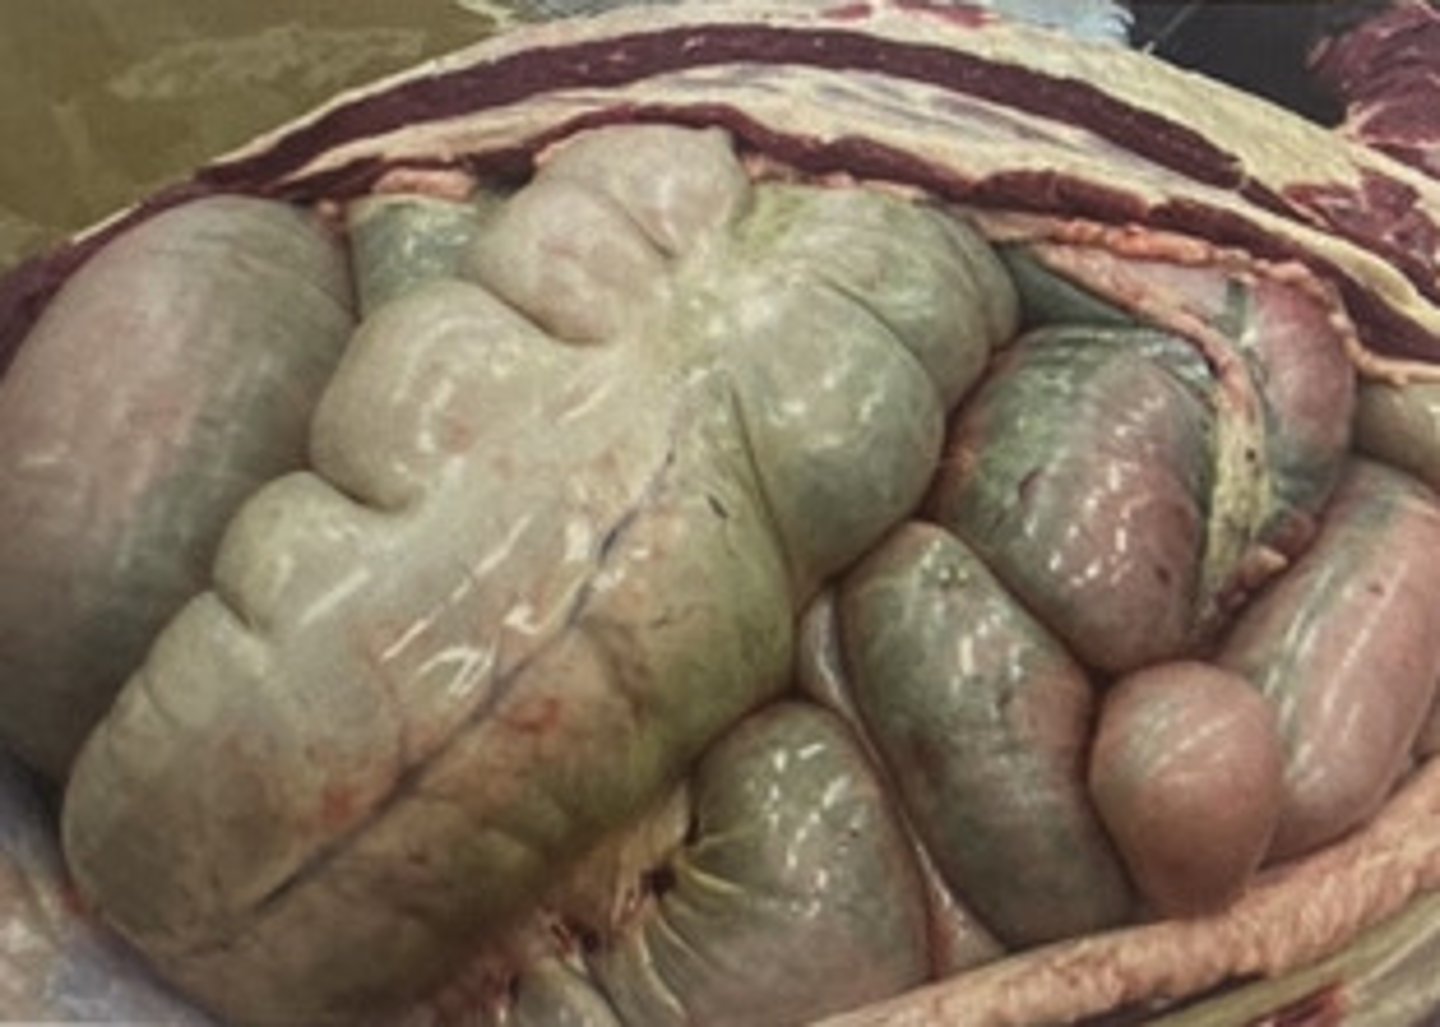
Sulfhemoglobin
Sulfur combines with hb (GREEN BLOOD)
Carboxyhemoglobin
CO carbon monozide ocmbines with Hb (CHERRY RED blood)
RBC count
amount of RBC/unit volume of blood (RI$ 4.4-5)
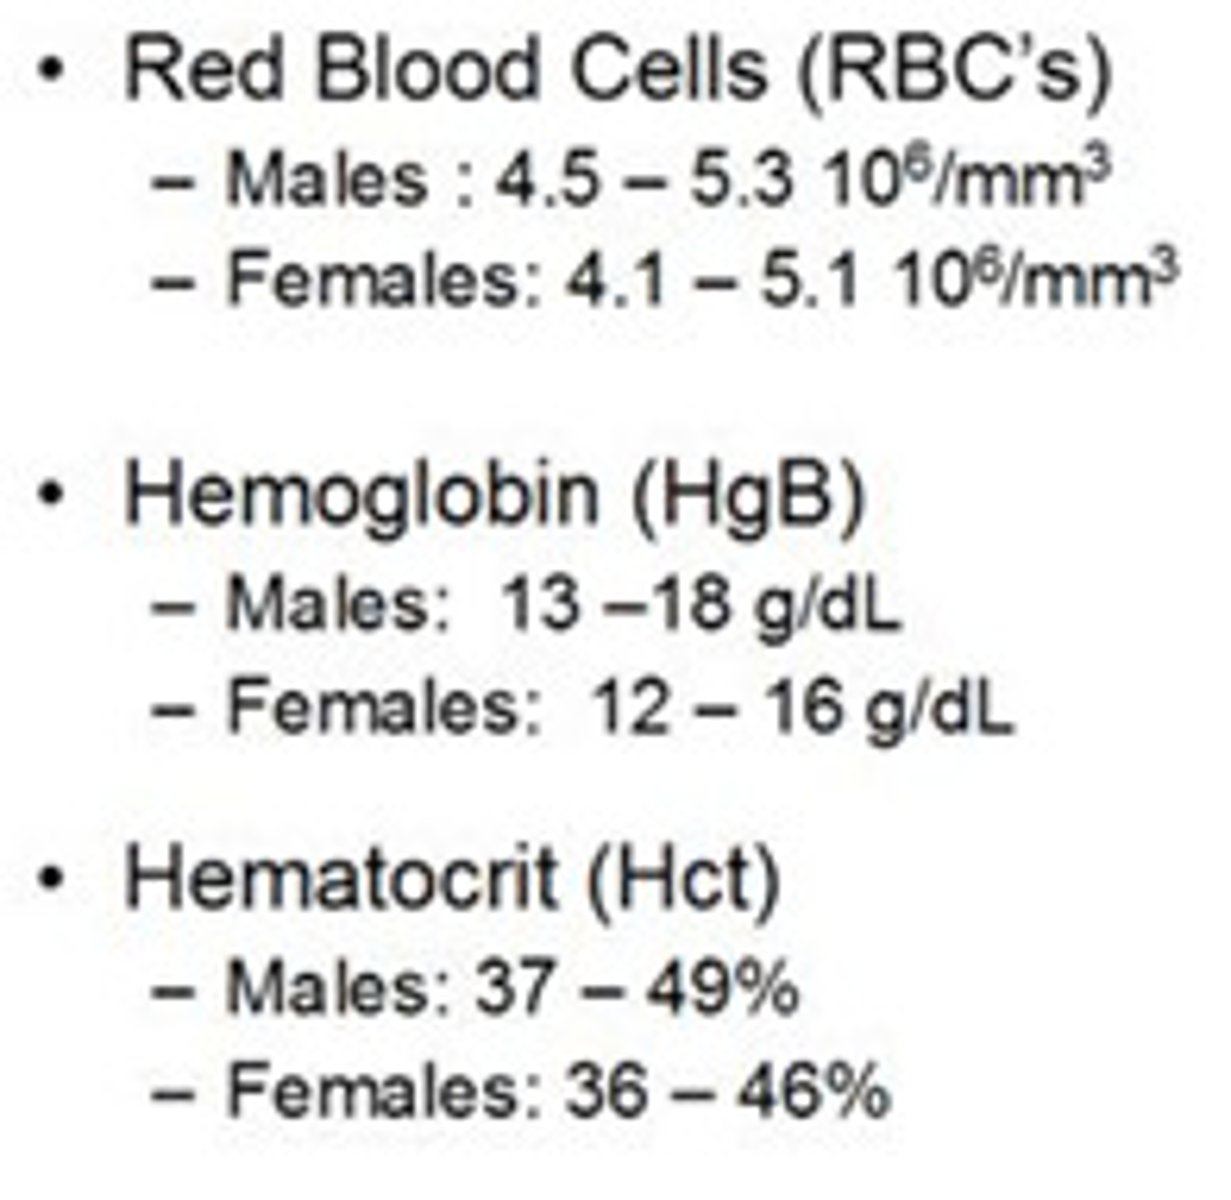
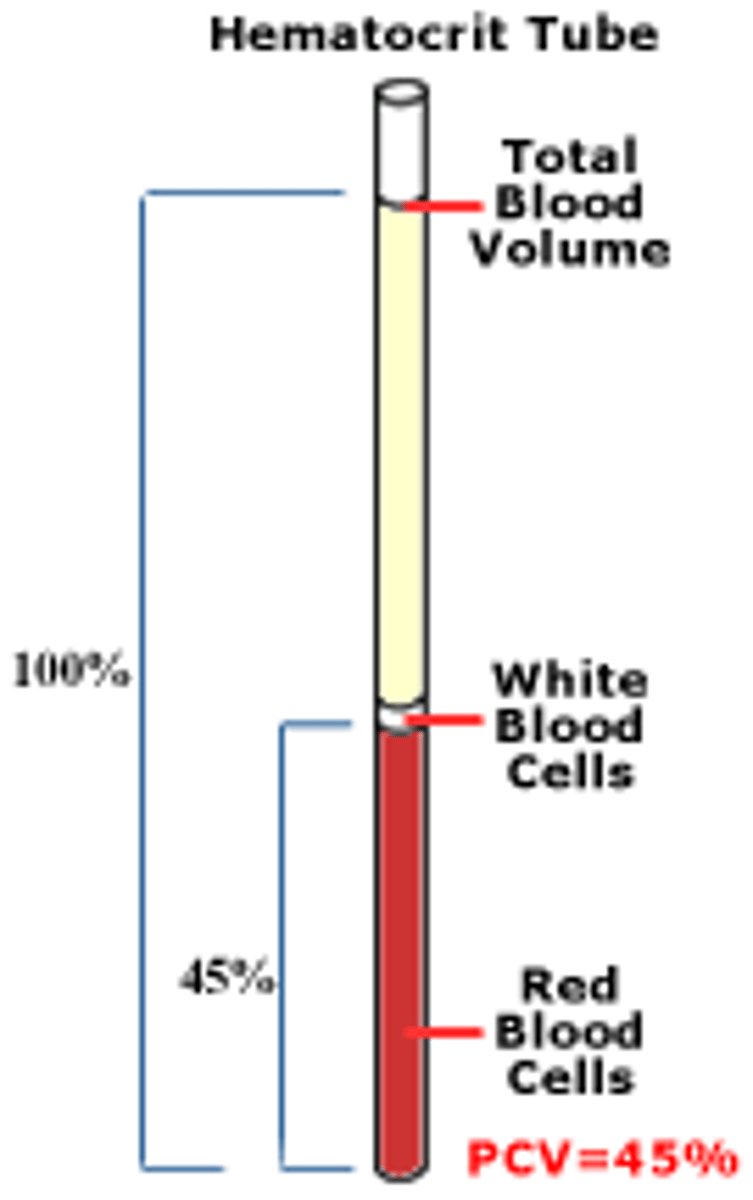
Hematocrit
RI= 36-53%
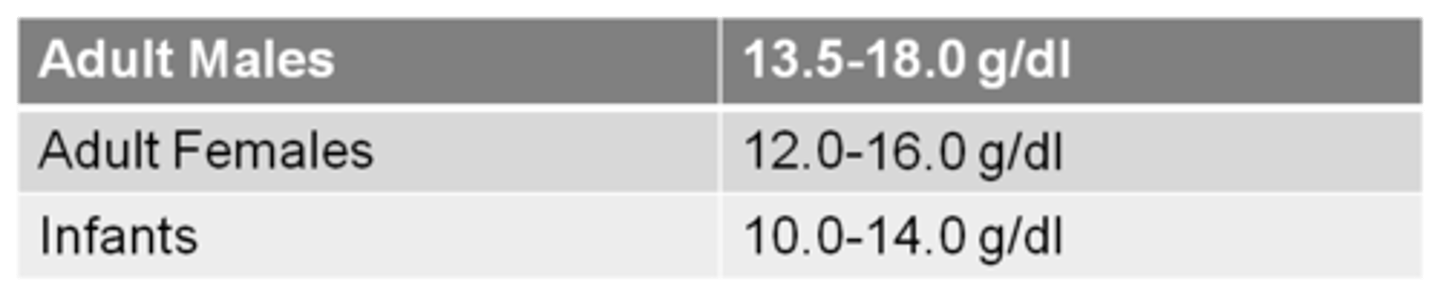
Hb
RI = 12-17.4
RBC indices
classify RBC by size and Hb content (RBC, Hct, Hb)
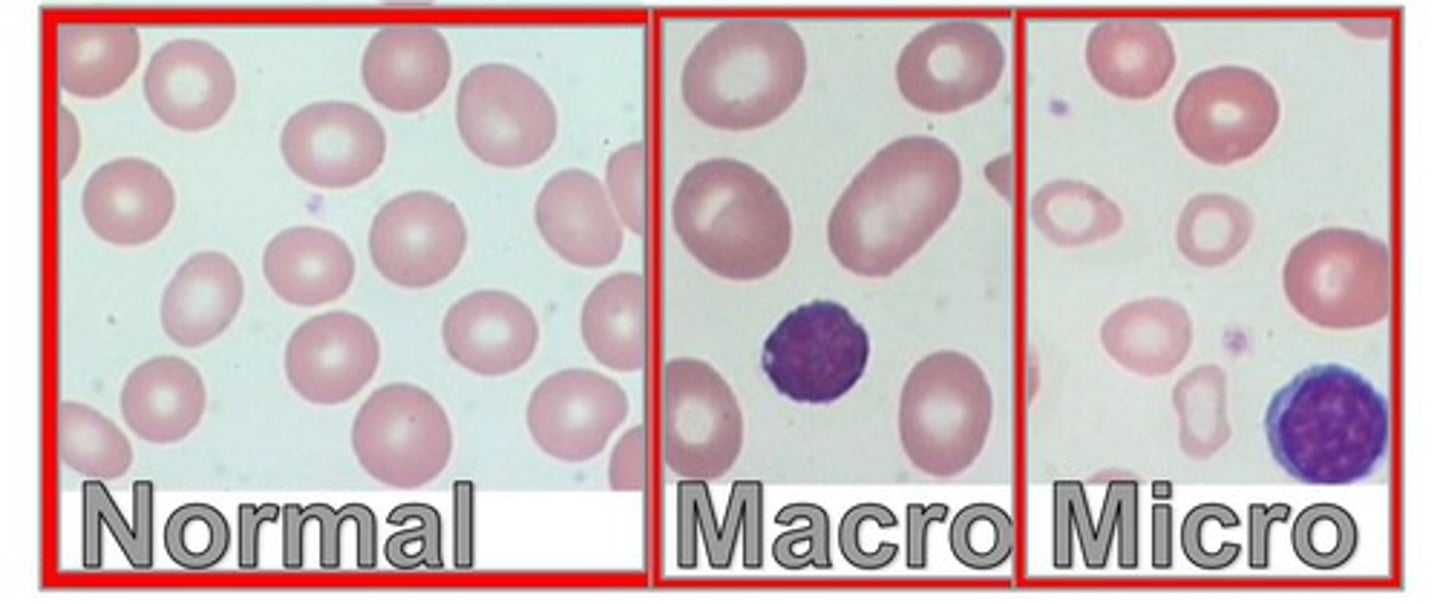
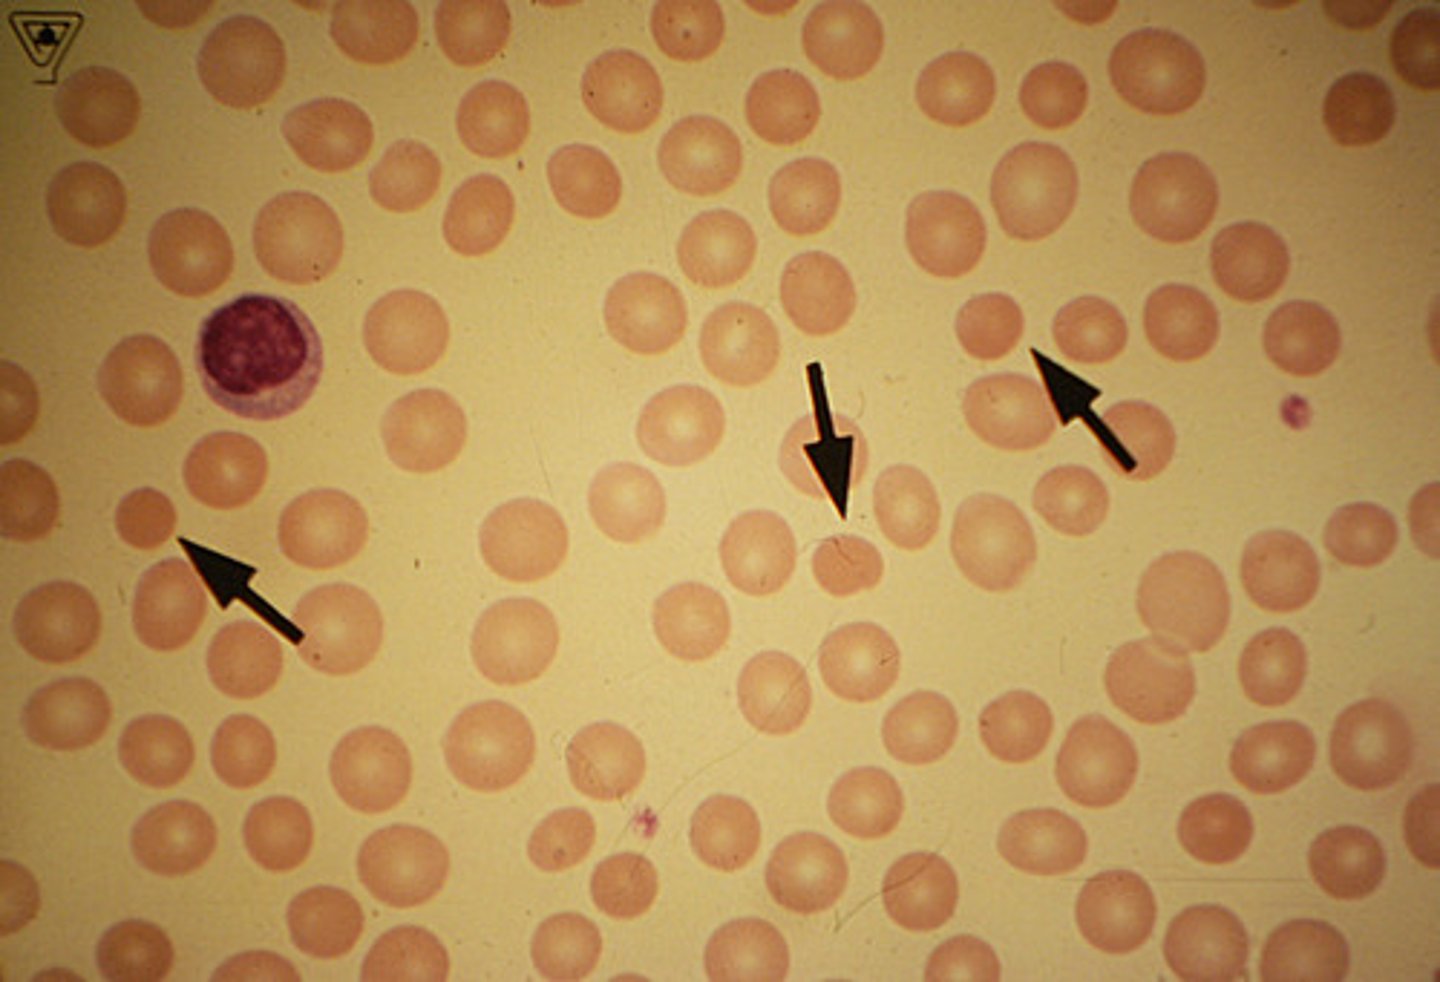
Mean cell volume
MCV average volume of individual rbc (RI = 80-100 fL) [hct%/#RBCs * 10] HIGH MCV = larger cells (macrocytic)
![<p>MCV average volume of individual rbc (RI = 80-100 fL) [hct%/#RBCs * 10] HIGH MCV = larger cells (macrocytic)</p>](https://knowt-user-attachments.s3.amazonaws.com/019b5272-477a-4537-8454-75d4df6569a4.jpg)
Macrocytic
high MCV
Microcytic
low MCV
Normocytic
normal MCV (same size as lymphocyte)
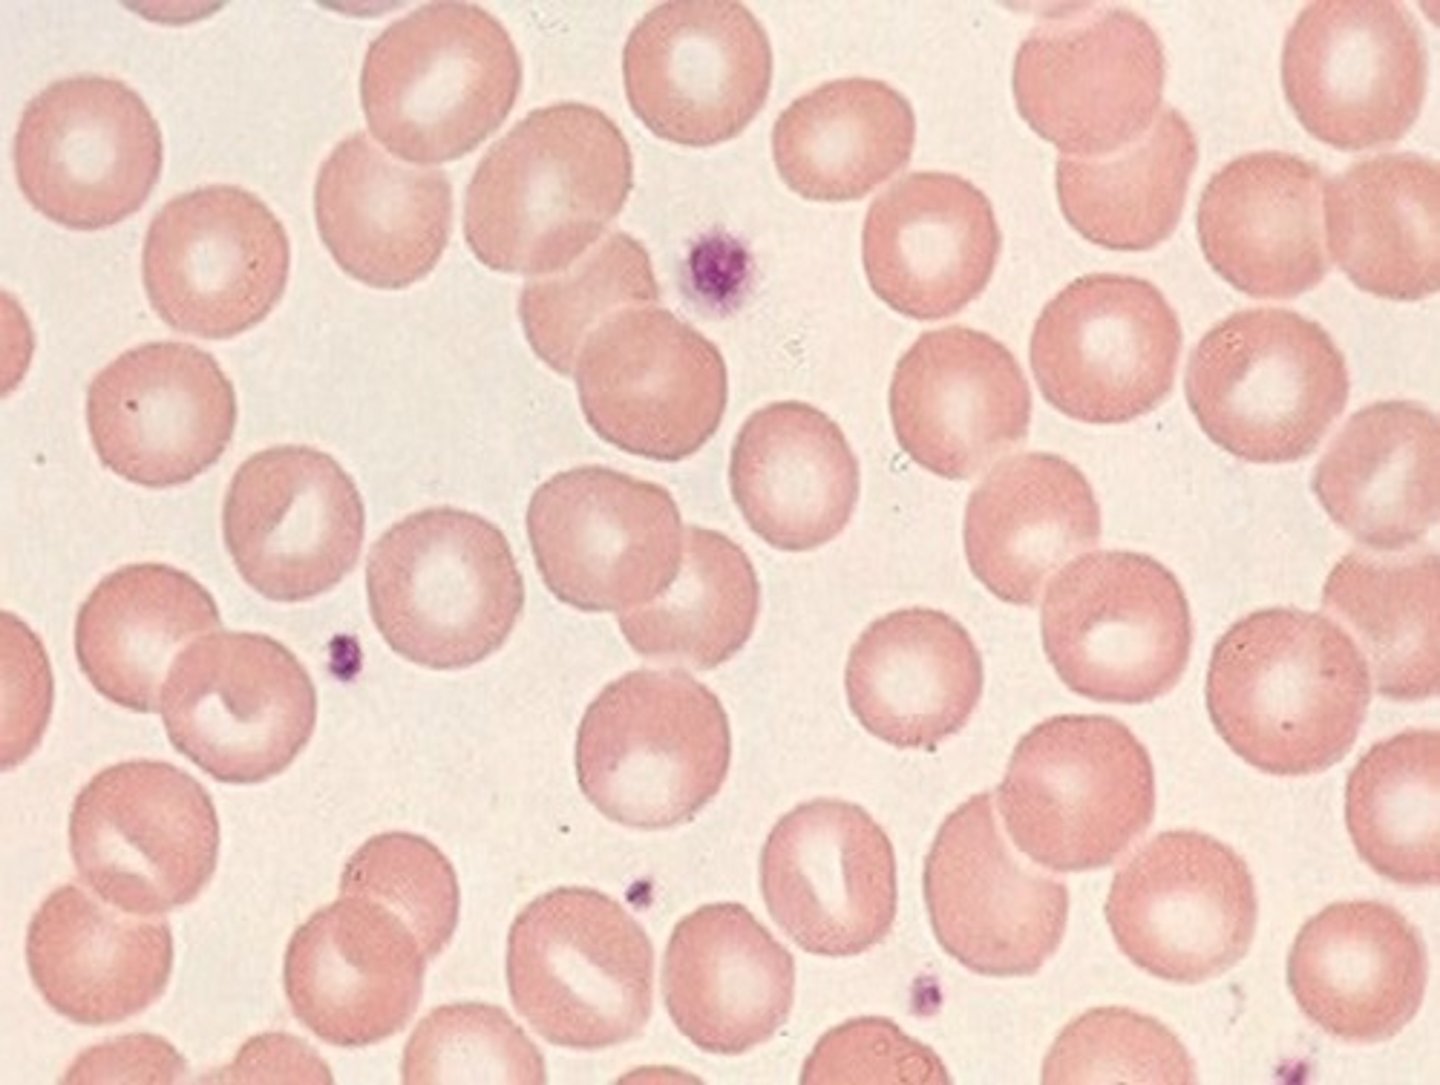
Mean corpuscular Hb (MCH)
weight if hb in RBC (RI = 28-34) NOT ACCOUNT FOR SIZE OF CELL + linear relationship with MCV (small cells = low hb) [ hb/rbc * 10]
![<p>weight if hb in RBC (RI = 28-34) NOT ACCOUNT FOR SIZE OF CELL + linear relationship with MCV (small cells = low hb) [ hb/rbc * 10]</p>](https://knowt-user-attachments.s3.amazonaws.com/60b86e9c-9266-41eb-8400-49c7d1946bd7.png)
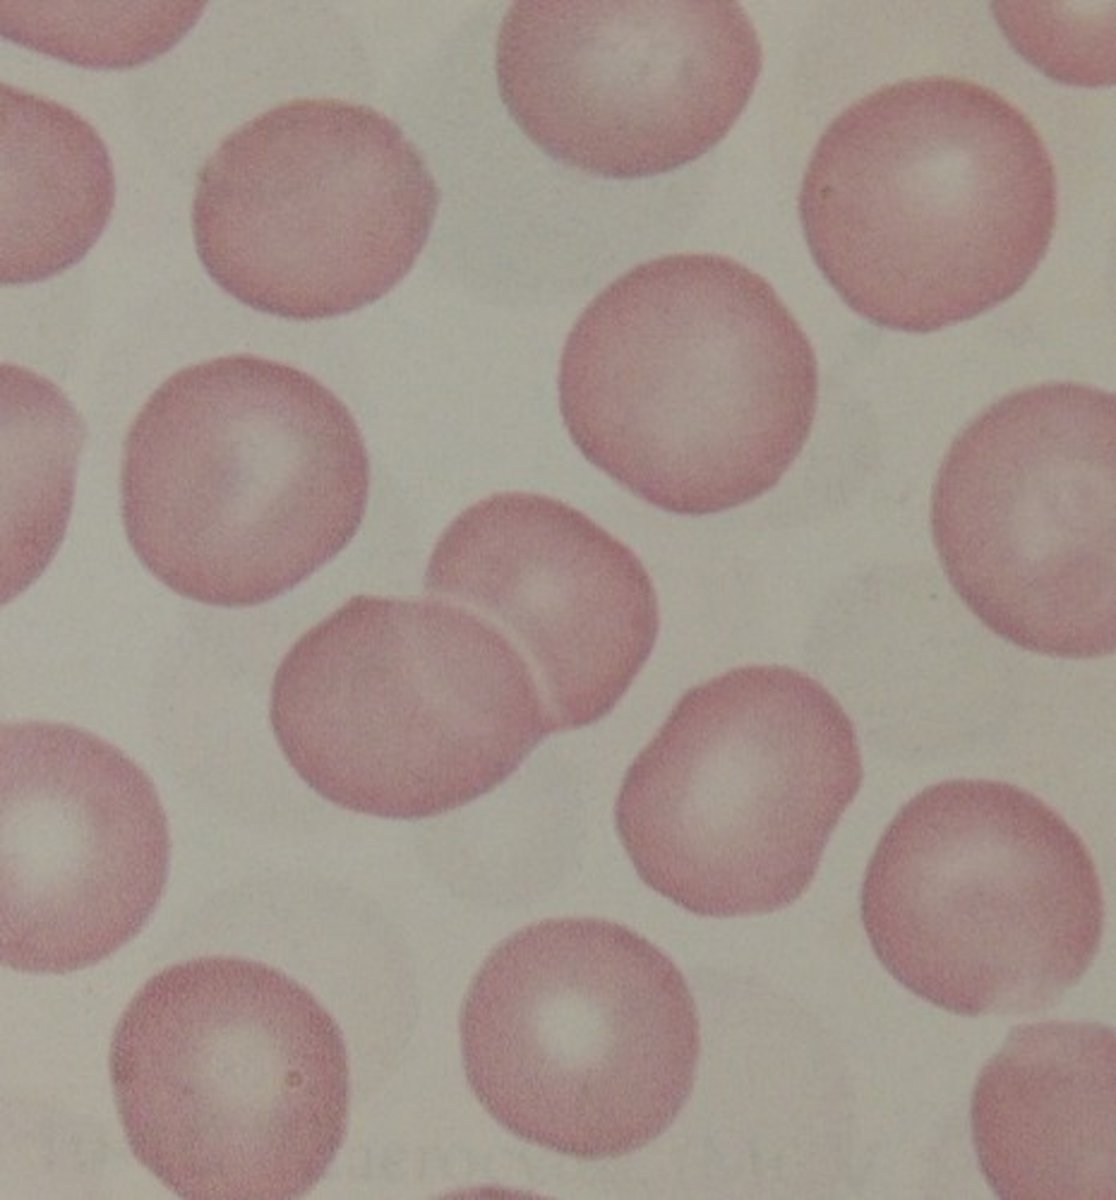
Mean cell HB Concentration MCHC
accounts for cell size (RI = 32-36 g/dL) [hb/hct *100]
![<p>accounts for cell size (RI = 32-36 g/dL) [hb/hct *100]</p>](https://knowt-user-attachments.s3.amazonaws.com/f08a8079-1234-48c0-a2fc-e555f7c1b67f.jpg)
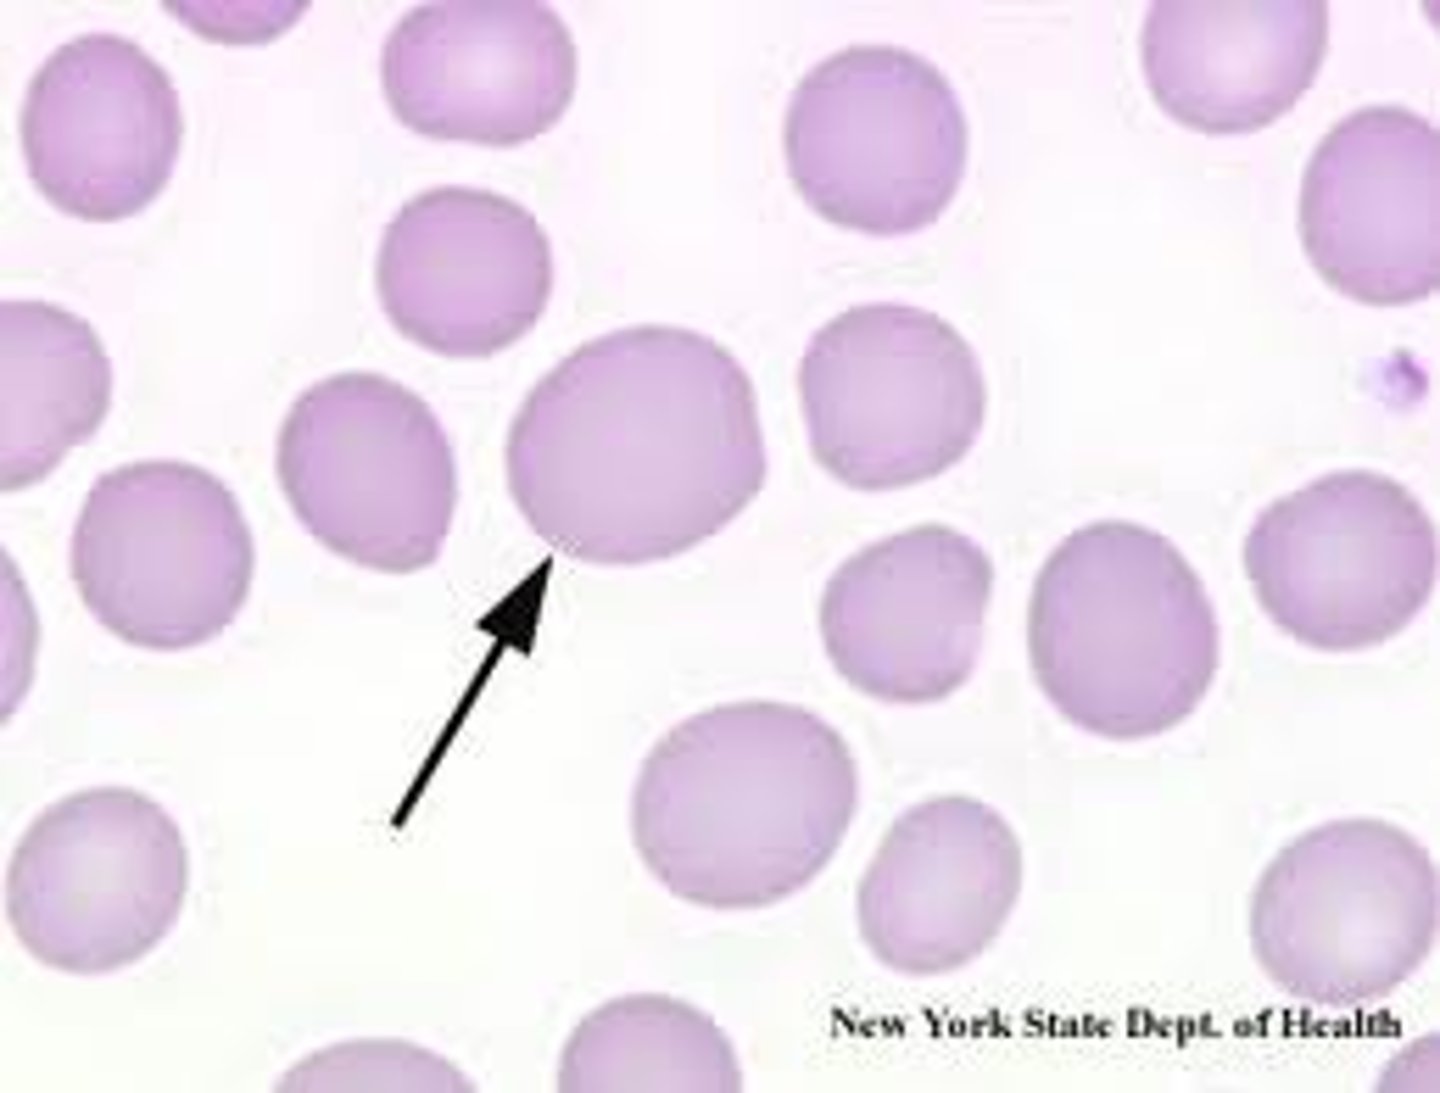
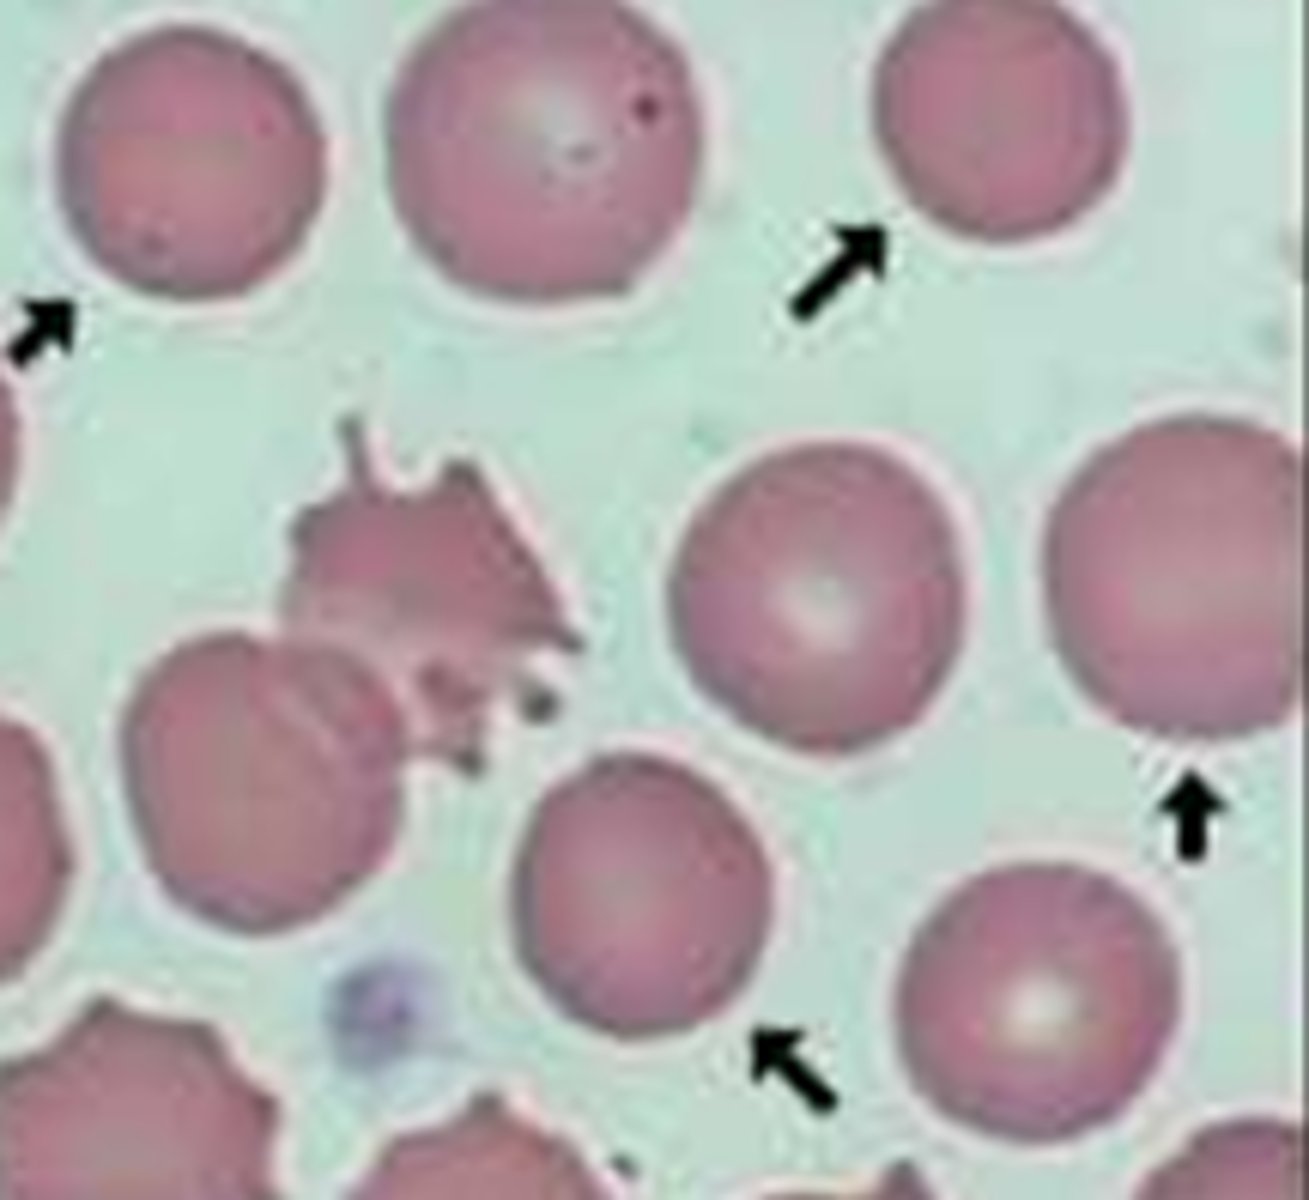
Normochromic
central pallor about ⅓ cell
Hypochromic
central pallor more than ⅓ (LOW hb)
Hyperchromic
central pallor less than ⅓ (high Hb proportionally) IN SPHEROCYTES
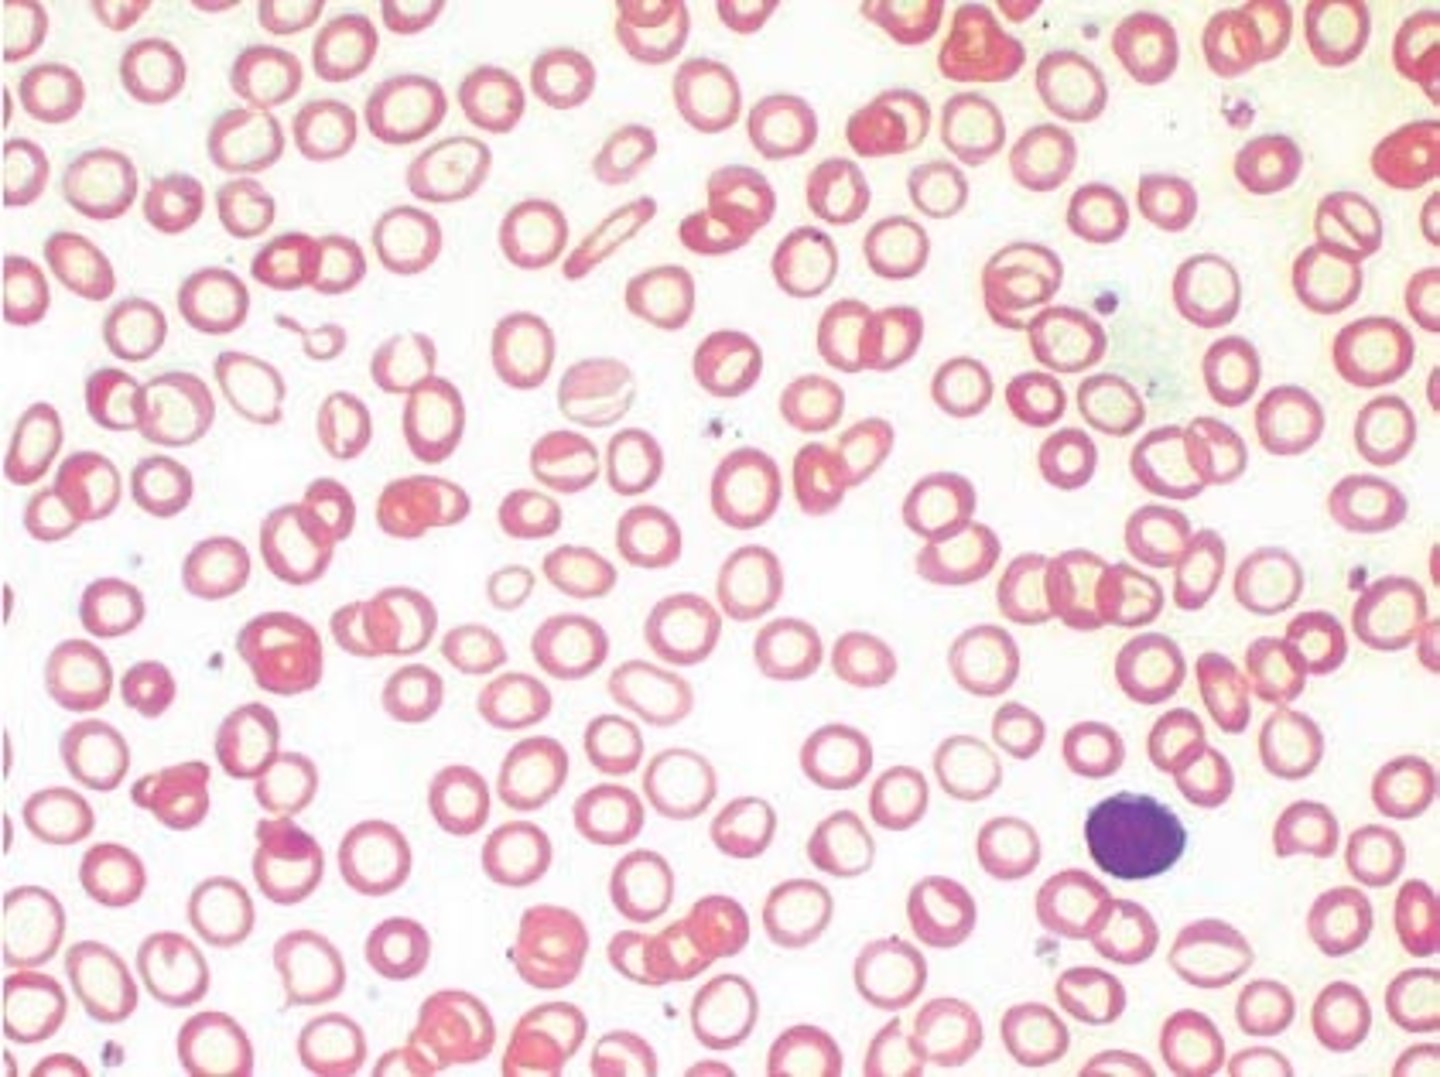
Red Cell Distribution width RDW
MCV average of rbs volume (RI = 11.5-14.5%) GREATER = anisocytosis [1SD/MCV * 100]
![<p>MCV average of rbs volume (RI = 11.5-14.5%) GREATER = anisocytosis [1SD/MCV * 100]</p>](https://knowt-user-attachments.s3.amazonaws.com/65535f1e-1586-4ad7-81f9-efc2261a4189.png)
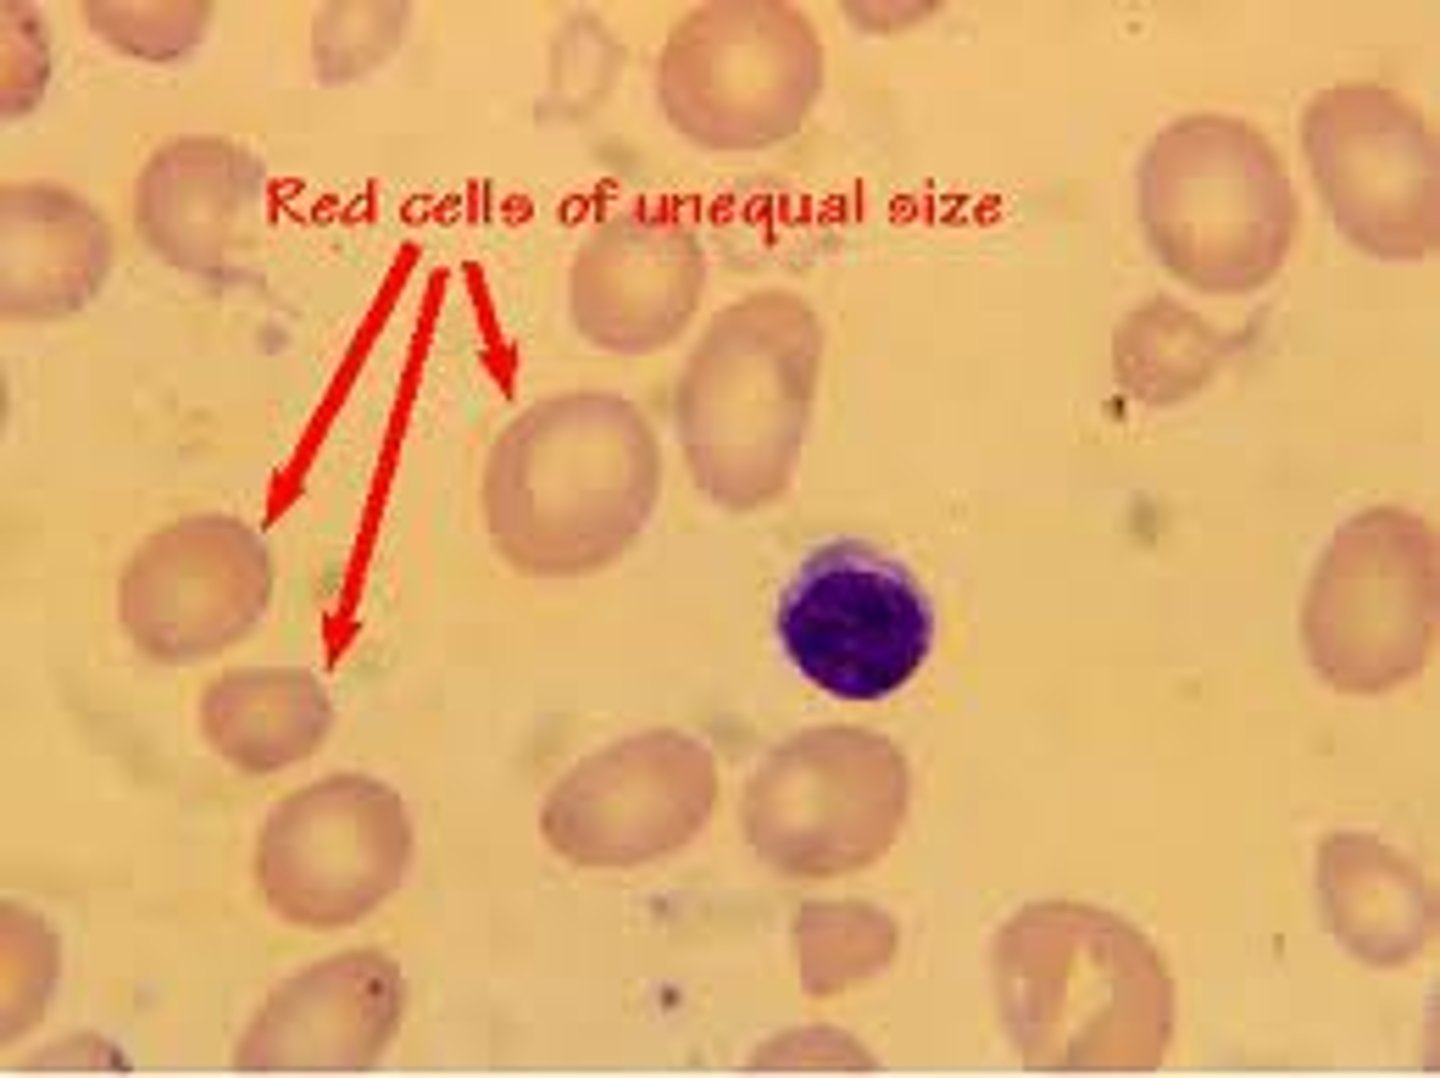
Anisocytosis
lots of variation in cells (RDW>14.5%) → skew MCV values
Reticulocyte count
indicate bone marrow activity and RBC production (esp in anemia)
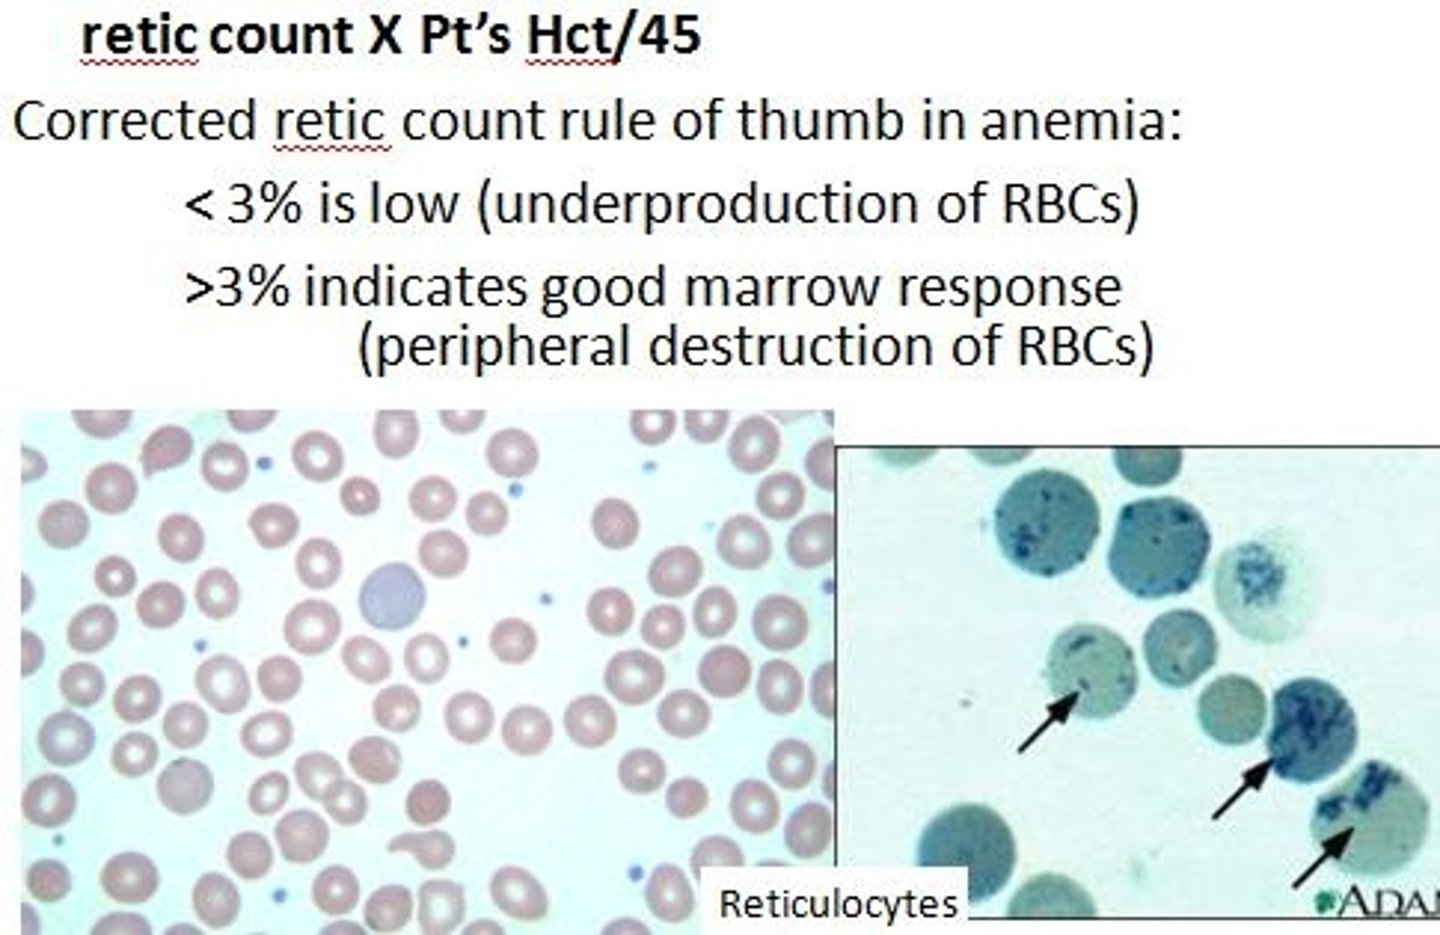
Relative Reticulocyte count RRC
RI = 0.5 - 2.0% [#reticulocytes/#RBCs * 100]
![<p>RI = 0.5 - 2.0% [#reticulocytes/#RBCs * 100]</p>](https://knowt-user-attachments.s3.amazonaws.com/92c7852d-51e3-4dab-986e-5395622b0e33.jpg)
Absolute reticulocyte count
BETTER INDICATOR RI = 25 - 75 mcL [RBC count * RRC(%)/100] higher in anemic patients
![<p>BETTER INDICATOR RI = 25 - 75 mcL [RBC count * RRC(%)/100] higher in anemic patients</p>](https://knowt-user-attachments.s3.amazonaws.com/e28e00b1-92f3-4fdf-b77b-4e616eb9f070.png)
Anemic results
high BM activity and higher # RBCS

Low reticulocyte counts
BM failure, low iron, liver disease
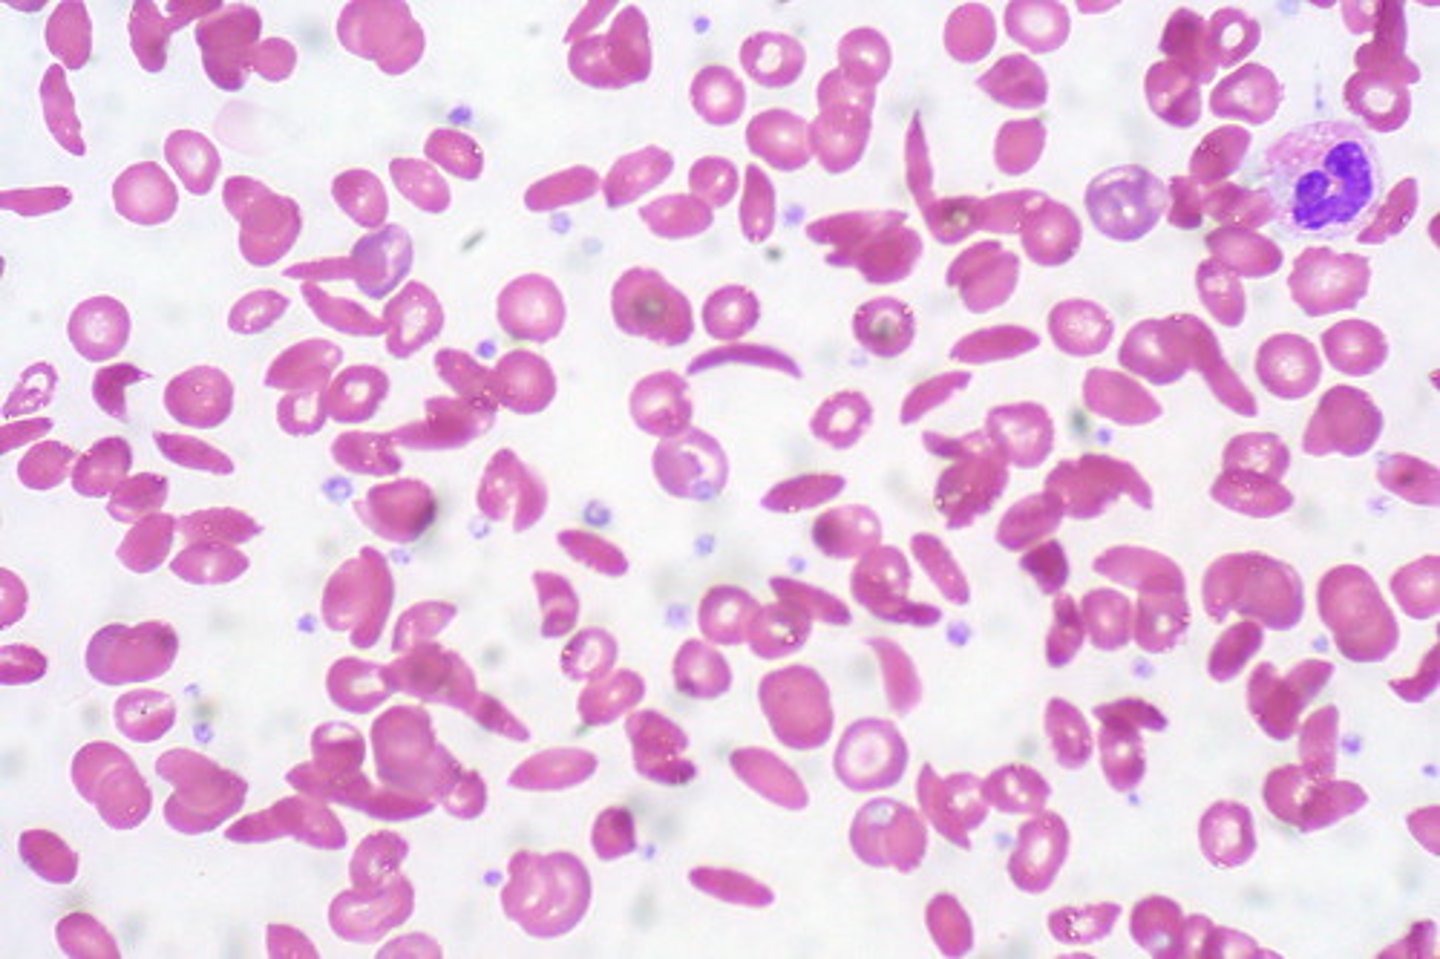
High reticulocytes count
hemolysis, hemorrhage. Leukemia, sickle cell anemia
Platelet count PLT
RI 150 - 400 mcL
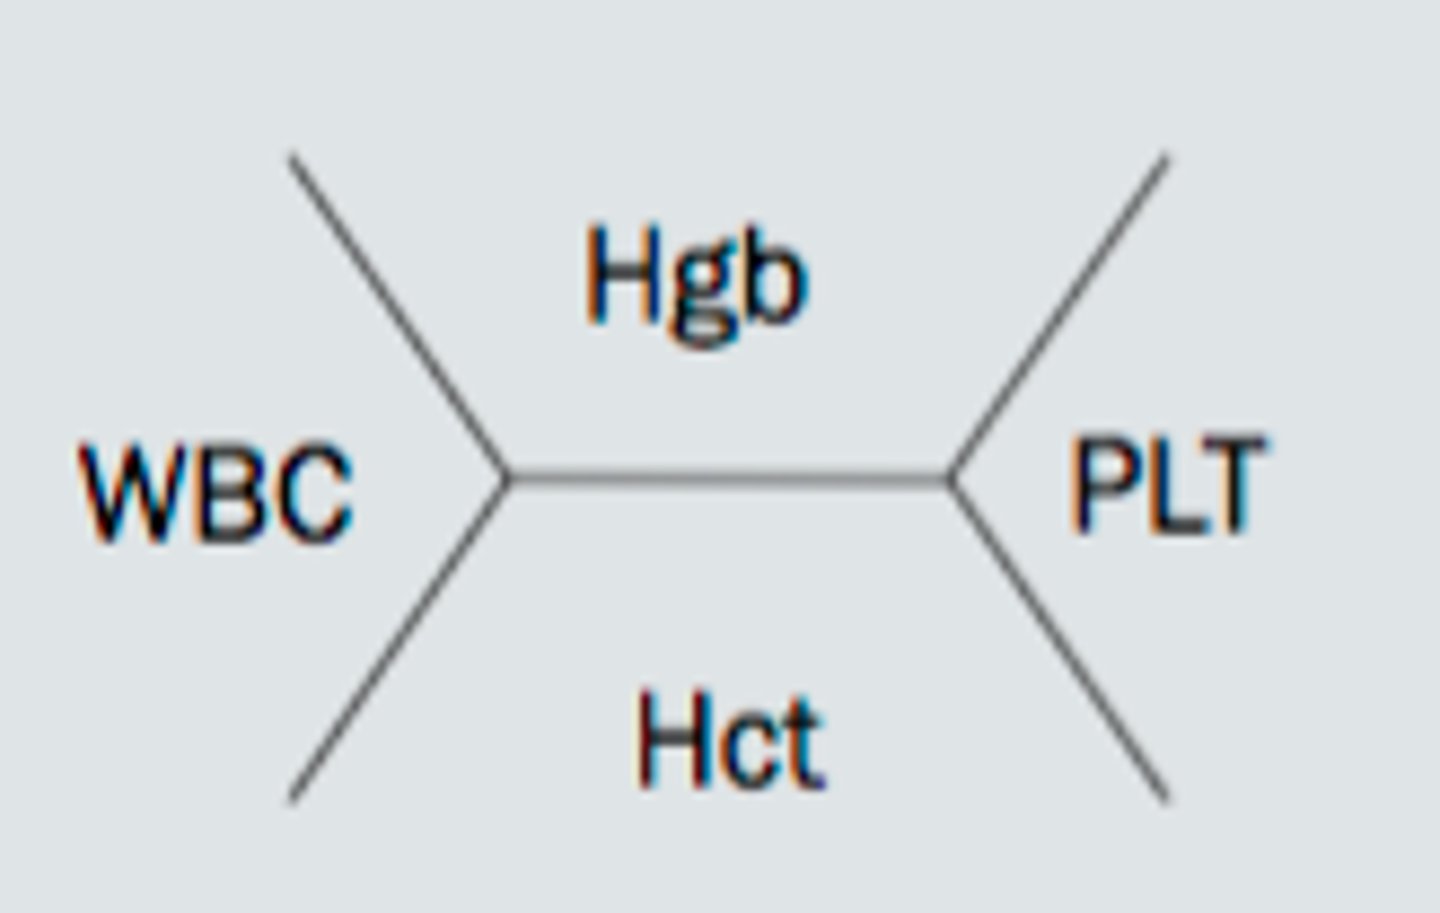
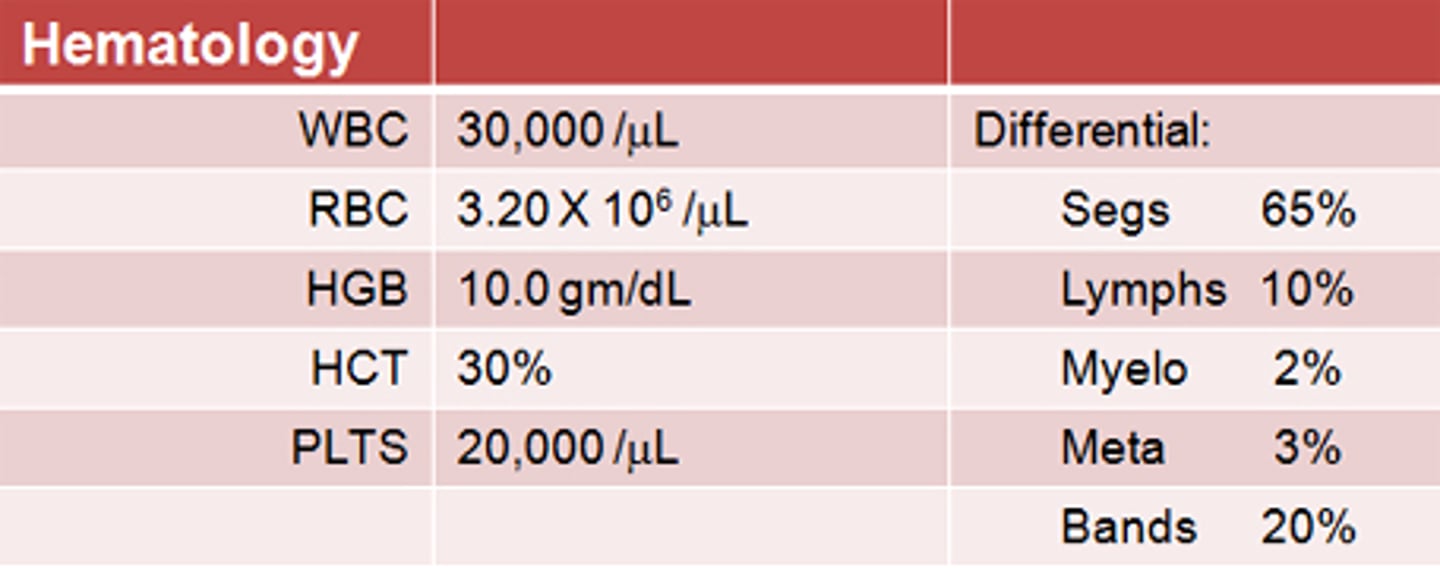
WBC count and differential
RI= 4.5 -11 mcL (total WBC high = leukocytosis, low = leukemia)
Serum Iron
RI = 50 -180 mcg/dL
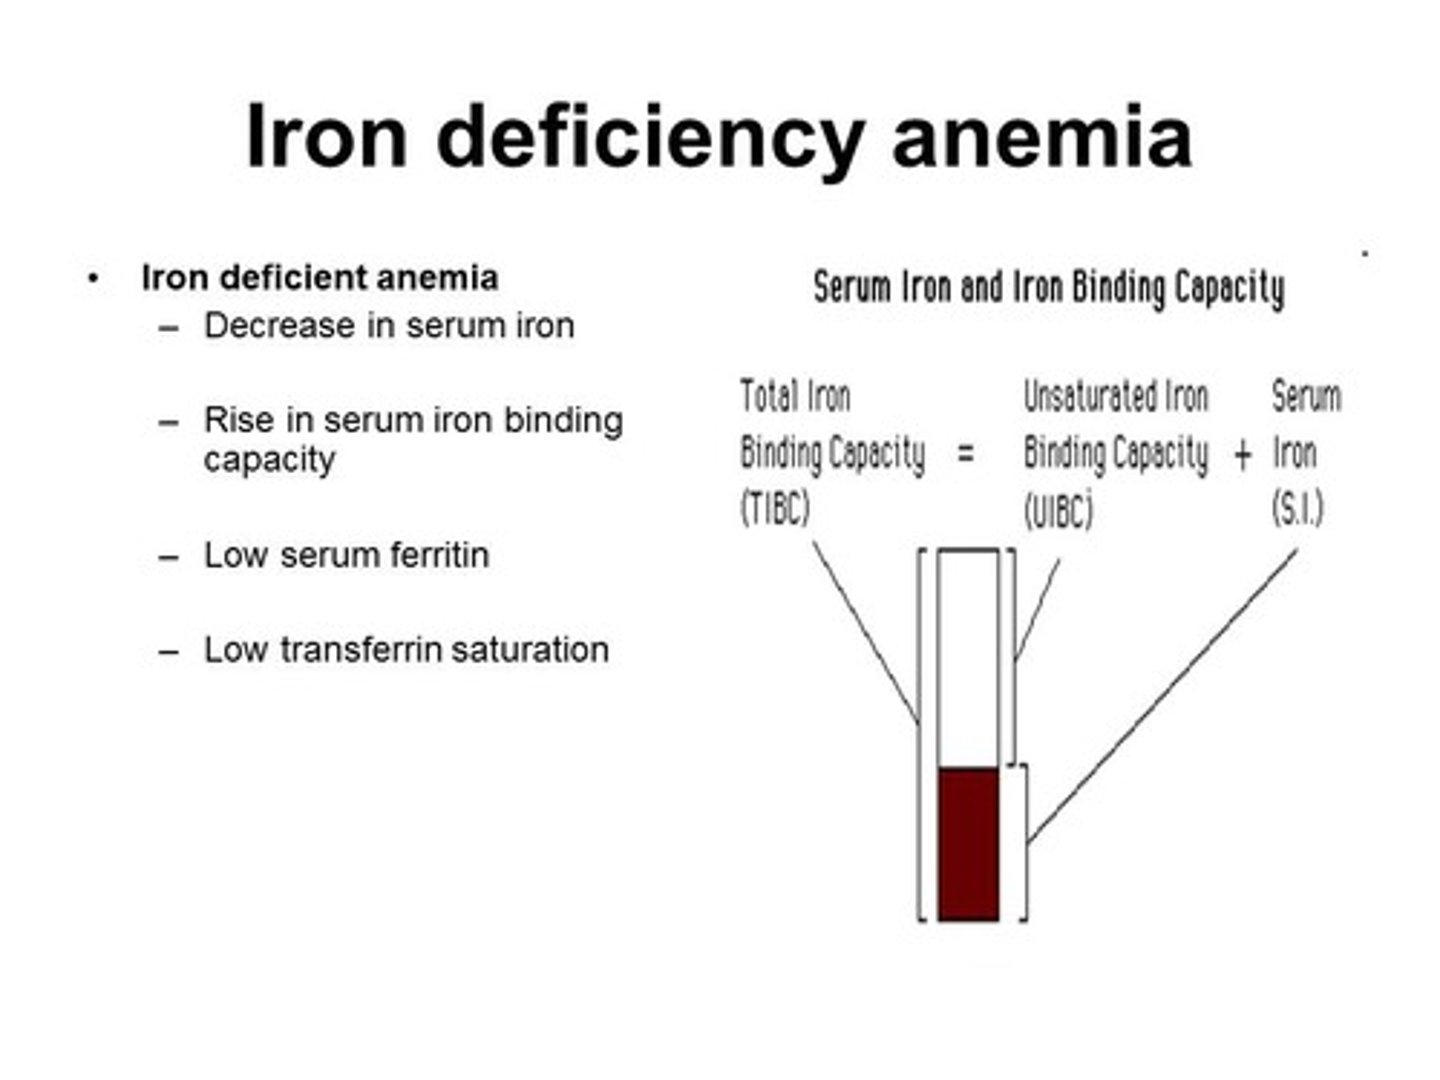
Total iron binding capacity TIBC
RI = 250 - 450 microgram of iron/deciL
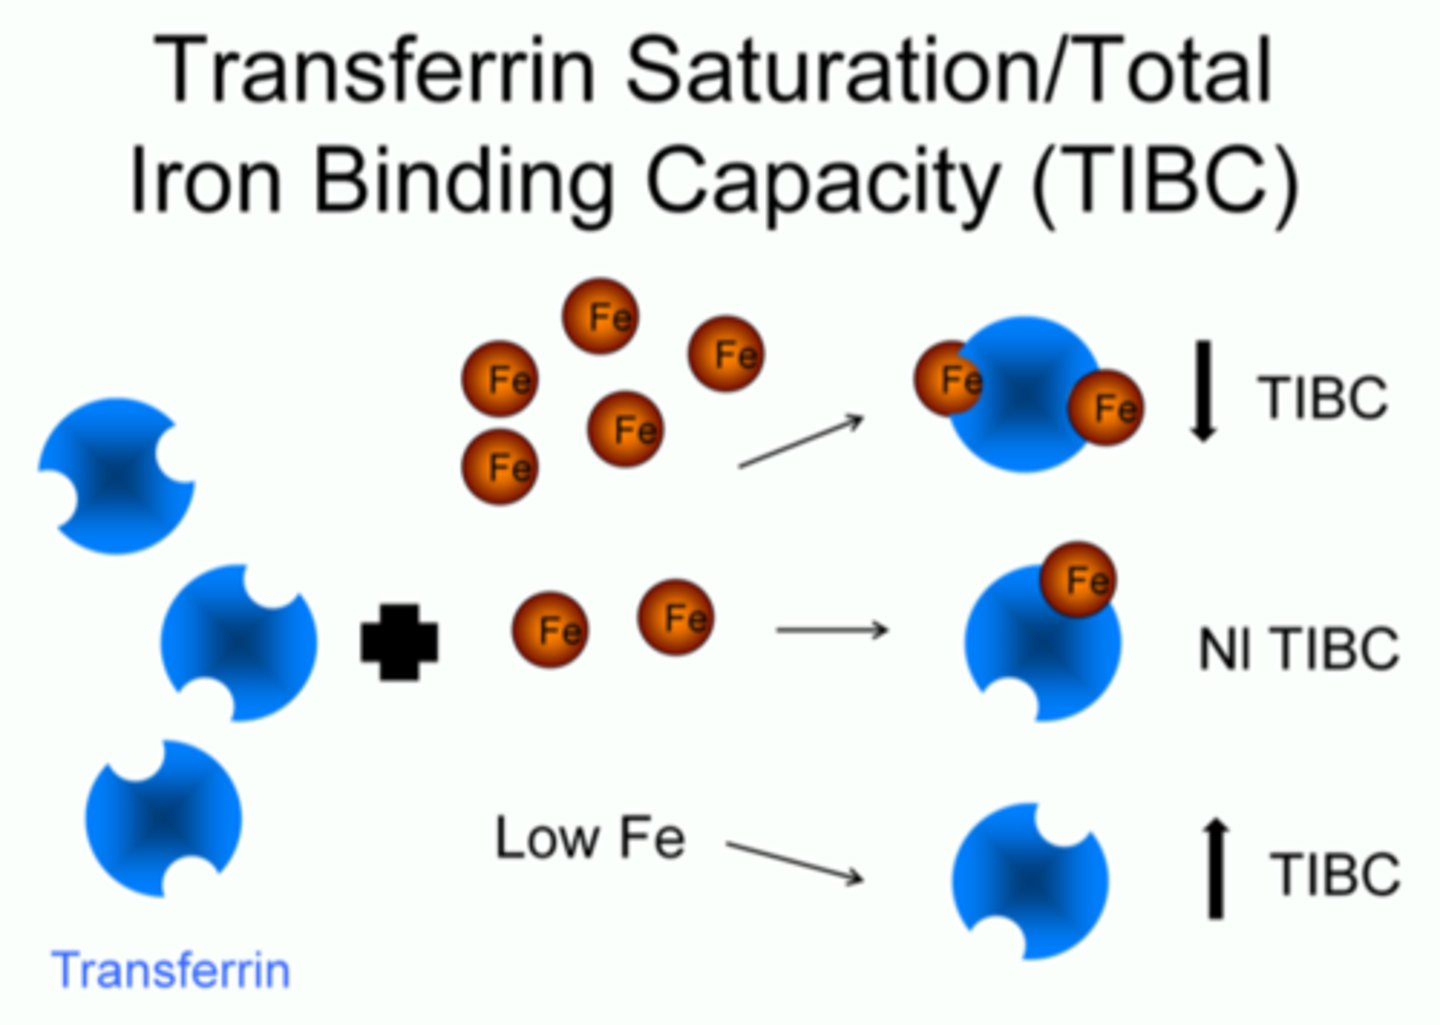
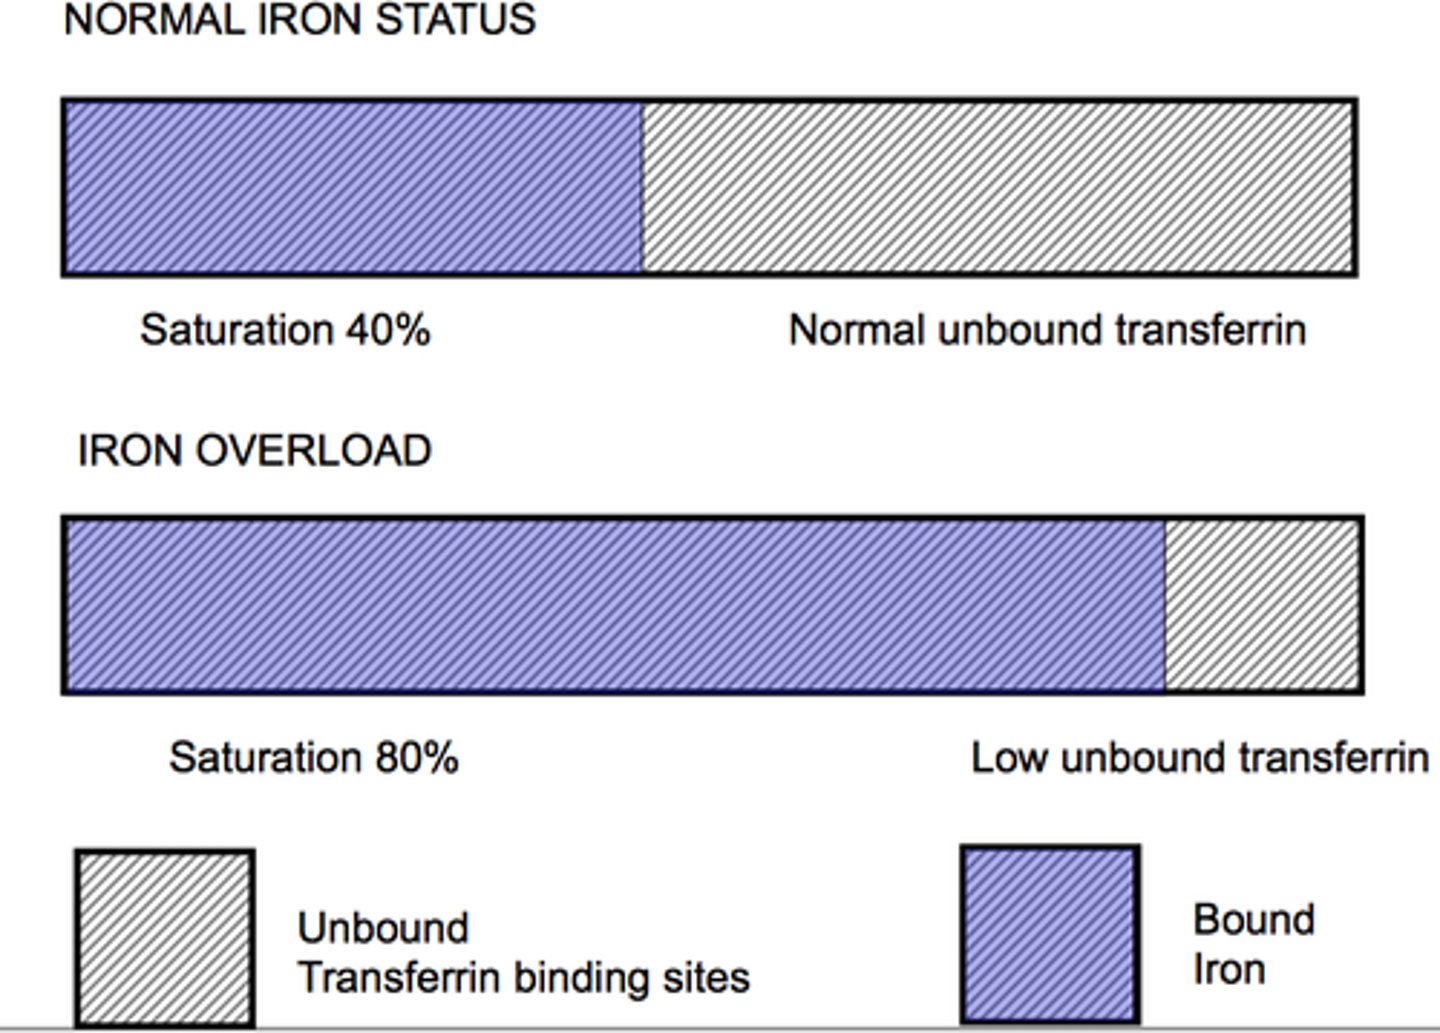
Transferrin saturation
Indicates available iron for erythropoiesis RI = 16-50%
ZPP
absence of iron → zinc is incorporated into the protoporphyrin ring, forming ZPP (RI = 1 - 45 mcg/dL)
Folate
RI = 4-20 mg/L (needed with vitamin b1 to make thymine → dna → THF active form)
Cobalamin
RI = 150 - 400 pg/mL (Cofactor required for DNA synthesis)