Economics U4 AOS 2
 Call Kai
 Learn
Learn Practice Test
 Spaced Repetition
 Match
Match Flashcards
 Knowt Play
1/71

There's no tags or description
Looks like no tags are added yet.
Name | Mastery | Learn | Test | Matching | Spaced | Call with Kai | Chat |
|---|
No analytics yet
Send a link to your students to track their progress
72 Terms
Aggregate supply
Long/formal def
Short/useful def
Aggregate supply is the total volume of all goods and services produced and supplied by a nation over a period of time
Most useful version: AS is about the ability and willingness of firms to produce goods and services
AS policies
Give brief listing on how these policies increase resources/cheaper resources/make firms more efficient
AS policies increase ____
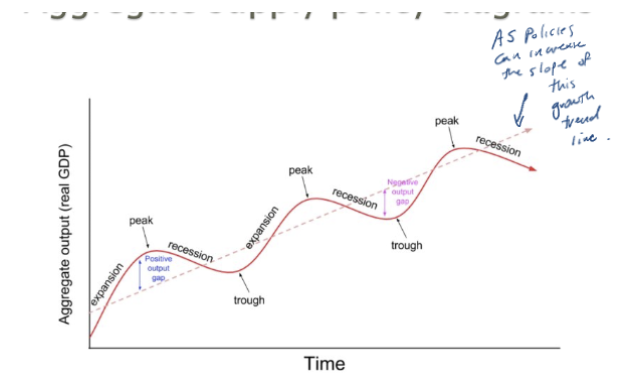
AS policies: government policies designed to increase AS by giving firms more, better or cheaper resources or by making the economy more efficient
Productive capacity

Note
Stagflation - what usually causes it?
Capacity constraints
Supply shock
Stagflation: a period of high inflation but low or negative growth (and unemployment)
Often due to a supply shock --> where increased production costs – increase selling prices (cost inflation) – reduces AD (slow growth)
It occurred in the 1970s in Australia and other countries in part as a result of the supply shock caused by increased oil prices
Capacity constraints are factors that restrict an economy from growing
e.g. skills shortages in the labour force or infrastructure bottlenecks
A supply shock is a short-term supply shock to the economy or a sector of it that causes a sudden decrease in supply of a resource
e.g. sudden increase in the price of oil on world markets or a flood that destroys crops
Compare AD and AS policies:
AD policies are used to reduce fluctuations in the business cycle, however do not affect the long-term average growth rate --> they do not make the economy more efficient + do not increase productive capacity
Whereas AS policies increase efficiency and are used to increase Australia's long-term growth (via increasing productive capacity)
Technical/productive efficiency
ASP can increase this type of efficiency by:
Technical/productive efficiency: achieved when production is operating a lowest long-run average cost and all resources are being used at maximum efficiency
ASP can increase this type of efficiency by:
Spending on infrastructure (e.g. roads, ports) - reduces transport costs for firms --> lowers long-run average cost and resources are used efficiently
Free trade agreements can increase the level of competition faced by domestic firms – forcing them to be more efficient where they would try reduce costs and use resources to efficiently to remain competitive
--> Alos FTAs allow firms gain a larger international market which helps them achieve economies of scale where they can spread fixed costs over more units - which lowers the average costs
Allocative efficiency
ASP increased this type of efficiency by
Allocative efficiency exists when a nation is utilising resources to produce the combination of goods and services that best satisfies society - living standards and welfare are maximised
e.g. ASP increased this type of efficiency by the deregulation of the taxi industry
This allowed the legal operation of Uber and others, allowing idle private vehicles to be utilised commercially --> this increases supply and availability of transport services which gives consumers more choice and lower-cost options
--> this allows resources to be allocated towards producing more of a service which consumers demand and would maximise society's satisfaction/welfare
Dynamic efficiency
ASP can increase this type of efficiency by:
Dynamic efficiency exists when an economy can quickly allocate its resources to achieve allocative efficiency
This occurs by producers being able to quickly respond to changes in consumer demand for different products by reallocating resources to products where demand has increased
ASP can increase this type of efficiency by:
Reduced taxes for firms that invest in research and development --> makes it easier for firms to invest in developing new technologies and product
--> Improved technology makes it easier for firms to switch to producing new products when factors including consumer preferences or supply costs change
Reduced labour regulation – makes it easier to hire and fire workers
--> when demand for a particular product increases, firms can quickly hire workers and shift labour to producing that product
--> while demand falls in a particular industry, firms can fire workers, allowing workers to move to industries where they are more demanded - allowing quicker reallocation of resources
Inter-temporal efficiency
ASP can increase this type of efficiency by
Inter-temporal efficiency exists where there is the optimal allocation of resources between their use for current consumption and investment to increase future consumption
ASP can increase this type of efficiency by:
Carbon tax increases production costs – where firms would be less willing to and able to supply and pass on the higher prices to consumers via higher selling prices --> reduces the consumption/demand of products that produce greenhouse gases (especially if the tax raised is used to subsidise carbon neutral alternatives) - they may shift to cleaner alternatives
--> This helps reduce global warming which reduces environmental damage and protects resources for future generations
Explain/list how AS policies increase/improve these AS factors:
Quantity of resources
Quality of resources
Production costs
Productivity
Quantity of resources
More skilled immigration increases labour resources
Childcare subsidies --> lowers childcare costs, making it more affordable --> allows more parents to enter/return to the workforce, increasing size of the LF
Greater access to gov land increases natural resources
Quality of resources
Training and education programs improve quality of labour by making them more skilled and productive
Subsidies for R&D can help create better capital resources
Production costs
Reducing tariffs on imports reduces costs of resources due to greater access to cheaper resources overseas
Reducing company tax
Productivity
Market reform such as privatising gov firms (the electricity companies) or removing regulations (e.g. taxis) which increase competition – which promotes firms to be more efficient by increasing productivity
Reducing tariffs/entering free trade agreements increases competition and hence productivity as firms would aim to be more efficient in order to compete
AS policies - LIPS
AS policies reduce cost inflation (e.g. via reduction in tariffs, subsidies)
AS policies - SSEG
Increases strong and sustainable growth as they increase productive capacity firms become more efficient produce more which increases real GDP growth
Particularly sustainable growth as shifts the AS curve to the right which both increases real GDP and reduces inflation – it’s growth is based on improved efficiency rather than increased demand (inflation) or CAD (unsustainable foreign debt)
AS policies - FE
Increases PR via policies that make it easier/more attractive for people to enter the workforce (e.g. incentivising older Australians to work via reducing their income tax rate/delaying access to pension)
Increases size of the workforce (e.g. via immigration)
AS policies on skill and training policies which improve workers' skills which increases dynamic efficiency of the workforce and reduces structural UE as workers are better skilled to fill available jobs
--> Note that AS policies may not reduce UE in the short-term
e.g.
When tariffs are reduced, imported cars become cheaper and more competitive.
→ Australian car producers face greater competition
→ Some less-efficient Australian firms may shrink or close
→ Workers in those industries may lose their jobs
→ Unemployment can temporarily increase.
--> However in the long-term they reduce UE as the increased production would result in UE falling
e.g.
Those workers and other resources can move into industries where Australia has a comparative advantage and can produce more efficiently.
Lower tariffs also mean businesses can access cheaper imported inputs and machinery, reducing their production costs.
→ Firms can produce goods and services at lower costs
→ They can expand production
→ More workers are needed → demand for labour increases
International competitiveness
AS policies & international competitiveness
A country's international competitiveness measures how well it can compete in international markets in terms of the price and quality of its goods and services
AS policies improve international competitiveness via improving productivity and lowering production costs
AS policies and LS
MLS
AS policies → higher productivity / lower production costs → increased production → higher real GDP → increased employment and real incomes → greater ability to purchase goods and services → higher material living standards
NMLS
Reduced UE – greater job security, lower financial stress, sense of purpose
Improved productivity and efficiency – access to better healthcare, education, public infrastructure – links to greater life expectancy and happiness
However note that AS policies can also reduce NMLS via increased production which results in greater pollution and increased stress
Investment in infrastructure is what type of gov spending?
Explain how infrastructure investment increases AS via:
→ productivity
→ production costs
→ quantity of resources
Explain how AS policies increase quality of resources
Gov capital spending (G2)
Increase in productivity firms can transport raw materials and finished goods more quickly –where the same truck and driver can make more deliveries in a day, increasing output per hour and therefore productivity.
Lower production costs - lowers freight and delivery costs per unit → firms spend less on fuel and labour because journeys are shorter and more efficient (also energy, communication costs)
Increases quantity of resources → better road networks allow workers to commute from a wider area/further or work at home giving firms access to a larger labour force
Not a roads example but
Increases quality of resources --> newer, faster and more reliable capital resources replace congested or ageing capital (e.g. fibre replacing copper networks enabling firms to use cloud computing which processes data more quickly and supports remote working)
North-east Link Freeway
In the 2024/25 Federal Budget an extra $3.25 billion was committed to the North-East Link freeway which connects the Eastern Freeway to the M80 Ring Road
This will reduce travel to time for businesses moving goods and so reduce both labour and capital costs and increase overall efficiency.
It can also improve the allocation of labour resources to firms as workers will be able to commute further to work at a firm where their productivity and income is maximised.
Quantum Computer
In the 2024/25 Federal Budget $470 million was committed to build in partnership with PSIQuantum the world's first commercially useful quantum computer.
A quantum computer can increase productivity in areas where current computation is unable to solve problems within a reasonable period including improving supply chains (fastest/cheapest ways to move goods), drug development and accurate weather forecasting.
Airport Rail Link
The Victorian and Commonwealth governments are each committing funds towards a rail link to Melbourne Airport – where the 2025-26 Federal Budget allocated $2 billion to upgrade Sunshine Station to support this rail link
This will enable quicker travel between Melbourne and other cities and also reduce congestion on the Tullamarine freeway and so reduce transportation time and costs for business and increase labour and capital productivity
Outline the 3 types of sustainable in SSEG
Sustainable without inflation --> growth that doesn't breach the RBA's 2-3% band
Environmentally sustainable --> e.g. public transport shifts trips out of cars, resulting in less cars on the road and hence less emissions and congestion (this could include the SRL and rail electrification)
Sustainable across generations --> the asset can be used for a long-time where future generations can get the benefit (however if debt-funded, they also have to repay the debt – so make sure to state the trade-off)
Investment in infrastructure on the achievement of LIPS
Short-term:
Adds to AD --> which if already near capacity, raises demand inflation and hence works against the goal
Long-term:
Increases productivity – lowers production costs and hence lowers cost inflation and hence works for the goal
Investment in infrastructure on the achievement of SSEG
Short-term:
Raises real GDP due to increased AD (from G2 injection) - while this can promote strong growth, it is demand-driven and hence not sustainable on its own
Long-term:
Raises productivity and hence growth in GDP + also sustainable as it lowers cost inflation/increases AS
Investment in infrastructure on the achievement of FE
Short-term:
Directly creates construction and engineering jobs
Note that it may draw workers away from other projects (capacity constraint)
Long-term:
Derived demand for labour rises as firms expand (due to reduced production costs and higher productivity where they produce more)--> this lowers structural UE
How infrastructure will help living standards
MLS
Higher productivity raises real GDP
Lower prices for products with high transport content + more housing supply lowers housing costs – increases purchasing power + consumption
Increased jobs and higher real incomes
NMLS
Shorter commutes mean more leisure and family time
Lower emissions and less congestion (due to increases use of public transport and less vehicles on roads) - better air quality
Better and greater access to health, education and services as improved transport can help people access these services quicker and easily + build more schools/hospitals + upgrade existing facilities
However note that when being built, infrastructure can have some cons including:
Construction noise e.g. from machinery, drilling, trucks
Disruption e.g. temporarily blocking roads, traffic congestion
Displacement e.g. some projects may require land that is currently occupied by homes or firms – so some people may need to relocate
Strengths - AS policies
AS policies raise long-run GDP whereas AS policies only reduce fluctuations in the cycle
Achieves both strong growth and low inflation together
Can be targeted at a specific issue, industry or region
Includes positive externalities including lower emissions, safer roads
Politically easier to implement as their benefits are broadly distributed and often do not create a group of people to lose income/faced with a disadvantage unlike some AD policies (e.g. infrastructure benefits firms and households whereas tax increases cause taxpayers to lose disposable income)
Weaknesses - AS policies
Expensive to implement where it is mostly funded by tax (resulting in households having less disposable income to spend, thus lowering AD) or budget deficits (where crowding out can occur which raises interest rates and lowers investment + raises future taxes to decrease deficit)
Long implementation (time for gov to put policy to action --> takes years to plan, approve, construct them)
Long impact lags (time for policy to affect the economy) (e.g. SRL East would not lift AS until 2035)
There's an opportunity cost – where money could have gone to another sector/area
Gov may make decisions based on political interests rather than what's the most efficient for the economy --> leading to government failure where resources are allocated inefficiently as resources may be directed towards a biased industry and not towards their most productive use
Explain what training and education is
How does training and education increase AS
Example
This involves the gov spending on schools, universities, TAFE, apprenticeships and student support
This raises labour productivity and the quality of the labour force as they are more skilled thus lowering production costs and increasing AS
This also reduces structural UE by matching skills to vacancies

Explain what R&D is
How does R&D increase AS
Example
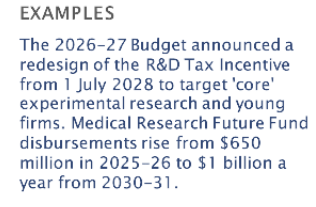
Involves grants (giving money) to universities and research bodies + tax concessions (reduction or exemption in the amount of tax paid) to firms to do their own research
R&D grants encourage firms to invest more in creating new products and more efficient processes which increases capital productivity, dynamic efficiency and productive capacity which increases AS
Subsidies
Explain how it increases AS
Example
T or F? Subsidies always lead to an efficient allocation of resources
Cash payments or other assistance to producers to lower their costs or raise their output
By lowering production costs directly it increases AS
Also childcare subsidies increase the PR, increasing quantity of labour resources and thus AS
Example
The 2025-26 Australian budget allocated $5 billion towards building a universal early childhood education and care system.
Key initiatives include $3.6 billion to for wage increases for up to 200,000 early childhood educators and teachers and $1 billion to create 160 new or expanded services in underserved areas.
This would increase PR as childcare is more affordable for parents allowing them to enter the workforce
False.
Note that subsides can be lead to an inefficient allocation of resources where they help firms that are inefficient or uncompetitive:
For example:
The government gives a car company a subsidy.
The subsidy lowers the firm's costs of production.
This allows the firm to keep producing even if it would otherwise make losses.
Without the subsidy, the firm might have had to improve productivity, reduce costs, or shut down.
Therefore, government money is being used to keep an inefficient firm operating.
This can cause resources to be misallocated because workers, capital and other resources remain in an industry that may not be the most productive use of them.
Does lowering the income tax rate increase AS? Explain why/why not + use an actual example (income tax reduction example)
Lowering the tax rate would increase financial reward from working – households keeping more of each extra dollar earned raises the incentive to work more hours or re-enter the workforce
This would increase labour supply and wage cost pressure on firms ease --> increases AS

Immigration
What percentage of Aus were born overseas
Immigration is the permanent settlement of people from overseas in Australia
Around 32% of Aus were born overseas
Migration Vs Net migration
Migration is the number of people coming into Aus
Net migration is the number of people coming in minus the number of people going out (including both permanent and temporary migrants but not holiday makers)
Permanent Vs Temporary migration
Permanent migration is people coming here to stay permanently/for good
Temporary migration is people on short term work visas who must leave at the end of their visa
Permanent migration is a mixture of what categories?
Also outline what proportion of migration each category takes up
Skilled migration program: involves the immigration of independent migrants who are selected on the basis of their nominated occupation, age, skills, qualifications, English language, employability (make up roughly 2/3rds)
Family migration program: involves the immigration of migrants who are selected based on a relationship to a sponsor in Aus (partners, fiancés, children and parents) (makes up roughly 1/3rd)
Refugee and humanitarian migration program: involves the immigration of migrants who are generally refugees – in which they migrate for safety reasons
In the 2026/27 budget, how many permanent migrants are expected to come and how much of these are skilled migrants?

Note
In addition to immigration, Aus allows people to come and work here on temporary skill in demand visas, allowing them to stay up to 2 (sometimes 4) years
There are also temporary visa for non-skilled workers
New Zealanders can come and live in Aus if they want
What was Aus net overseas migration (NOM) for:
2025/26
2026/27

Explain why migration, particularly skilled migration, would increase productivity
As 2/3rds of permanent migrants are chosen based on having needed skills – they are on average more skilled than existing Aus --> thus they make the LF more productive
Plus they can also teach existing Aus workers skills which can further increase productivity
As they are chosen to fill skill gaps, they fill in jobs that Australians do not have the skills for or which their skills are inadequate – this allows projects to go ahead that otherwise would not and hence make existing Aus more productive
--> This would benefit existing Australians as:
Construction workers can continue working on the project
Workers could eventually work in the new facility (e.g. healthcare workers in a newly built hospital)
Economy produces more products
Explain the problem with an ageing population
An ageing population occurs when the proportion of older people in society increases while the proportion of working-age people decreases
An ageing population means that there will be fewer working age Australians to support the increasing number of elderly people who often require high levels of government spending in areas such as the aged pension; health care and aged care accommodation
Explain how migration increases PR and link to how this helps reduce the effect of Aus ageing population
Immigration tends to increase participation rate (the percentage of population is 15 and above that are in LF) as it adds more people to the LF as many migrants are skilled entering Aus to work
Immigration slows down the rate at which the population is ageing as many migrants are of working age and are average younger than existing Australians (their median age is around 26 years compared to 38 years for existing Australians) which increases the proportion of working-age people
Immigration helps reduce the effects of an ageing population by increasing ratio of workers to retirees
--> more tax being paid which makes the gov more able to fund benefits and services to retirees including the aged pension, health expenses and aged care
--> this helps prevent the budget from producing ever increasing deficits
Explain how migration increasing the population increases AS
Where in addition to adding to labour resources, this increases the domestic market of consumers, allowing firms to operate at a larger more efficient scale (gaining economies of scale) which reduce their average costs of production, thereby increasing aggregate supply.
How does migration affect real wage growth?
Immigration reduces real wage growth in the short-term because:
Immigration increases supply of labour – reduces upward pressure on wages as firms don't need to raise wages as much to hire workers, hiring workers is more easy
Immigration increases real wage growth in long-term because:
It increases productivity – skilled migrants fill skill shortages + remove bottlenecks --> helping firms to expand and increase output where firms earn more revenue and can afford to pay higher wages as workers are more valuable
Immigration and SSEG
Immigration makes easier to achieve SSEG as it increases AS which increases GDP growth
However immigration without adequate investment in infrastructure and increased housing may become unsustainable from an environmental perspective as it increases congestion and increases housing costs
Immigration and LASI/LIPS
While immigration adds to AD – as it largely consists of skilled migration, it's supply side benefits typically outweigh the increase in demand thus reducing demand inflation (as increased AS reduces the likelihood of AD outstripping AS)
It also reduces cost inflation by increasing productivity and hence lowers production costs
Immigration and FE
Immigration will tend to reduce UE in long-run as increases AS, increasing derived demand for labour + migrants also add to AD which further increases production and derived demand for labour
Immigration & international competitiveness
Immigration improves international competitiveness as it increases productivity and lowers production costs – increasing AS and lowering the price of exports
It also makes Aus more integrated into global community, making trade easier
Trade liberalisation
Trade liberalisation is about removing protection for Australian businesses from foreign competition by reducing tariffs, subsidies, quotas and regulatory barriers to trade/promoting free trade
It has been the policy of Australian governments for the past 40 years
Note that 'free trade' agreements reduce trade barriers but do not eliminate them
Protectionism
The opposite of free trade is protectionism - policy of governments to protect local businesses from international competition by methods such as:
Imposing tariffs – taxes imposed on imports
Restrictive quotas on imports – which are limits on the quantity of a particular product entering the country (e.g. US, China and EU have quotas on Aus beef)
Providing subsidies to local businesses – which are assistance by gov to local firms via direct payments, tax reductions etc
Imposing regulations that make importing more difficult (e.g. labelling laws on goods which increases compliance costs)
Explain how trade liberalisation has affected Aus economy (hint: statistics)
Aus governments have pursued policies of trade liberalisation since 1980s, where:
Average tariffs imposed by Aus fell from 36% in the 1960s to 3% today
Some tariffs dropped even more (e.g. motor vehicles from 57% to 5%)
It has been calculated that the reduced tariffs between 1986 and 2016 have added 5.4% to Aus real GDP
The reduction in tariffs over the last 40 years in Aus has driven many firms out of existence as they were unable to compete, including:
In 1980, there were 4 car manufacturers in Aus (Holden, Ford, Mitsubishi and Toyota) - now there are none
Many clothing manufacturers have gone out of business or moved their production to other nations
However trade liberalisation has made Aus more internationally competitive and helped increase our GDP growth
Explain the negative effects of protectionism
Protection makes local firms less competitive as they face less pressure to improve and hence becomes less efficient and innovative
Over time, overseas producers often become more efficient and lower their costs – where even with tariffs, foreign products may still be attractive where Aus firms would demand even higher tariffs for protection
Tariffs increase production costs where some imported goods (e.g. vehicles) become more expensive --> hence resulting in higher prices on consumers
Other nations may retaliate where they impose tariffs on Aus exports – which reduces the sales of Aus products overseas and hence can damage export industries (e.g. agriculture, mining)
TL and technical efficiency
More competition results in firms having to be more efficient where they increase productivity and use all resources to maximum efficiency
Access to cheaper imported inputs reduces production costs
TL and allocative efficiency
Aus imports products that other nations produce relatively cheaper or more efficiently
Aus firms shift resources towards industries where Aus has a comparative advantage so produce more value
Comparative advantage: refers to producing products where their opportunity cost is lowest
Increases output
Less waste + more efficient resource allocation
Lower prices for firms and consumers
Trade liberalisation and international competitiveness
It helps improve international competitiveness as:
It forces Aus firms to compete with other nations –-> and so increases technical efficiency where they reduce prices and/or improve quality
It encourages firms to focus on their areas of comparative advantage where they can be more efficient and out-compete international firms – improving allocative efficiency
Reduces costs for Aus firms who rely on foreign imports of capital goods and intermediate goods
It helps firms gain access to foreign markets and so allows them to achieve economies of scale – resulting in cheaper products
TL & SSEG
ncourages technical and allocative efficiency thus increasing AS, allowing non-inflationary growth
Reduces costs of imported inputs, reducing production costs and thus increases AS
Firms may increase investment to improve technology and capital in order to improve productivity and be more competitive – increases AD
Makes it easier to export to other nations – increases net exports and hence AD
CHAT SSEG – allocative efficiency and comparative advantage answer
Trade liberalisation can contribute to SSEG by allowing countries to specialise in areas in which they have a comparative advantage. This enables resources to be allocated towards industries where they can be used most efficiently, increasing allocative efficiency. Greater allocative efficiency can increase productivity as resources are directed towards their most productive uses. Higher productivity increases the economy's productive capacity, shifting aggregate supply (AS) to the right. This allows the economy to produce a greater quantity of goods and services, increasing real GDP and therefore contributing to stronger economic growth.
TL & FE
By encouraging growth it creates more demand for labour (however it is possible to have 'jobless growth' where growth id driven by becoming more capital intensive)
TL can cause short term structural UE due to firms being unable to compete against international firms and hence close down
TL & LIPS
By increasing technical and allocative efficiency and so AS – it reduces the risk of demand inflation (as decreased likelihood of AD outstripping AS)
Reduces cost inflation due to access to cheaper capital imports and intermediate imports
By reducing the cost of consumer imports it directly lowers inflation
TL & Living standards
MLS
Increases growth in real GDP via higher productivity & lower production costs (however not for all for instance people experiencing structural UE)
NMLS
In response to higher MLS, people may experience higher levels of happiness, consumption of goods and services, etc
However an argument against higher NMLS is that many firms may move production (offshore) to nations with less strict environmental regulations as production costs are cheaper – leading to greater pollution and environmental degradation, lowering NMLS
Bad things about TL
In short-term, it can cause structural UE in industries that cannot compete with overseas firms
Result in some industries going offshore where things can be made cheaper as they have looser environmental standards --> this can lead to Aus workers losing their jobs + lead to more pollution/waste/environmental damage
TL can make nations more dependent on other nations for products and materials – this can become a problem if there is a supply chain disruption (e.g. ware, pandemics, political instability)
e.g.
During COVID, international transport was disrupted where many nations relied heavily on imports including medical equipment, masks, vaccines
Fertiliser and AdBlue --> where disruptions to this supply due to gulf war has increased production costs and hence lower AS and higher selling prices
Global warming/climate change + effects
How are its changes expected to affect GDP growth?
Global warming/climate change refers to the average increase in temperatures and other climate changes caused by the increase of CO2 and other greenhouse gases in the atmosphere as a result of human activity
e.g. burning fossil fuels
It has several effects including:
Rising sea levels
Higher temperatures
More extreme weather events (e.g. droughts, floods, storms, bushfires)
These changes are expected to reduce GDP by between 2-10% from what it otherwise have been (note this does not mean that it is less than the present GDP, it would still be higher (most likely) but less than expected/been)
The different ways in which climate change limits growth
Extreme weather events 🌊🔥(e.g. floods, bushfires, storms)
→ damage/destroy factories, farms and infrastructure – reduces capital resources
→ productive capacity ↓
→ AS ↓ → real GDP ↓
Higher temperatures ☀
→ workers become less productive, especially in outdoor industries
→ productivity ↓
→ AS ↓ → real GDP ↓
Droughts / changing rainfall 🌾
→ less water and lower agricultural production
→ supply of goods ↓
→ AS ↓ → real GDP ↓
Higher production costs 💰
→ businesses face higher costs for cooling, insurance, repairs from damage of resources
→ AS ↓ → real GDP ↓
Carbon tax
How does this reduce # of emissions
Carbon tax is a tax that is applied to firms based on the amount of greenhouse gases they emit
This increases the production costs for activities associated with emissions and so should increase the price and reduce the quantity of emission producing products --> hence the quantity demanded of these products contract
Firms are then encouraged to adopt cleaner technologies and production methods to lower production costs, thus lowering emissions
Subsidies (in relation to GH gases) and how they help reduce emissions
Subsidies can be paid:
To firms in return for reducing their emissions or
Firms producing or consumers buying zero or low emission products (e.g. solar panels or electricity via wind farms)
Firms that reduce net emissions (e.g. by planting trees)
Emissions trading scheme - describe it
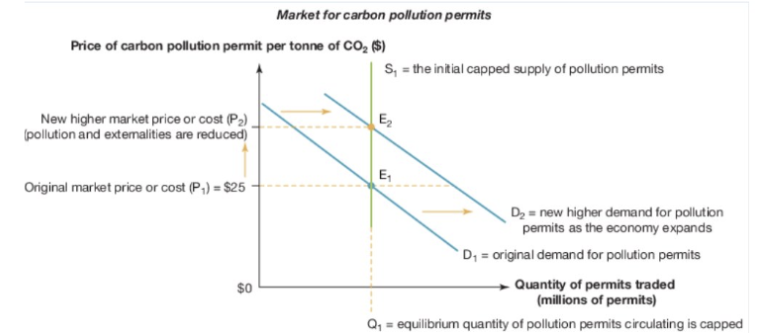
Under an Emissions Trading Scheme (ETS) the gov sets a cap on the total amount of GG that can be emitted and issues tradeable permits to firms in total equalling that cap
--> note that firms must have permits to cover all emissions and if emits less than the permits it holds it can sell some of its permits to other firms
The amount of greenhouse gases allowed to be emitted would reduce every year
This method allows the forces of the market to decide where the most important place in the economy to allow emissions is
--> where if a firm can easily reduce emissions, it has an incentive to do so as it can then sell its permits
--> If it really hard to reduce emissions and what you do is very valuable (e.g. flights) you can buy permits
This results in the effect in which:
Emissions go to places where they are the most valuable – where cuts in emissions are done where it is the cheapest
Draw a supply/demand graph for the carbon pollution permits
Strengths of an ETS
Reduces emissions at the lowest cost
Firms have different costs of reducing emissions.
An ETS allows firms to buy and sell emissions permits.
Firms that can reduce emissions cheaply will reduce more and sell their extra permits.
Firms that find it expensive to reduce emissions can buy permits.
Therefore, emissions are reduced at the lowest possible cost
→ minimises the increase in production costs and hence increase AS and GDP
e.g.
Example
Suppose the government wants 10 tonnes of emissions reduced.
Firm A can reduce 1 tonne for $10
Firm B can reduce 1 tonne for $100
If both firms were forced to reduce 5 tonnes each:
Firm A: 5 × $10 = $50
Firm B: 5 × $100 = $500
Total cost = $550
But under an ETS, Firm A can reduce more because it is cheaper for them.
For example:
Firm A reduces 8 tonnes → $80
Firm B reduces 2 tonnes → $200
Total cost = $280
So the same 10-tonne reduction is achieved for $280 instead of $550.
2. Certainty over the amount of emissions reduced
Government sets a maximum level (cap) of total emissions - issues a limited number of emissions permits.
Therefore, the government knows how much total emissions can occur.
→ certainty over the quantity of emissions reduction.
In contrast, a carbon tax provides certainty over the price of emitting but not the exact quantity of emissions that will be reduced
Weaknesses of an ETS
Complicated and prone to fraud
--> An ETS requires the government to accurately measure and monitor firms' emissions and regulate the trading of permits -This can be complex and costly, and firms may under-report emissions or manipulate permits to reduce their costs
ETS impact on AS and LS
Short-term:
Will reduce AS – as it would increase production costs for firms due to buying permits and investing in cleaner technologies --> make them less willing to and able to supply
Reduce LS – due to higher selling prices + emissions aren't automatically reduced as of yet
Long-term:
If an ETS is properly run (and if other nations reduce their emissions too) it increases AS as it would lower amount of emissions, limiting climate change that would increase cost of production
It should also improve LS as it increases GDP (by limiting emissions and preserving natural resources) and NMLS (better environment)
Impact of an ETS on intertemporal efficiency
An ETS improves intertemporal efficiency by:
Encouraging businesses to reduce emissions and adopt more sustainable production methods
As the number of permits available decreases each year, overall emissions are gradually reduced, helping to protect environmental quality and ensuring that current economic growth does not come at the expense of future generations' living standards