Lecture 6 Loan portfolio risk and liquidity risk
1/36
There's no tags or description
Looks like no tags are added yet.
Name | Mastery | Learn | Test | Matching | Spaced | Call with Kai |
|---|
No analytics yet
Send a link to your students to track their progress
37 Terms
How do loan portfolio risk differ from individual loan risk
Loan portfolio risks refer to the risks of a portfolio of loans as opposed to the risks of a single loan
Simple model: Migration Analysis
Track credit ratings of firms in a particular sector or ratings class for unusual declines
Loan Migration Matrix
Reflects historic credit rating experience of a pool of loans and serves as a measure of the probability of the loan being upgraded, downgraded, or defaulting over some specified period.
What’s a disadvantage of migration analysis
Information may be received too late, making it obsolete.
Loan Concentration
Management sets external limit on maximum amount of loans to
be made to individual borrower, sector, or geographical area (that
is, concentration limits)
How to calculate CL
CL = (max loss as % of capital)*(1/loss rate)
Diversification and Modern Portfolio Theory (MPT)
Using MPT allows FIs to diversify sizeable amounts of credit risk exposure by taking advantage of their size.
Returns of assets within the portfolio must be imperfectly correlated with regards to their default risk adjusted returns
Minimum risk Portfolio
Combination of assets that reduces portfolio risk to lowest feasible level
Expected Return formula
Rp = X1R1 + X2R2
Variance Formula
Variance = (X1² varaicne1²) + (X2² * variacne2² ) + (2X1X2Varaicne1&2)

What does low correlation of returns(P) mean
low correlation of returns(P) results in an overall reduction of risk when loans are put together in an FI’s portfolio
Why are small banks not able to diversify their assets
Small banks may not be able to diversify their assets, especially if the markets they serve have a limited number of industries.
The ability to diversify is even more acute if these loans cannot be traded easily.
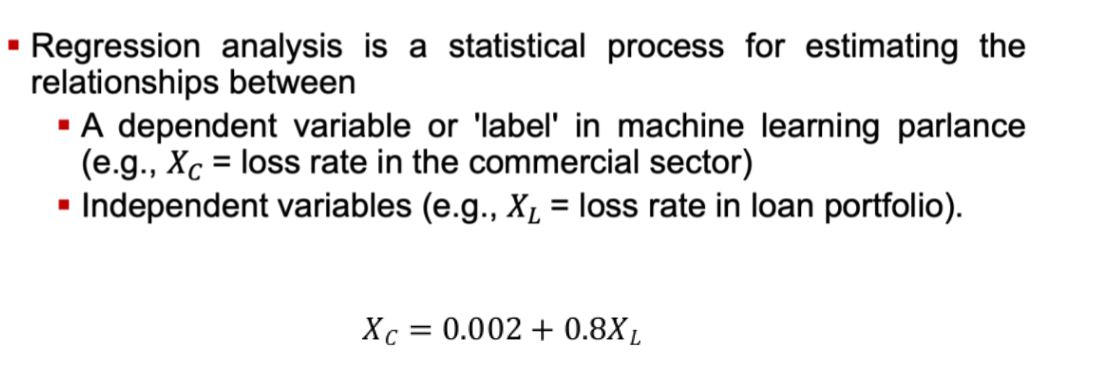
What is regression based models and what are they used for
Statistical process for estimating the relationship a dependent variable and independent variable
Regression analysis is widely used for prediction, where its use overlaps with Machine learning
What is liquidity risk
Risk that a sudden surge in liability withdrawals may leave an FI in a position of having to liquidate assets in a very short period of time and at low prices.
May generate runs.
Runs may turn a liquidity problem into a solvency problem
asset side liquidity risk
Occurs when borrowers make loan requests, exercise loan commitments, and access other credit lines
Liability side liquidity risk
Occurs when depositors or policyholders cash in claims
If low cash holdings, FI may be force to liquidate assets quickly, leading to fire sale prices
Responses to liquidity demands
Liquidity requirements can be met by FI:
Running down cash
Selling liquid assets
Additional borrowing
High exposure to liquidity risk
Depository institutions.
Loss of confidence in bank-to-bank lending during financial crisis resulted in more widespread liquidity risk
Liability-Side Liquidity Risk for DIs
Reliance on demand deposits.
Depository institutions need to be able to predict the probability distribution of net deposit drains.
Calculated as the difference between deposit withdrawals and deposit additions.
Seasonality effects in net withdrawal patterns (for example, end of year and summer due to holidays and vacations).
Managing drain on deposits:
Purchased liquidity management.
Stored liquidity management.
Purchase liquidity management
Sources of purchased liquidity:
Interbank markets for short-term loans
Federal funds market
Repurchase agreement markets
Issuing additional certificates of deposit, more expensive options
Market level interest rates are expensive relative to low interest rates on deposits
Stored liquidity Management
Liquidate Assets to meet withdrawals
In addition to reserve requirements set by the Federal Reserve,
DIs tend to hold excess reserves.
Downsides of holding excess reserves:
Contraction of asset size.
Requires holding excess low-rate assets.
High opportunity cost of holding cash and other liquid assets
Asset side liquidity risk for DIs
Liquidity risk from loan commitments and other credit lines.
Met either by borrowing funds and/or by using cash assets.
Levels of loan commitments are high.
Commercial banks have been increasing commitments over the past few years, presumably believing commitments will stay unused.
Unused loan commitments to cash grew from 529.4% in 1994 to 1K% in 2008 before dropping to 608.6% during the financial crisis
Investment portfolio and asset side liquidity risk
Interest rate risk and market risk of the investment portfolio can
cause values to fluctuate significantly.
Suppose interest rates up, portfolio value declines, many want to sell, liquidity dries up, only can get fire sale prices
Arguments that technological improvements have led to improve liquidity of financial markets.
But herd behavior makes things worse.
What are the 3 ways to measure liqudity risk
Financing gap
Peer group ratio comparisons
Liquidity index
Financing Gap formula
FG = Avg loans - Avg deposits (If positive then can use cash and liquid assets or borrowing)
or
FG = -Liquid assets + borrowed funds
FG + Liquid assets = financing requirement (Borrowed funds)
Larger FG means larger financing requirements, meaning more exposure to liquidity risk and can warn of future liquidity problems
Peer group ratio comparisons
Compare:
Loans to deposits.
Loans to assets.
Unused commitments to assets ratios.
A high ratio of loans to deposits may indicate a heavy reliance of the short-term money market, resulting in future liquidity problems.
Liquidity index
Weighted sum of fire sale price, P, to fair market price, P*
Portfolio weights are the percent of the portfolio value formed by individual assets
Measure of potential losses an FI could suffer as the result of a fire sale disposal of assets (Between 0 and 1)
Measuring liquidity risk: BIS Changes
Post financial crisis, Bank for International Settlements (BIS)
develops new metrics to measure DI liquidity risk
Liquidity Coverage Ratio
Net Stable Funding Ratio
Liquidity coverage ratio
(Stock of high-quality liquid assets)/(Total net cash outflows over
the next 30 calendar days) ≥ 100%.
Ensure DI has enough high-quality liquid assets
Reported to DI supervisors monthly
Net stable funding ratio (NSFR)
(Available amount of stable funding)/(Required amount of stable
funding) > 100%.
Longer term look at liquidity position over next year
Liquidity Planning
Planning is a key component of measuring and coping with liquidity risk and associated costs.
Make funding decisions before liquidity problems arise.
Lower the cost of funds by identifying an optimal funding mix.
Minimize the need for excess reserve holdings.
Delineate managerial responsibilities.
Identify who responds to regulatory agencies, who discloses information to the public, etc.
Detailed list of funds providers, important to anticipate the expected pattern of withdrawals in a crisis.
Identify size of potential deposit and fund withdrawals over various future time horizons.
Set internal limits on subsidiaries and branches borrowings and boundaries on risk premiums
Plan the sequence of asset disposal to meet liqudity needs
How do bank runs arise
Can arise due to concern about:
Bank solvency.
Failure of a related FI.
Sudden changes in investor preferences.
Bank runs
Demand deposits are first come first serve
Can cause bank panic: Systemic or contagious bank run on deposits of banking industry
How to alleviate bank runs
Measures to reduce likelihood of bank runs:
Deposit insurance and discount window.
FDIC.
Direct actions, such as TARP (2008 to 2009).
Not without economic costs.
Protection may encourage DIs to increase liquidity risk
Liquidity risk: Life insurance companies
Life insurance companies hold reserves as a buffer to offset policy cancellations (surrenders) and other working capital needs.
Pattern is normally predictable.
Solvency concerns can still generate runs on life insurance companies.
State guaranty schemes deter runs on life insurance companies.
Liquidity risk: Property - Casualty Insurers
Assets tend to be shorter term and more liquid than life insurers.
Claims are virtually impossible to predict.
Hurricane Andrew and Hurricane Katrina precipitated severe liquidity crises for many PC insurers.
Liquidity risk: Property - Investment Funds
Investment funds can sell shares as liabilities and invest proceeds in assets such as bonds and equities.
Closed-end funds issue a fixed number of shares as liabilities.
Open-end funds sell an elastic number of shares to investors
Mutual funds and hedge funds
Risk of runs is less than that faced by banks
Asset losses will be shared on a pro rata basis
But money market mutual funds (MMMFs) face significant liquidity risk at beginning of the crisis