3.4 Economies and Diseconomies of scale
1/14
There's no tags or description
Looks like no tags are added yet.
Name | Mastery | Learn | Test | Matching | Spaced | Call with Kai |
|---|
No analytics yet
Send a link to your students to track their progress
15 Terms
Economies of scale
As falling long-run average costs of production that result from an increase in the size or scale of the firm.
Diseconomies of scale
occur when an increase in output leads to rising long-run average costs of production
Internal economies of scale
These occur when a firm becomes larger. Average costs of production fall as output increases.
Risk-Bearing
When a firm becomes larger, they can expand their production range. Therefore, they can spread the cost of uncertainty. If one part is not successful, they have other parts to fall back on
Financial
Banks are willing to lend loans more cheaply to larger firms, because they are deemed less risky. Therefore, larger firms can take advantage of cheaper credit.
Managerial
Larger firms are more able to specialise and divide their labour. They can employ specialist managers and supervisors, which lowers average costs.
Technological
Larger firms can afford to invest in more advanced and productive machinery and capital, which will lower their average costs.
Marketing
Larger firms can divide their marketing budgets across larger outputs, so the average cost of advertising per unit is less than that of a smaller firm
Purchasing
Larger firms can bulk-buy, which means each unit will cost them less. For example, supermarkets have more buying power from farmers than corner shops, so they can negotiate better deals.
Network economies of scale
These are gained from the expansion of ecommerce. Large online shops, such as eBay, can add extra goods and customers at a very low cost, but the revenue gained from this will be significantly larger.
External economies of scale
occur when a firm’s average or unit costs of production fall, not because of the growth of the firm itself, but because of the growth of the industry or market of which the firm is a part. Very often, external economies of scale are produced by cluster effects, which occur when a lot of firms in the same industry are located close to each other, providing markets, sources of supply and a pool of trained labour for each other.
Diseconomies of scale
These occur when output passes a certain point and average costs start to increase per unit of output produced.
Examples include:
Managerial diseconomies of scale
As firms grow, Delegation of some of the managerial function to people lower in the organisation may mean that personnel who lack appropriate experience make bad decisions. This may increase average cost of production.
Communication failure
In a larger organisation there may be too many layers of management between the top managers and ordinary production workers, and staff can feel remote and unappreciated. When staff productivity begins to fall, unit costs begin to rise. As a result, the problems facing the business are not effectively addressed.
Motivational diseconomies of scale
With larger firms, it is often difficult to satisfy and motivate workers. Over-specialisation may lead to de-skilling and to a situation in which workers perform repetitive boring tasks and have little incentive to use personal initiative in ways which help their employer.
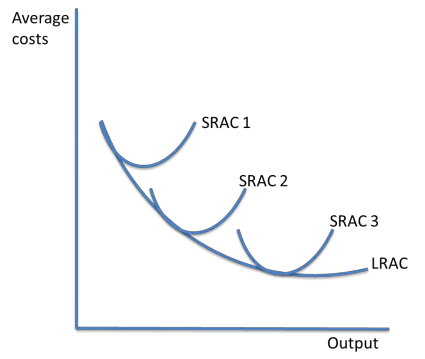
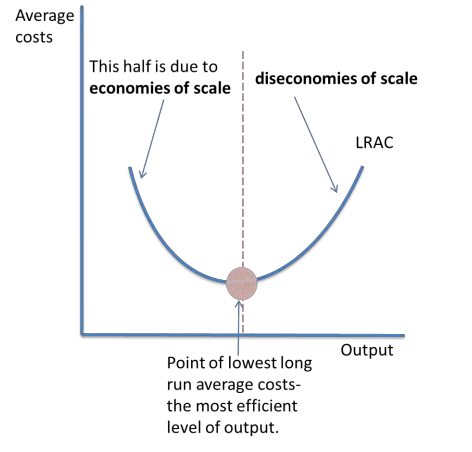
Long run average cost curve:
Initially, average cost falls, since firms can take advantage of economies of scale.
This means average costs are falling as output increases.
After the optimum level of output, where average costs are at their lowest, average costs rise due to diseconomies of scale.
The point of lowest LRAC is the minimum efficient scale. This is where the optimum level of output is since costs are lowest, and the economies of scale of production have been fully utilised
The relationship between returns to scale and economies or diseconomies of scale.
Returns to scale increases when the output increases by a greater proportion to the increase in inputs. For example, if inputs double, and outputs quadruples, there is said to be increasing returns to scale. This occurs where there are economies of scale and factor inputs become more productive.
If on the other hand, a double of input leads to a 1.5 times increase in output there are decreasing return to scale. This is linked to diseconomies of scale, since it occurs when factor inputs become less productive.
L-shapes LRAC curve
The LRAC curve shifts when there are external economies of scale
i.e. when an industry grows
SRAC falls at first, and then rises, due to diminishing marginal returns. In the long run, costs change due to economies and diseconomies of scale.
If SRAC = LRA, the firm will operate where it can vary all factor inputs
The L-shaped curve is a development in cost theory from the traditional u-shaped curve. It suggests that to begin with, costs per unit fall as output increases, due to economies of scale.
If there are diseconomies of scale within the firm, such as managerial costs increase, they are offset by the economies of scale gained by technical or production factors.
This means that in the long run, costs continue to fall, even if the pace of falling output costs slows