Tropical Storms: Characteristics, Causes, and Impacts
1/87
There's no tags or description
Looks like no tags are added yet.
Name | Mastery | Learn | Test | Matching | Spaced | Call with Kai |
|---|
No analytics yet
Send a link to your students to track their progress
88 Terms
Tropical Storm
A storm with sustained winds 63-118 km/h.
Wind Speed
Critical for classification; over 119 km/h reclassifies storm.
Low Pressure System
Creates strong winds and heavy precipitation.
Storm Surge
Rise in sea level due to storm winds.
Flooding
Excess water inundating land, often from heavy rain.
Landslides
Downhill movement of rock and soil, often triggered by rainfall.
Coastal Flooding
Inundation of coastal areas due to storm surges.
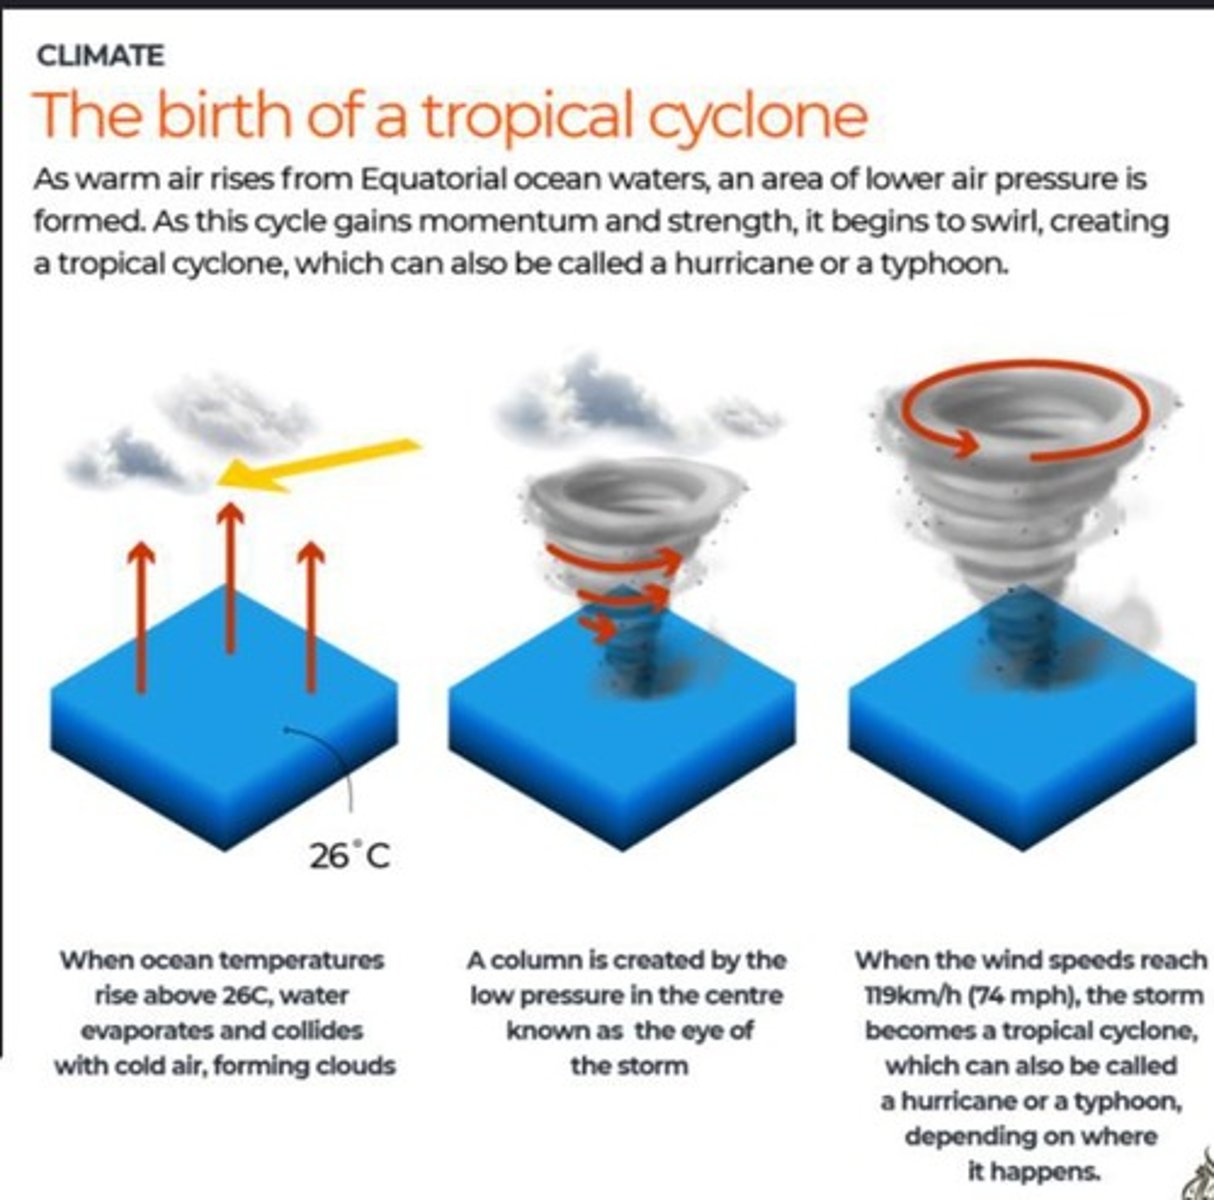
Warm Sea Surface Temperature
Above 26.5°C fuels tropical storm formation.
Coriolis Effect
Causes storm rotation; anticlockwise in Northern Hemisphere.
Tropical Waves
Moving low-pressure areas that can develop into storms.
Wind Shear
Variation in wind speed/direction affecting storm intensity.
High Humidity
Sustains cloud formation and heavy rainfall in storms.
Convergent Winds
Winds from multiple directions forcing warm air upward.
Spatial Distribution
Location where tropical storms typically develop.
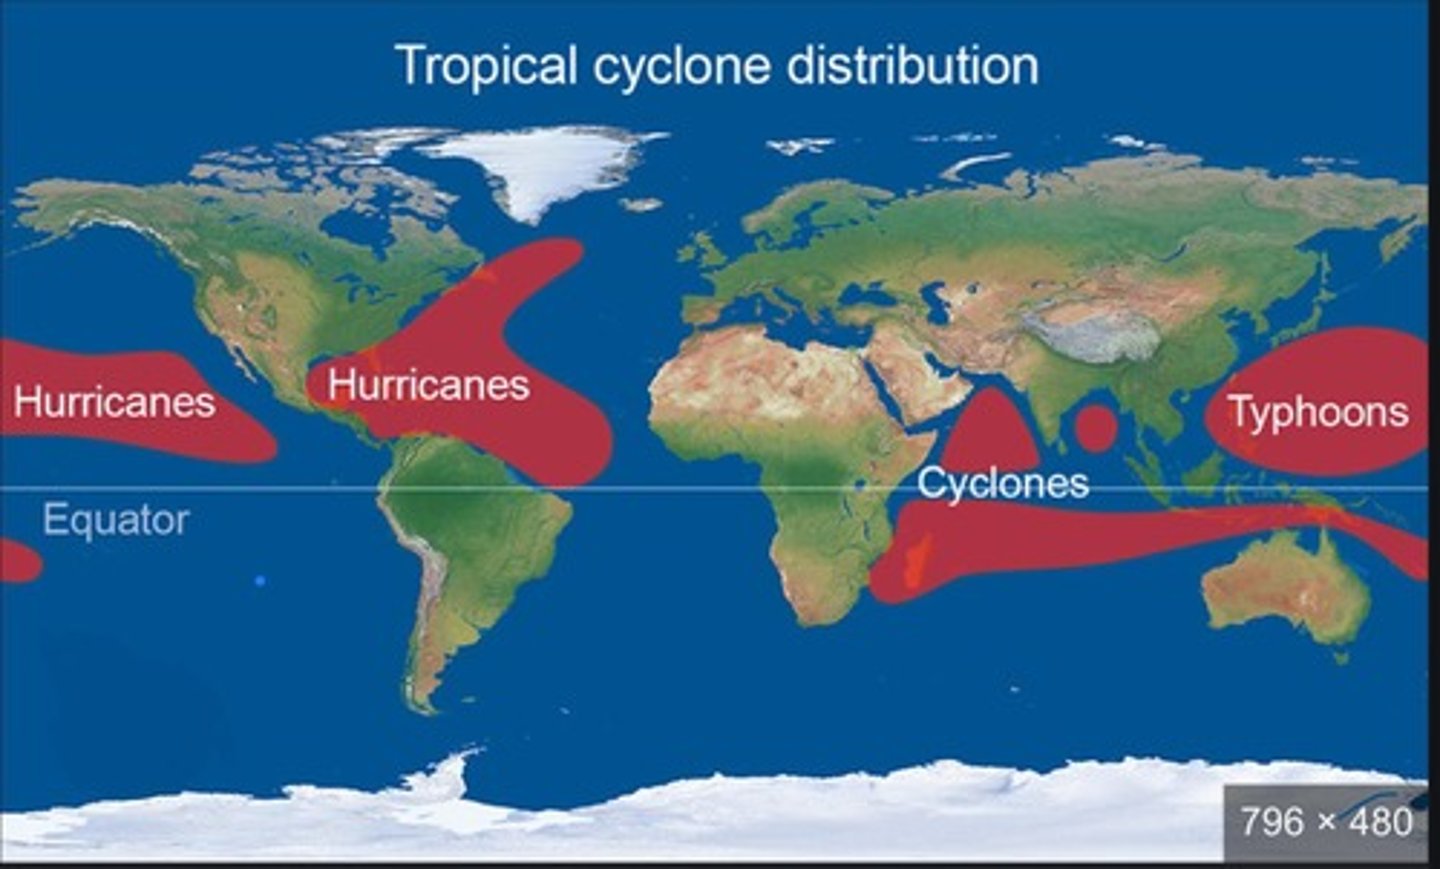
Tropical Waters
Areas 5-15 degrees from the equator with warm temperatures.
Seasonal Distribution
Timing of tropical storm occurrence in various ocean basins.
Northeast Atlantic Season
Jun-Nov, peak in September.
Northwest Pacific Season
All year, peak in August/September.
North Indian Ocean Season
Apr-Jun and Oct-Nov, peaks in May and November.
Southwest Indian Ocean Season
Oct-May, peaks in January-March.
Tropical Storm Velocity
Speed and direction influenced by Coriolis force.
Maximum Intensity Latitude
Storms reach peak strength at 10-20 degrees latitude.
Coriolis Effect
Causes cyclone movement patterns due to Earth's rotation.
Tropical Storm
Severe weather system formed over warm ocean waters.
El Niño-Southern Oscillation (ENSO)
Climatic phenomenon affecting tropical storm patterns.
La Niña Phase
Increased cyclone activity in Australia compared to El Niño.
Ocean Temperature Threshold
Tropical storms form in waters above 26.5°C.
Spatial Distribution
Geographic spread of tropical storms across regions.
Temporal Distribution
Timing and frequency of tropical storms over time.
Human-Induced Climate Change
Alters conditions for tropical storm formation and distribution.
Upper Ocean Warming
Increases favorable conditions for tropical storms.
Cyclone Movement in Southern Hemisphere
Moves west, then south-west, south, and south-east.
Cyclone Movement in Northern Hemisphere
Moves west, then north-west, north, and northeast.
Equatorial Migration
Yearly movement of the equator affecting storm distribution.
Climate Shift Impact
Recent changes affecting global tropical storm patterns.
Hurricane Northward Shift
Hurricanes moving north due to warmer Atlantic waters.
Cyclone Landfall Frequency
La Niña causes up to twice as many landfalls.
Solar Energy Influence
Affects distribution of tropical storms in space and time.
Unstable Air Masses
Influences spatial distribution of tropical storms.
Climatic Processes
Natural phenomena affecting weather patterns and storm activity.
Tropical Storm Propagation
Movement and spread of storms across regions.
Atmospheric Conditions
Changes in lower and upper atmosphere affect storm activity.
Recent Research Findings
Studies show shifting storm patterns due to climate change.
40-Year Climate Change Impact
Significant changes in storm distribution observed globally.
Global Average Temperature
Average temperature of Earth's atmosphere and oceans.
Tropical Cyclones
Severe storms forming over warm ocean waters.
Cyclone Alfred
Category 4 cyclone impacting Queensland in 2025.
Coral Sea
Location where Cyclone Alfred formed.
Destructive Winds
Winds exceeding 165 km/h caused by cyclones.
Storm Surges
Rise in sea level due to cyclone winds.
Duration of Cyclone Alfred
21 February - 9 March 2025.
Vulnerability Factors
Population density and elevation increase cyclone risk.
Southeast Queensland
Region directly exposed to cyclones from Coral Sea.
Economic Damage
Financial losses due to infrastructure destruction.
Infrastructure Impact
Damage to roads, bridges, and power lines.
Tourism Impact
Closure of hotels and tourist sites due to cyclone.
Agricultural Damage
Crop fields flooded and livestock killed by cyclone.
Power Outages
Loss of electricity due to cyclone damage.
Insurance Claims
High claims due to extensive cyclone-related damage.
Local Government Pressure
Increased financial strain on local budgets post-cyclone.
Population Density
Higher number of people per area increases vulnerability.
Elevation
Height of land affecting cyclone impact severity.
Economic Trouble
Financial hardships caused by cyclone-related closures.
Cyclone Scale
Magnitude classification based on wind speed and damage.
Distribution of Cyclones
Spread of cyclones influenced by temperature changes.
Impact on Transportation
Disruption of transport systems due to cyclone damage.
Cyclone Alfred
A severe storm causing extensive damage in Queensland.
High winds
Strong winds contributing to property and crop damage.
Flooding
Excess water causing destruction of agricultural fields.
Environmental degradation
Deterioration of ecosystems due to storm impacts.
Ecosystem weakening
Loss of resilience in natural habitats post-cyclone.
Wildlife habitats
Natural environments disrupted, affecting animal survival.
Local businesses
Entities focused on economic recovery post-disaster.
Financial impacts
Immediate economic consequences affecting local enterprises.
Short term recovery
Quick restoration efforts by businesses after disaster.
Tourism sector
Industry reliant on visitors, heavily affected by the cyclone.
Agricultural sector
Farming industry facing crop and livestock losses.
Local governments
Authorities responsible for community safety and infrastructure.
Public safety
Priority for local governments during disaster recovery.
Critical infrastructure
Essential services needing protection and restoration.
Immediate recovery
Restoration of services post-disaster by local governments.
Insurance claims
Financial requests for recovery costs after damage.
Power outages
Loss of electricity impacting business operations.
Storm surge
Rise in sea level causing coastal damage.
Pollutants
Harmful substances affecting water quality post-cyclone.
Community well-being
Focus on health and safety of residents post-disaster.
Financial support
Assistance sought by businesses for recovery efforts.
Infrastructure damage
Destruction of physical structures needing repair.