PSY 303 (RMS I) Final Exam
1/166
Earn XP
Description and Tags
(Pilot)
Name | Mastery | Learn | Test | Matching | Spaced |
|---|
No study sessions yet.
167 Terms
What is Psychology?
The study of behavior and mental processes
The same methods that are used for biology, chemistry, and physics can be applied to study behavior, thought, emotion, and physiological processes
What is Behavioral Science?
Philosophers pondered human nature
Speculative explanations of behavior changes to empiricism
1st Psychology Lab: Wilhelm Wundt
Established in 1879
What goals do psychologists have?
Describing behavior:
Focus is describing patterns of behavior, thought, or emotion
Predicting behavior:
Focus is on developing equations to predict behavior (when and why it may/ might occur)
Explaining behavior:
Focus is on developing theoretical explanations for patterns of behavior
What is basic research?
Conducted to understand psychological processes without regard for whether or not the knowledge is immediately applicable
What is applied research?
Conducted to find solutions for problems rather than to enhance general knowledge about psychological processes
What is the scientific approach?
Systematic Empiricisim, Public Verification, Solvable Problems
What is empiricism?
Knowledge comes from our senses, i.e. observation
What is Systematic Empiricism?
Systematic observations to draw conclusions
What is public verification?
Findings must be replicated
What is a hypothesis?
An educated prediction
Precise: must describe a specific testable outcome in your study
Based on past research
What is “A Priori”
Before results predictions
What is “Post Hoc”?
After results prediction
What does falsification mean?
Theories must be falsifiable/ able to be disproven
What is a variable?
Any factor that can change, be manipulated, or controlled in an experiment
Note: Variable can be ANYTHING!
What does it mean to conceptually define a variable?
Much like a definition that one would find in a dictionary
Ex: Depression - a persistent feeling of sadness and loss of interest/ it can also cause a variety of emotional and physical problems
What does it mean to operationally define a variable?
Specifies precisely how a concept is measured
Ex: Cumulative scores…
What is natural setting in an experiment?
Have no intrusions or interruption by the researcher (ex: observing choice of soft drinks at a restaurant from a distant table)
Know they are acting genuine because they don’t know they are being observed
What is contrived setting in an experiment?
(Laboratory) settings are designed for observing behavior (ex: sign up for a study and get watched while eating)
May change behavior because they are being watched
What is disguised observation?
Researcher conceals that behavior is benign recorded
Privacy & consent issues
What is Non-Disguised Observation?
when people know they are being watched
Hawthorne Effect (reactivity)
How to Write Effective Questions?
Use precise language
“What do you do after class?”
Use basic words without jargon
“Have you used the ILL service?”
Don’t make assumptions
“How many apps do you have on your phone?”
Avoid double-barreled questions
“This service is interesting and useful.”
What is Social Desirability Response?
Acknowledging that people may engage in behaviors that are NOT socially desirable but in an interview will not be honest about participating in said behaviors
What is Acquiescence?
Always agreeing
What is Nay-Saying?
Always saying no
What is Descriptive Research?
Describes behavior
What is Correlational Behavior?
Examines relationship between variables
What is Experimental Research?
Allows us to study causes of behavior
What is Quasi-Experimental Research?
When the researcher wants to study the effect of naturally occurring variables
In this situation they would not vary the independent variable by group
What is simple random assignment?
Everyone has an equal chance of being assigned to any group/ condition
Ex: flip a coin, roll a die, etc.
Conditions are mostly equivalent
People with any attribute are equally likely to be in either group
What is matched random assignment?
Ensures conditions will be similar along specific dimensions
Participants are matched into homogenous blocks
Participants in each block are assigned randomly to conditions
What is a within-subjects (repeated) design?
Repeated measures
Difference due to IV
Participants experience all conditions
All levels of the IV
No need for random assignment
Tested against your prior behavior
Pros:
More powerful
Power = ability to detect IV effects
Requires fewer participants
Cons:
Order effects
Doing multiple tests changes behavior
Examples:
Carryover Effect: one condition impacts the other
Practice Effect: Learn from previous
Fatigue Effect: energy is depleted
Sensitization: Realize hypothesis
What is counterbalancing?
Used to combat order effects
Presenting levels of IV in different orders
What are confounds?
A variable other than the IV that differs systematically between conditions
Invalidates experiment
Unclear whether difference are due to IV or confound
Must be eliminated at all costs
What is Internal Validity?
Determines degree to which we can draw accurate conclusions about the effects if IV
Occurs when all confounds are eliminated
Can conclude that the observed differences were due to the IV
Achieved through experimental control
But some error is always present
What is external validity?
Inverse relationship with internal validity
The more internally valid a study is (greater experimental control) the less likely it will be externally valid (generalizable to the “real world”)
Internal validity is more critical than external validity
What is a between-subjects (independent) design?
Independent measures
Individual differences
Differences due to IV
Participants experience one condition
Typically requires random assignment
At least 2 distinct groups (control and experimental)
What is the median?
Scores are listed in order from smallest to largest
The median is the midpoint, it equally divides the scores
When to use it?
The median is used on ordinal, interval, or ratio data
The median isn’t changed by extreme scores (aka outliers), so it can be a good alternative to the mean
What is mode?
The mode is the most frequently occurring score (aka which score(s) show(s) up the most)
Can be used on any scale of measurement (nominal, ordinal, interval, or ratio)
What is a bar graphs?
Frequency distribution graph used when the score categories (X values) are measured on a nominal or an ordinal scale
what is a histogram?
Frequency distribution graph when the data is measured on an interval or ratio scale
What are polygons?
Also used for interval or ratio scales
A histogram, but with dots and lines
For exact frequency tallies, your distribution will have jagged edges
For relative frequencies (estimates of populations), your distribution will have smooth edges
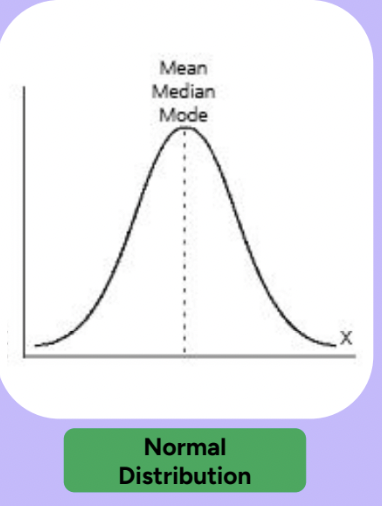
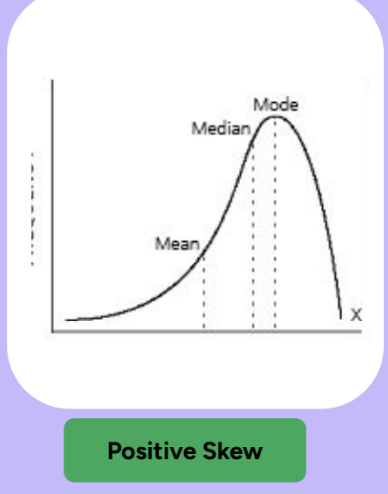
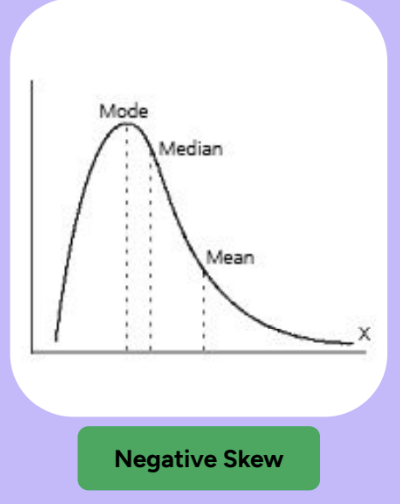
What are positively & negatively skewed distributions?
Skewed distributions pile up on one side, leaving a “tail” of a few extreme values on the other side
Positively Skewed = tail goes to the right (towards positive numbers)
Negatively Skewed = tail goes to the left (towards negative numbers)
Hint:
Mean > Median = positive
Mean < Median = negative
Mean = Median = normal
What is measurement error?
Variability in scores due to factors that distort the true score
What is True Score?
The score a participant would obtain if a measure were perfect and we could measure without error
What is reliability?
Consistency/ dependability of the measuring technique
Reliability has an inverse relationship with measurement error (the less error is present = more true scores present)
If observed scores are close to true scores, the measure has high reliability
Ex: A watch that runs correctly but is always 30 minutes fast is very reliable despite low validity
What is correlation coefficient?
A value which describes the relationship strength between two measures
Can range from -1.00 to +1.00
Correlation of 0.00 indicates no relationship
Sign indicates direction
What is interrater reliability?
Consistency among two or more researchers who observe and record participants behavior
What is test-retest reliability?
Consistency of responses on a measure over time
Use the same measure twice
Examine the correlation
Correlation > 0.70 is desired
Measurement result should NOT change over time
What is inter-item reliability?
Consistency between items on a scale (not entire measure)
Tells us whether all of the items on a scale are measuring the same thing
If not, measurement error increases and reliability decreases
Pro-Tip: Multiple items measuring the same thing are called scales
Indices of Inter-Item Reliability:
Item-total Correlation: The correlation between one item and the sum of all the other items on a scale
What is split-half reliability?
Divide the items on a scale into 2 sections and examine the correlation between the sections
What is Cronbach’s Alpha (a)?
The average of all possible split-half reliabilities
Most frequently used
a > 0.70 is considered acceptable
What are some methods for increasing reliability?
Standardize how measure is administered
Clarify instructions and questions
Train researchers/coders
Minimize errors in coding data
What is validity
How accurate is a measure at estimating what it is supposed to assess?
Do differences in scores truly reflect differences in what we are trying to measure?
Ex: A watch that tells the right time has high validity, and broken watch will be valid twice a day
What is face validity?
The extent to which a measure appears to measure what it’s supposed to measure
Does NOT actually impact ‘true’ validity
What is construct validity?
How well does measuring a hypothetical construct relate to other measures
TIP: A hypothetical construct is something that cannot be directly observed but is inferred based on observation or experience
What is convergent validity?
A measure correlates with the other measures that it should correlate with
What is discriminant validity?
A measure does not correlate with other measures that it should not correlate with
What is Fairness & Bias?
Test bias occurs when a particular measure is not equally valid for everyone
The question is not whether various groups score different on the test
Test bias is present when the validity of a measure is lower for some groups than for others
What are inferential statistics?
Are used to detect patterns, and variability influences how easily they are detected:
Low variability = easier to see
High variability = more difficult
What is standard deviation?
Measures the standard (average distance between a score and the mean
Can only be used for interval and ratio scales
Most commonly used
Most important measure of variability
What is range?
Total distance covered by the distribution, form highest to lowest value
Describes the number of categories when we are using numbers or discrete groups
Range = Max - Min
However, range relies on two values (extremes), ignores all others
What is variance?
Is calculated using all scores from a distribution
What is probability sampling?
Can quantify the likelihood of being selected
Know selection probability, accurately describes a population/ Rarely used in behavioral science
Must be a representative sample
Simple Random
Systematic
Stratified Random
Cluster
What is non-probability sampling?
Can’t quantify the likelihood of being selected
Types of non-probability sampling include…
Convenience
Quota
Snowball
Convenience sampling
Easy to reach
Most common type of sampling
Quota sampling
Specific proportions of people with selected characteristics
Snowball sampling
For hard to reach groups
word of mouth process
recruit people and they recruit people
What is Utilitarianism?
Ethics judged according to consequences
E.g., benefits should outweigh costs
Hedonism + Consequentialism = Utilitarianism
Maximizes happiness
Minimizes unhappiness
Outcome is what matters
Benefits of Utilitarianism:
Improved techniques
Practical outcomes
Benefits for researchers
Benefits for participants
Costs of Utilitarianism:
Time and effort
Participants’ welfare
Money
Deception; creating distrust
What is deontology?
Judged according to universal moral code
E.g., deceit is always wrong
Intentions matter
Ex: poison your partner
What is Ethical Skepticism?
Concrete moral codes can’t be made
E.g., decisions are based on your conscience
What is probability?
Likelihood of all possible outcomes
“probability “ = p
Can we quantify this? A fraction, decimal, or percentage:
P = ½ = 0.50 = 50%
Goes from 0% to 100%, or “0” to “1”
Probability of A = # of outcomes classified as A/ total # of possible outcomes
Low probability values = special/rare! Not common or likely to happen = EFFECT
High probability values = Pretty common/likely to happen = NO EFFECT
Probability & Sampling
Quantifies relationship between sample & population
When something occurs in a sample, how likely is it that it represents the population?
Probability calculation sometimes requires independent random sampling (Convenience sampling for our project)
Equal chance
Replacement
Probability & Frequency Distribution
Graphs display a population of scores
Proportion of graph = proportion of population
Probability can be defined by a proportion of the graph
Probability & Normal Distribution
Can determine likelihood that a score falls in shaded area
Line location specified by z-score
Tail = smaller section
Body = larger section
What is Z- Score?
Z = M - miu/sigma(M) -> [standard error]
Describes one sample’s location in the sampling distribution
Focused on a singular score
But usually in our field, focused on more than that
We can calculate z scores for entire samples
What is Sampling Distribution?
Distributions of statistics that consists of all of the possible samples of a specific size from a population
Most sample means will pile up around the population mean
Should form a normal distribution if…
The population is normally distributed
Number of scores in each sample is 30+
Larger samples are more representative than smaller samples
What is Distribution of Sample Means?
Collection of sample means for ALL POSSIBLE random samples for a size (n) that could be obtained from a population
What is Hypothesis Testing?
We usually can’t measure everyone in a population
We use sample data to evaluate a hypothesis about a population
Take a sample, expose it to your I.V., make an inference to the population
Inferential Statistics
Factors that Influence a Hypothesis Test:
Variability of scores
Number of scores in the sample
What are the steps for hypothesis testing?
Step 1. State a Hypothesis:
State a hypothesis actually means that you will state 2 hypotheses
H0 = Null (no difference) -> Treatment (IV) has no effect on the outcome (DV)
H1 = Alternate (Difference) -> Treatment (IV) does have an effect on the outcome (DV)
Treatment = IV = Manipulation = Experimental Group
Step 2. Set Decision Criteria:
Decision Criteria (a = alpha value)
Less than 5% probability (p) of error is okay with social science
5% = 5/100, 0r 0.05
Alpha a = 0.05
Probability of error (p) should be < 0.05
Also sets the critical regions
If the results of a sample who has received the treatment falls within the critical region it is very unlikely
Step 3. Collect Data, Compute Stats:
Collect data is self-explanatory
Step 4. Make Decision:
What are the choices?:
1. Reject Null Hypothesis
2. Fail to reject Null Hypothesis
What does it mean to reject the null hypothesis?
Saying there is a difference between groups
IV had a significant influence on the results
What does it mean to fail to reject the null hypothesis?
Saying there is no difference between groups
IV did not have a significant influence on the results
What is Type I Error?
False Positive - Rejecting a true Null Hypothesis
What is Type II Error
False Negative - Failing to reject a false Null Hypothesis
What is nominal scale of measurement?
Numbers are assigned as labels
Least amount of information
What is ordinal scale of measurement?
Rank ordering
More than just a label
Doesn’t tell us distance
What is interval scale of measurement?
Equal differences between numbers reflect equal differences
NO TRUE ZERO
Zero is just another point in the dataset, doesn’t represent the absence of something
What is ratio scale of measurement
Contains a TRUE ZERO
Doesn’t matter is zero “can” happen, only what it’s defined by
Greatest amount of information
Use when possible
Least informative
What is a normal distribution and where is the mean, median, and mode?
What is a positive skew and where is the mean, median, and mode?
What is a negative skew and where is the mean, median, and mode
A perfectly reliable measure has what?
Has no measurement error
A sunset of the population that shares a particular characteristic is called what?
Stratum
A design with high what will detect whatever actual effects are present?
Power
___ is to some as ___ is to all?
Sample, population
What is the best measure of central tendency for nominal data?
Mode
What is the typical preferred measure for central tendency when it comes to outliers?
Median
What occurs when a particular measure is not EQUALLY VALID for everyone?
Test bias
what is s²
Variance
what is s?
standard deviation
When X values (raw scores) are transformed into Z-scores the resulting distribution of Z-
scores always has a standard deviation of ___ and a mean of ___.
1 & 0 respectively