MLSP Lab Technique Exam #2
1/54
There's no tags or description
Looks like no tags are added yet.
Name | Mastery | Learn | Test | Matching | Spaced |
|---|
No study sessions yet.
55 Terms
Switching to Week 4: Lab Testing Phases
What are the 3 phases of testing? What happens in each phase?
1. Pre-analytical: before testing
- from ordering process to specimen testing
2. Analytical: during testing
- specimen testing
3. Post-analytical: after testing
- data entry, calculations, and interpretation
Which phase produces the most errors? What are 3 examples of errors?
- pre-analytical phase accounts for 60% of errors
- Ex: contamination of sample, temperature, labeling
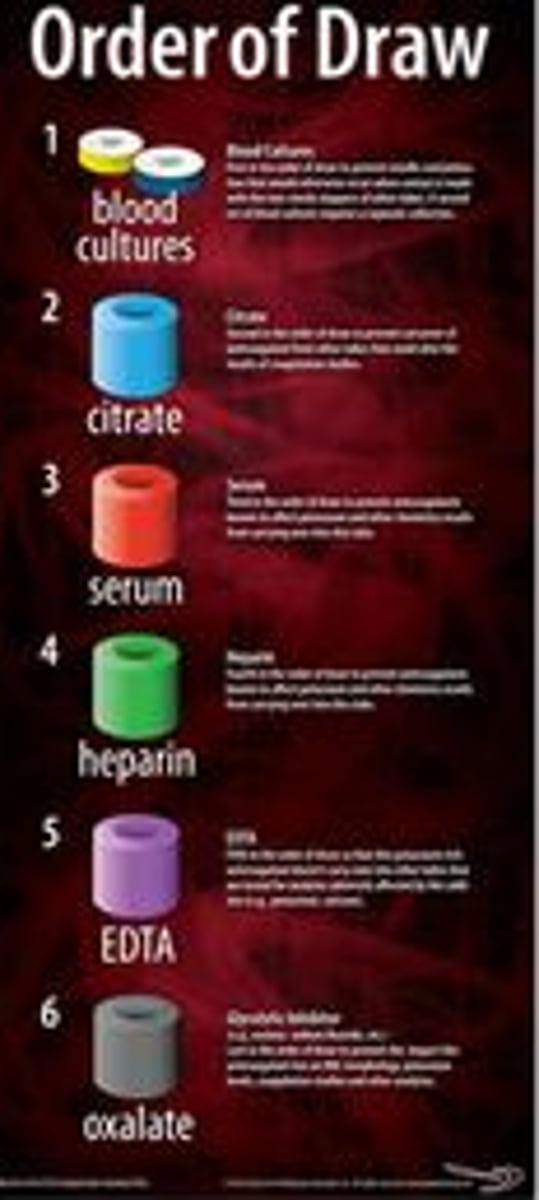
What is the correct order of draw? Which colored tube is the only tube that makes serum?
1. yellow (sterile)
2. blue (sodium citrate)
3. red (serum)
4. green (Li heparin)
5. purple (EDTA)
6. gray (fluoride)
- the only tube with no anti-coagulants is the red tube that produces serum
stop buying roses, girls prefer gold
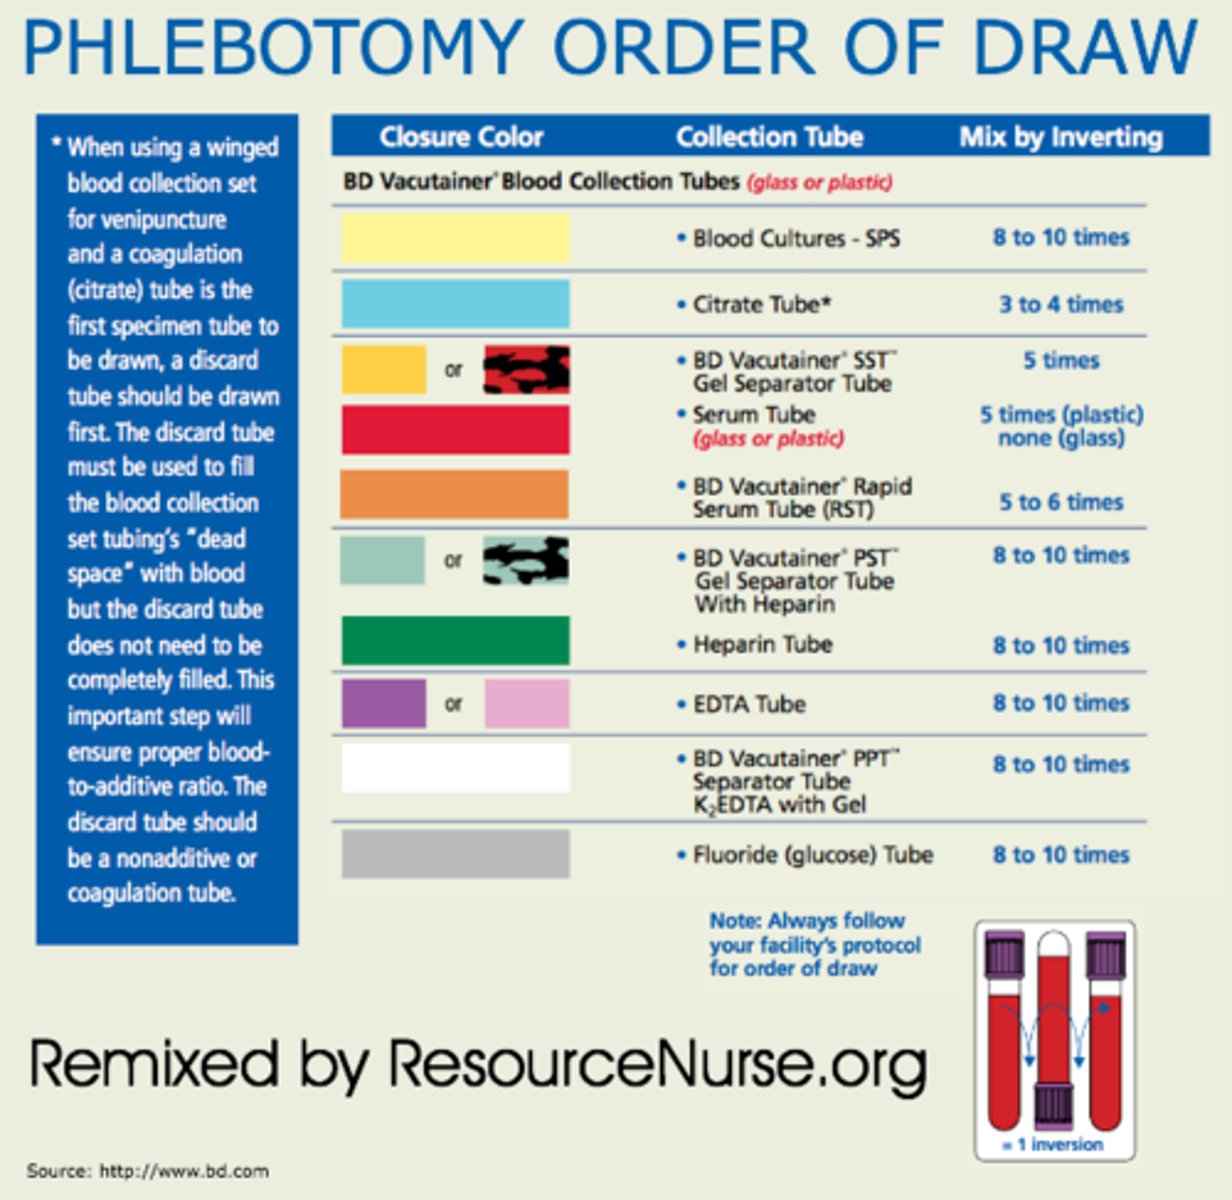
Why is order of draw for tubes important?
- it will make any contamination from test tubes with additives/anti-coagulants irrelevant
- Ex: urine analysis doesn't care but chemistry department does!
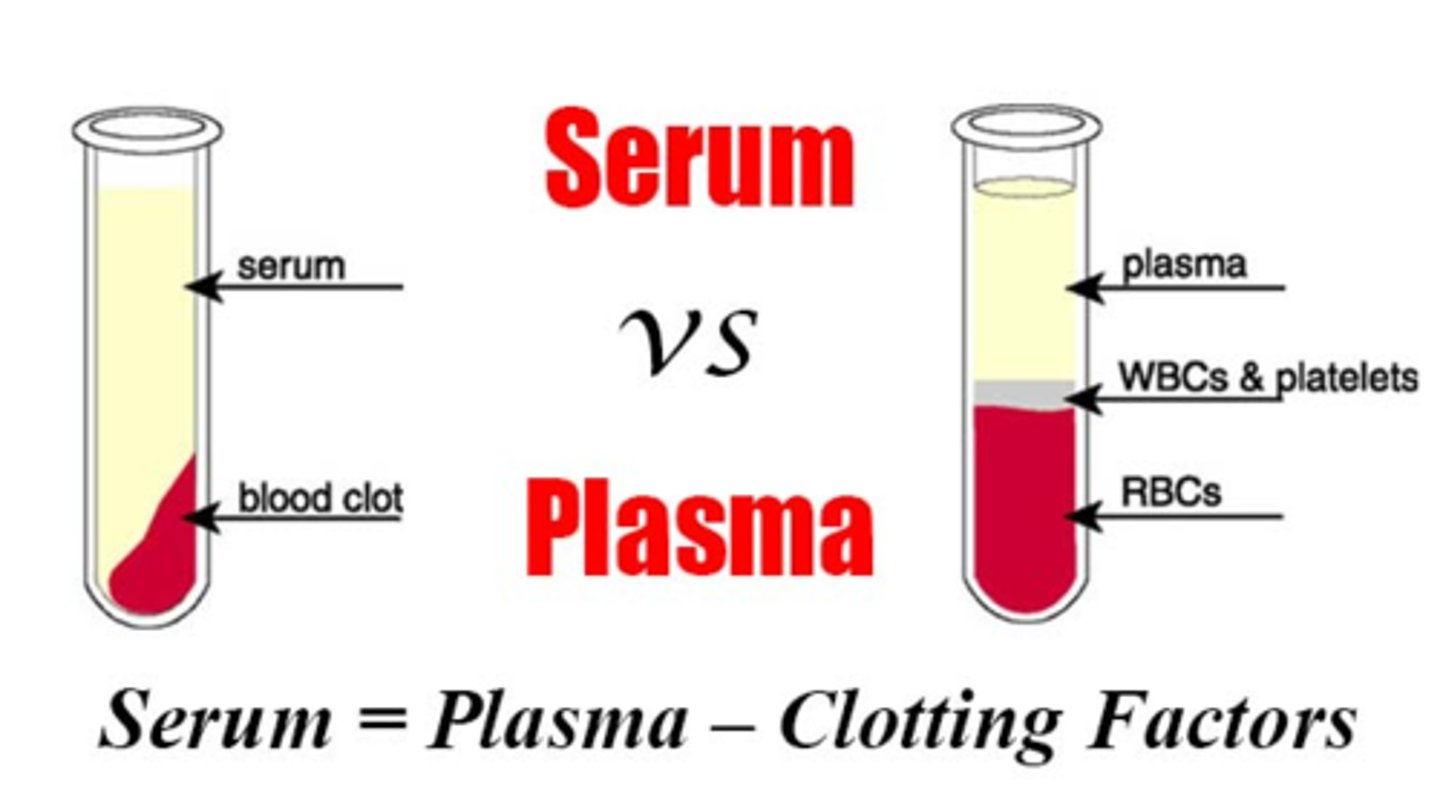
What is the difference between plasma and serum?
Plasma: the liquid part of blood with clotting factors but is treated with anti-coagulants so it doesn't clot
- plus clotting factors
Serum: the liquid part of blood with no clotting factors
- subtract clotting factors
What are 3 examples of interferents that could ruin a sample? What happens in each? How could it affect the viability of the sample?
1. hemolysis: lysis of RBC could release hemoglobin into the solution
- this could cause changes in absorbance or plasma concentration
2. icterus: increase in bilirubin concentration in the blood
- this could cause changes in absorbance or plasma concentration
3. lipemia: high concentration of lipids or fats in the blood
- this causes fat to scatter light and affect spectrophotometry readings
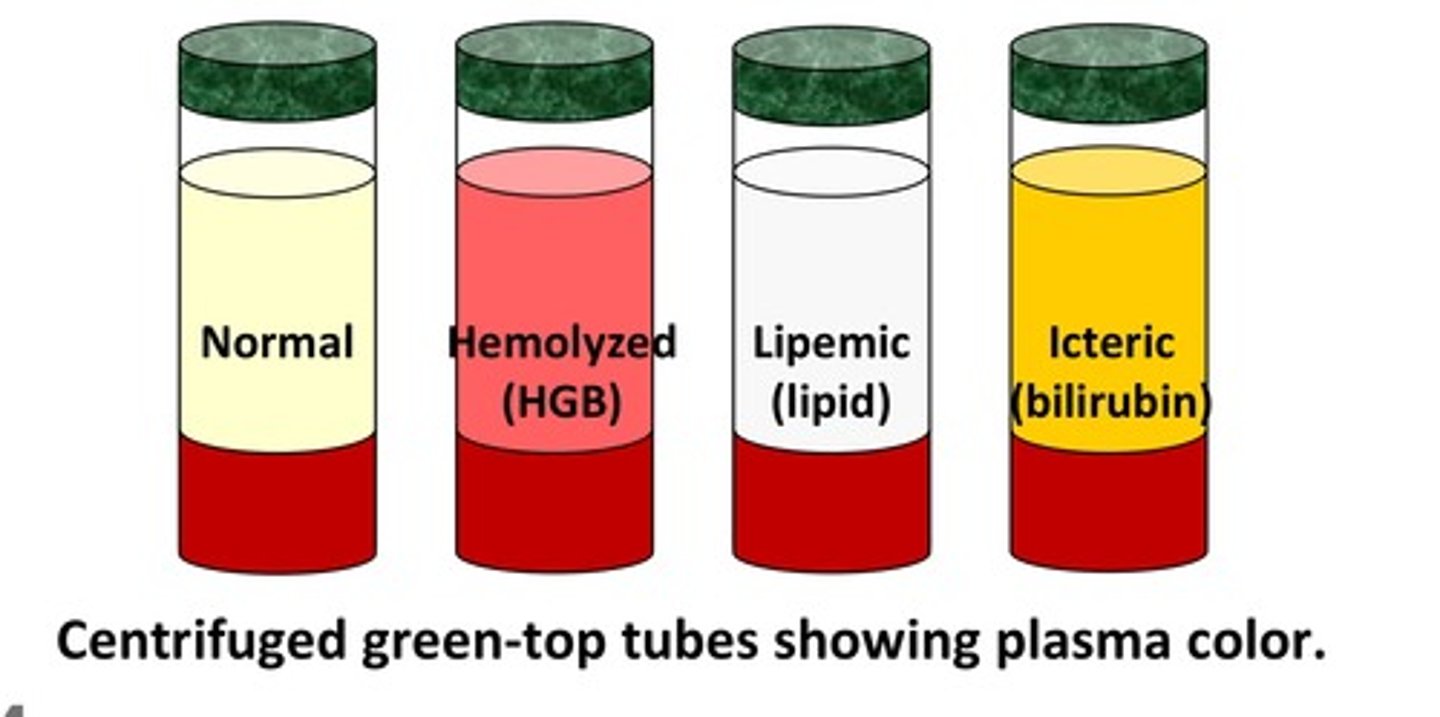
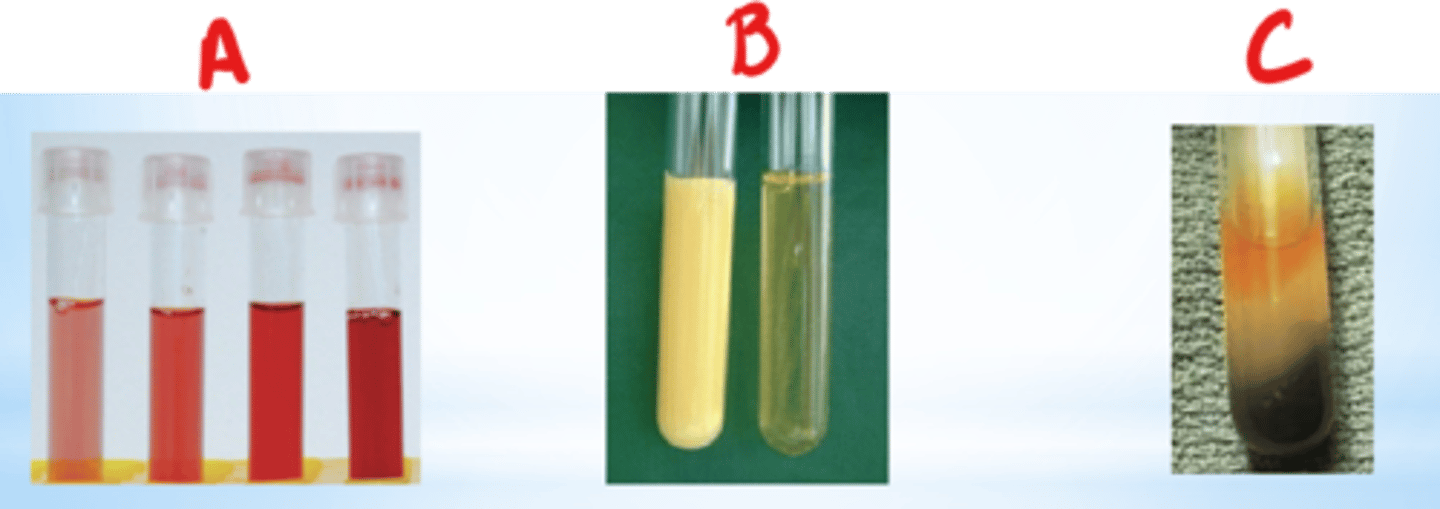
What does hemolysis, icterus, and lipemia look like in a blood tube?
1. hemolysis: red plasma/serum
2. icterus: dark orange plasma/serum
3. lipemia: very turbid plasma/serum
Switching to Westgard Rules/Assay Performance
What is a Gaussian distribution? How is the mean, median, and mode related?
- bell shaped curve
- the mean, median, and mode should be identical
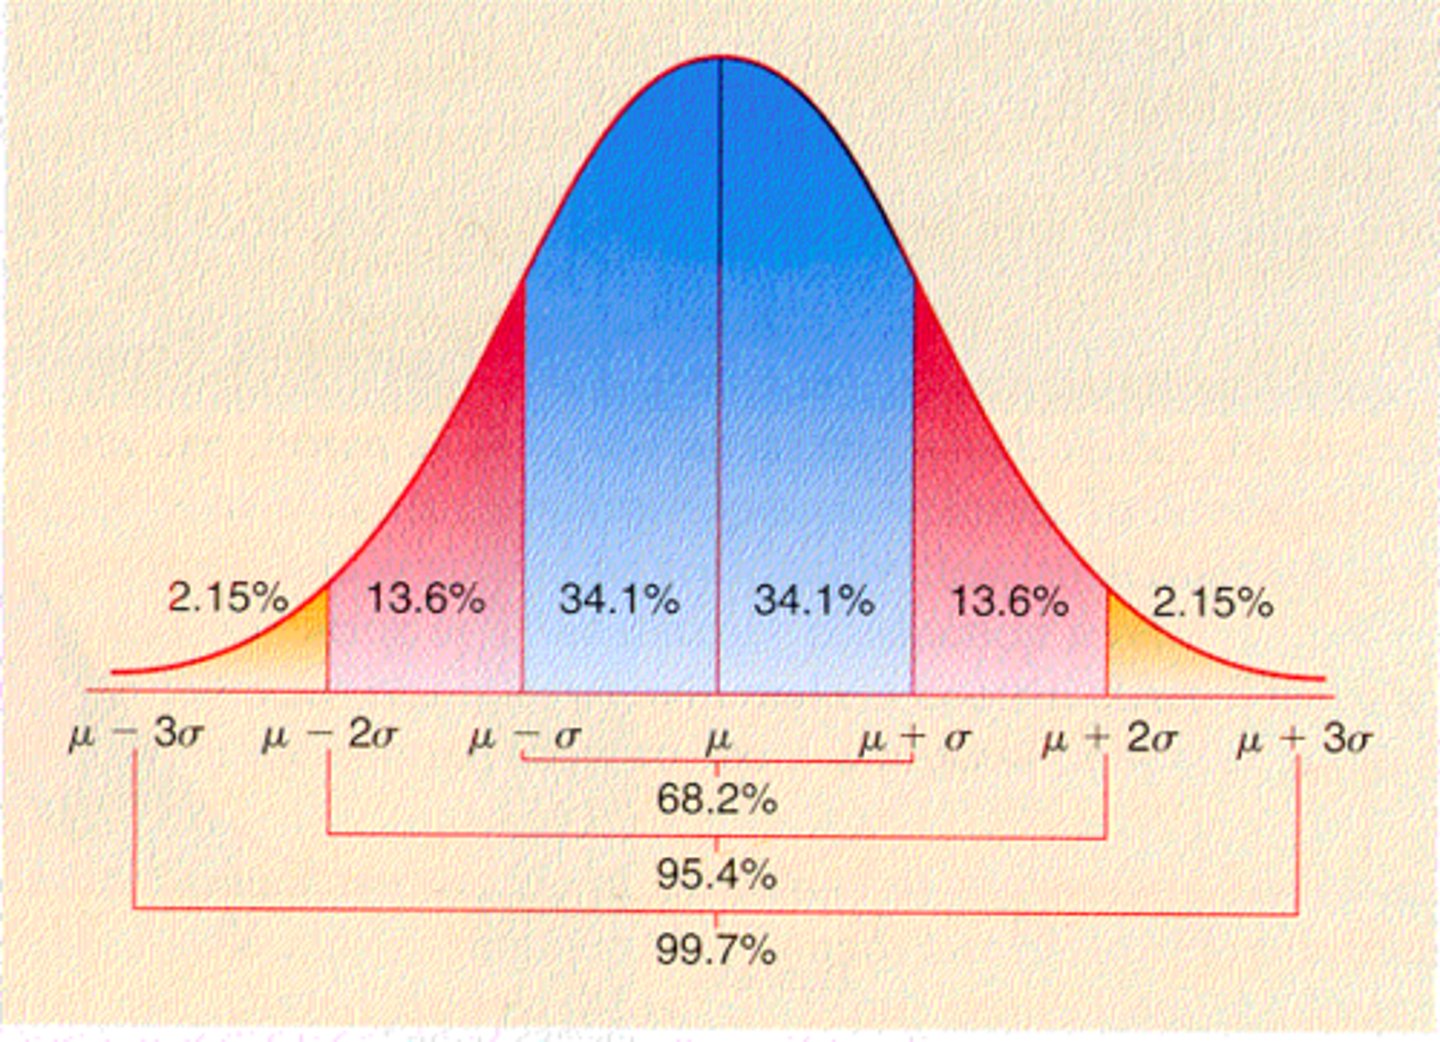
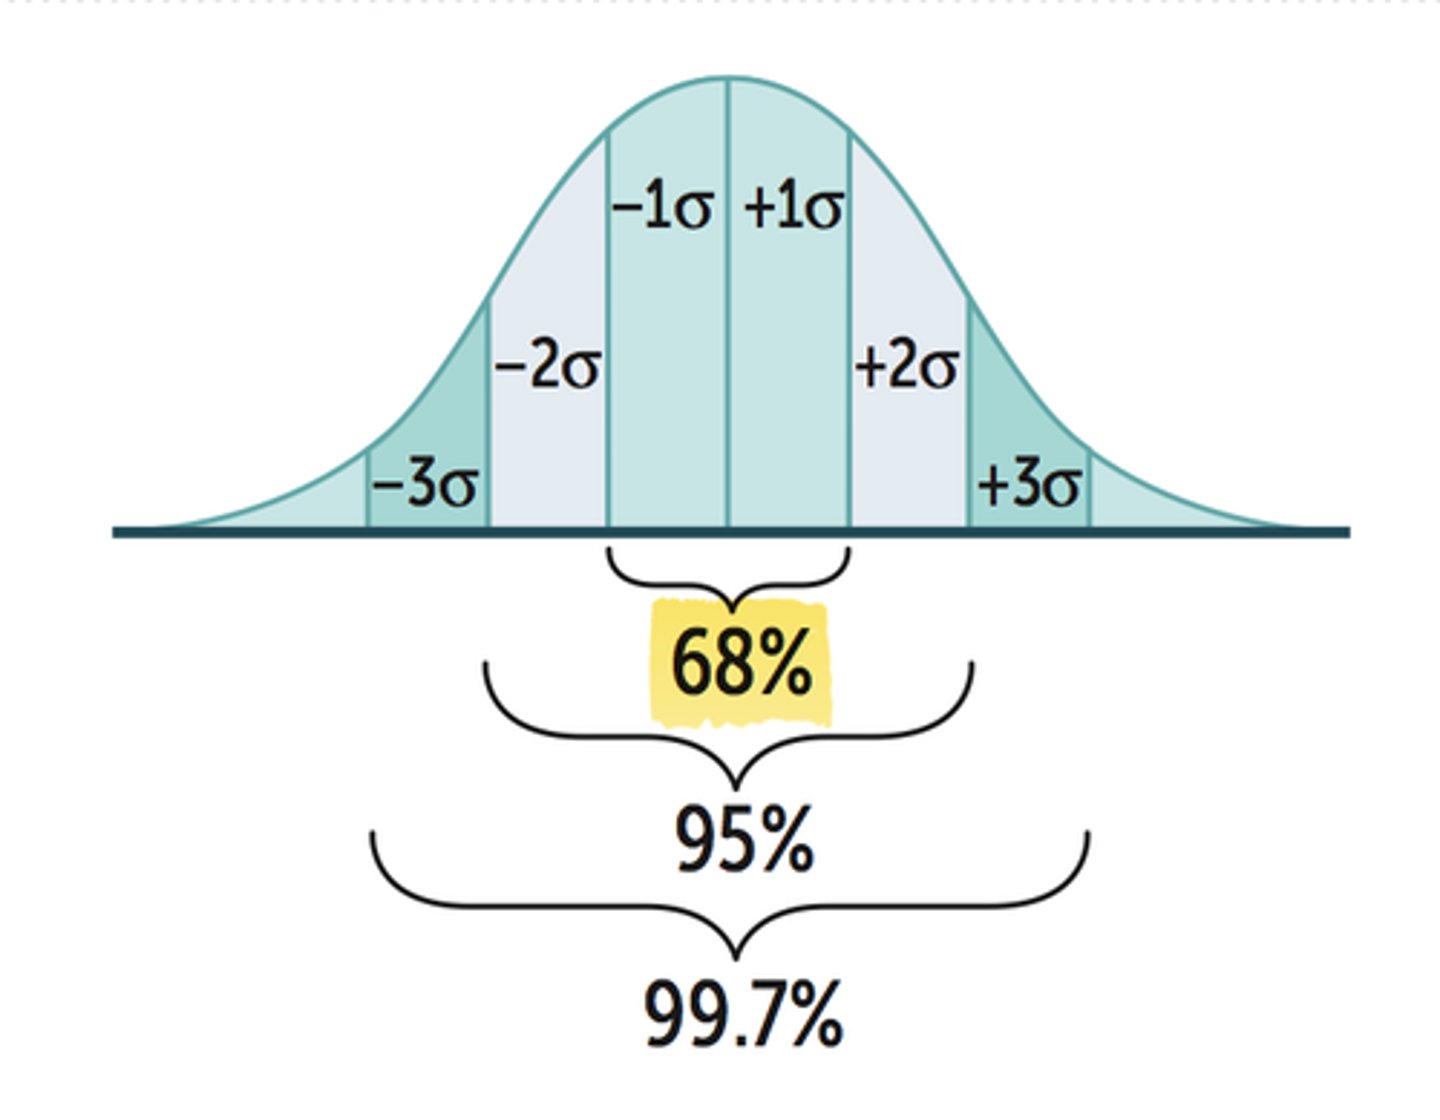
What % of values should fall under 1SD, 2SD, and 3SD in a Gaussian Distribution?
- 1SD: 68%
- 2SD: 95%
- 3SD: 99%
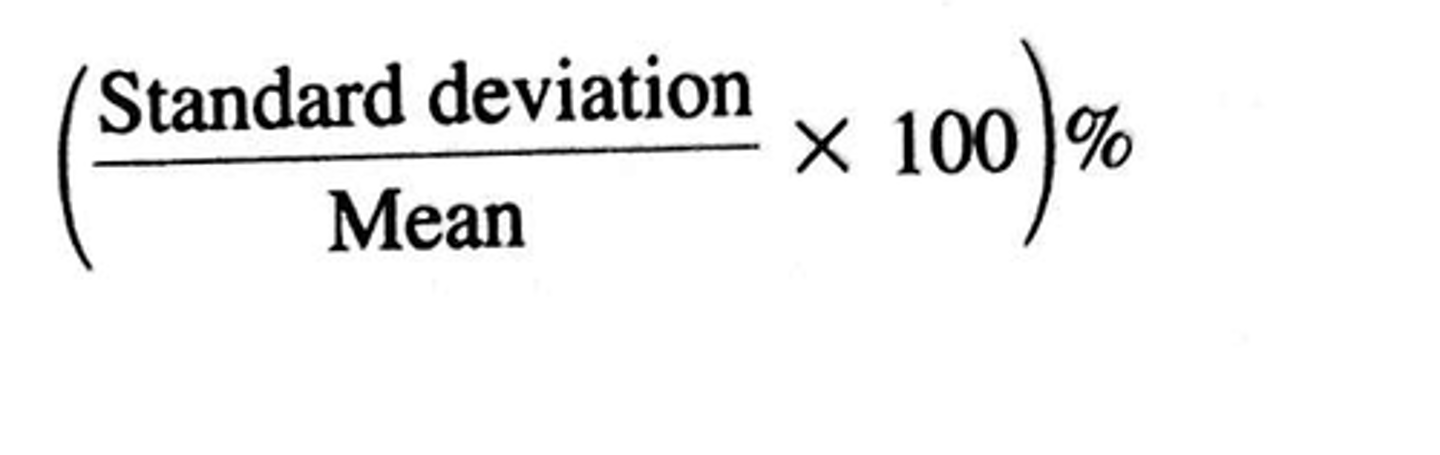
What is the coefficient of variation (CV)? What is the formula?
% of deviation the data values are from the mean
%CV = (SD/mean) x 100
- Ex: the data values differed from the mean by 20%
What is quality control in a lab?
- a test to determine if there are any random or systemic errors in your control solutions
Recap:
- a control is a solution used to determine if an assay is working properly
- made up of a solution similar to the samples being analyzed

What are 4 characteristics of random error?
1. random errors can cause errors in precision
2. direction and magnitude varies (totally random)
3. quantified by SD and %CV
4. can be reduced but not eliminated
- Ex: air bubble, temperature, timing
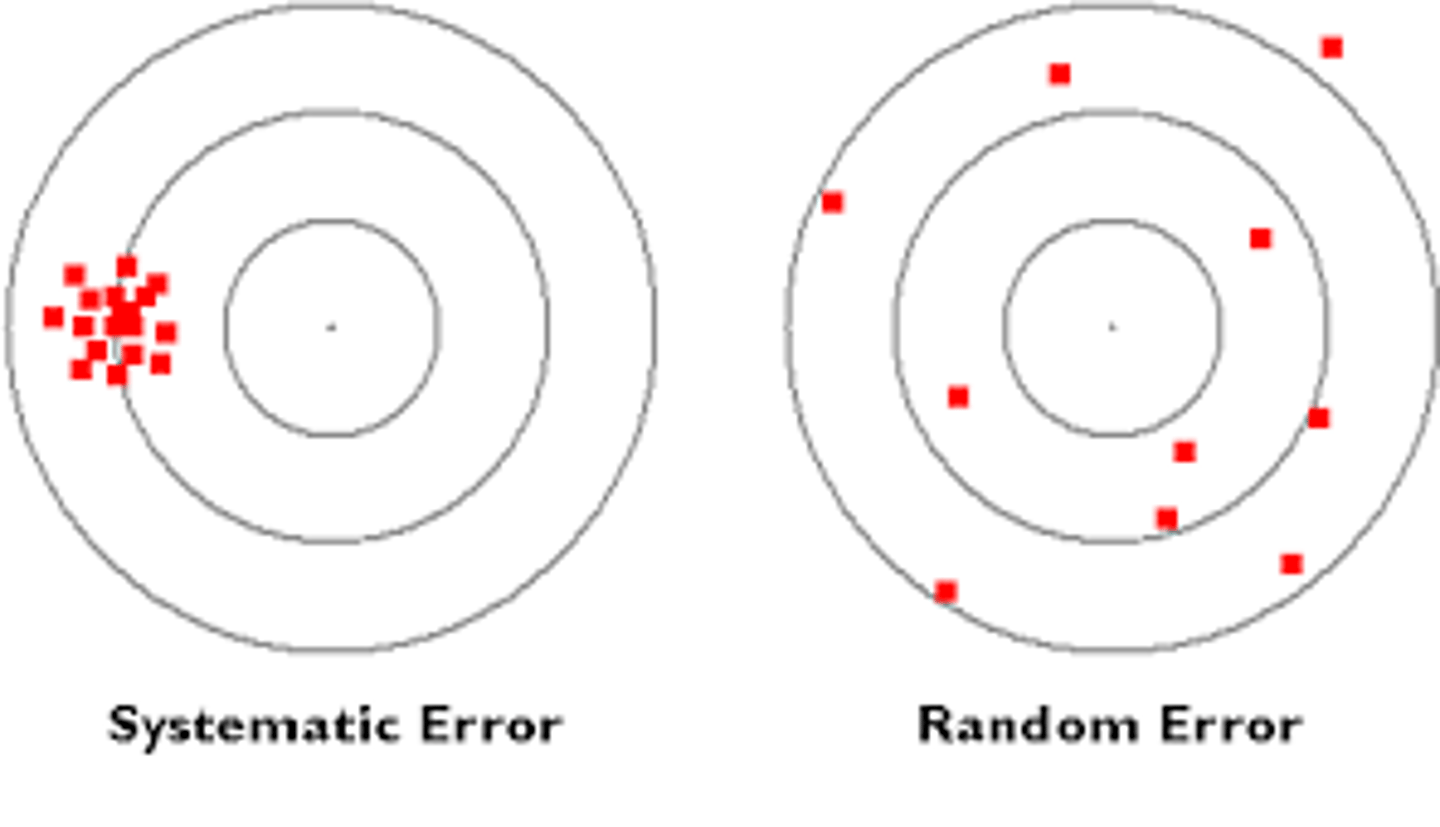
What are 3 characteristics of systemic error (applies to the whole batch)?
1. systemic errors can cause errors in accuracy
2. error in 1 direction
3. can be eliminated
- Ex: evaporation of media, calibration changed
How do we assess quality control?
we make a Levey Jennings chart of the control values and apply Westgard rules
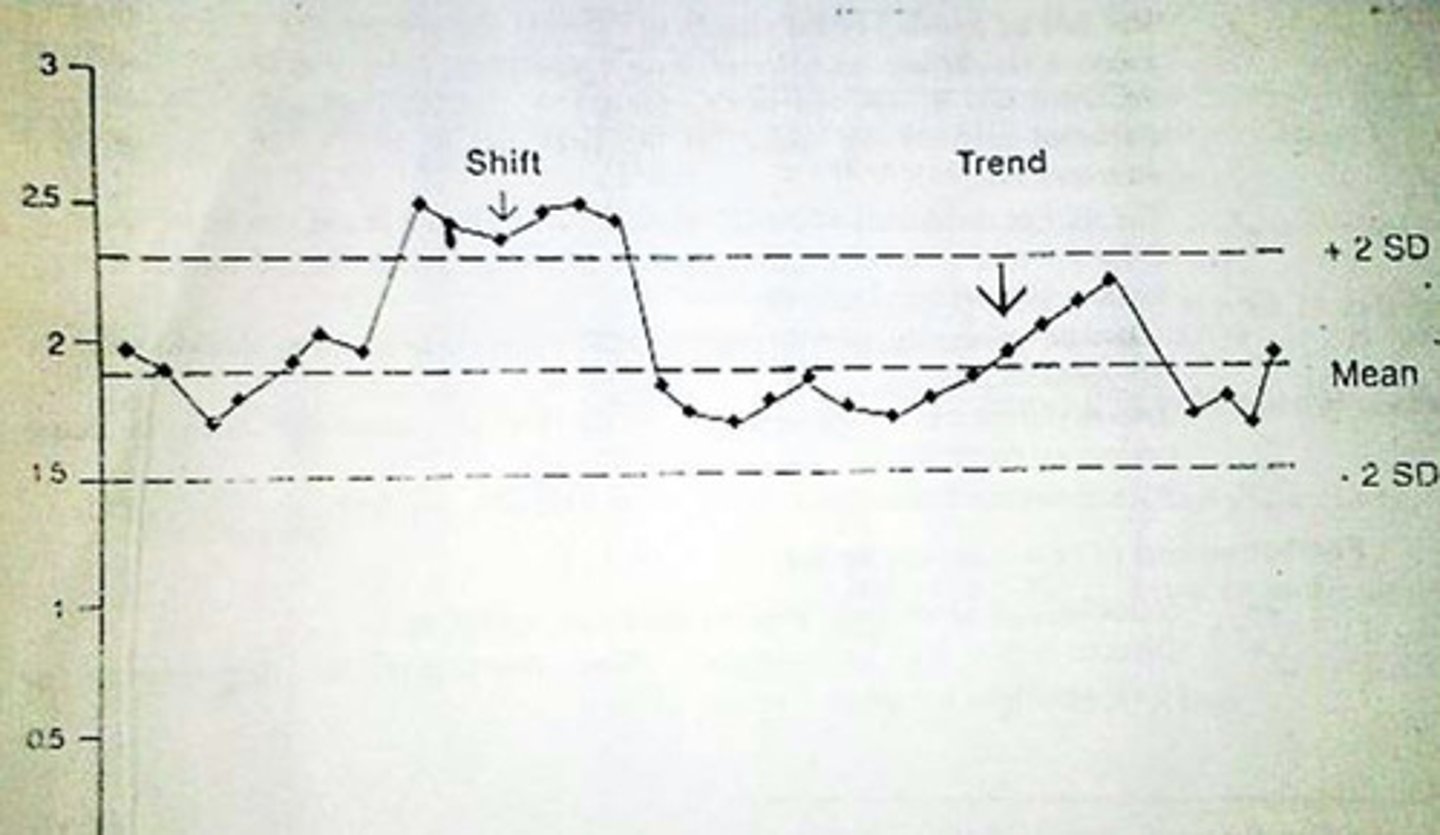
In a Levey Jennings Plot, systemic error can be described as a shift or trend. What is the difference between a shift and a trend?
1. shift: 4 or more consecutive values on 1 side of the mean
- the values have shifted to 1 side (upward or downward shift)
2. trend: 4 or more consecutive values that are either decreasing or increasing
- (upward or downward trend)
What does within run, across runs, within level, and across level mean?
1. within run: rule is applied to 1 control in a single run
- does this 1 control violate the Westgard Rule?
2. across run: rule is applied across multiple consecutive runs
- does run 1 AND 2 violate the Westgard Rule?
3. within level: rule applies to the whole level of runs
- Ex: only level 1 NOT level 2
4. across level: rule applies across all of the level of runs
- Ex: level 1 and level 2
- this means does level 1 AND 2 violate the Westgard Rule
What are the 6 Westgard Rules we will focus on? What are the applied rules? When are they rejected? Is it random or systemic error?
first number: # of controls
second number: SD value
1. 1₂ₛ: 1 control exceeds ± 2 SD
- applied: within run
- status of run: warning sign
- error indicated: random
2. 1₃ₛ: 1 control exceeds ± 3 SD
- applied: within run
- status of run: reject
- error indicated: random
3. 2₂ₛ: 2 consecutive controls exceeds 2 SD on the same side of the mean
- applied: within run, across runs, across levels
- status of run: reject
- error indicated: systematic
4. R₄ₛ: 1 control exceeds +2 SD and the other exceeds -2SD
- applied: within run, across levels (NOT across run)
- status of run: reject
- error indicated: random
5. 4₁ₛ: 4 consecutive controls exceed 1SD on the same side of the mean
- applied: across runs and levels
- status of run: reject
- error indicated: systematic
6. 10ₓ: 10 consecutive controls are on the same side of the mean
- applied: across runs and levels
- status of run: reject
- error indicated: systematic
- look at pg 9-2, RRS (forward direction) SSR (backward direction)
- any systemic errors are on the same side of the mean
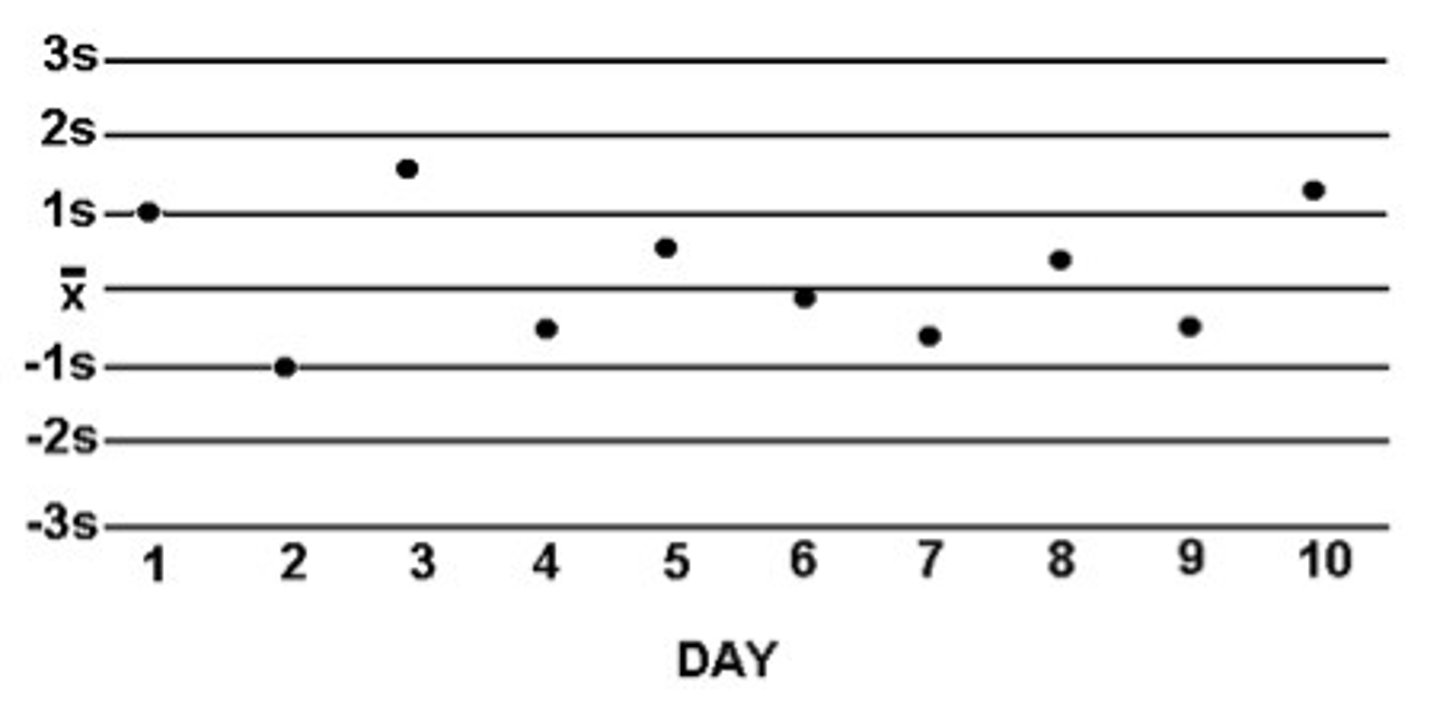
What is the goal for all your controls to be within (1 SD, 2SD, or 3SD?)
Goal: to have all values within 2 SD of the mean
What are the 7 steps to create a Levey-Jennings Chart?
1.
- y axis: control concentration values
- x axis: # of days/runs
2. calculate the mean
3. calculate ± 1SD, ± 2SD, ± 3SD
4. plot the mean as a solid black line
5. plot the SD as dotted black lines
6. plot the data and connect the lines
7. see if any data points violate Westgard rules
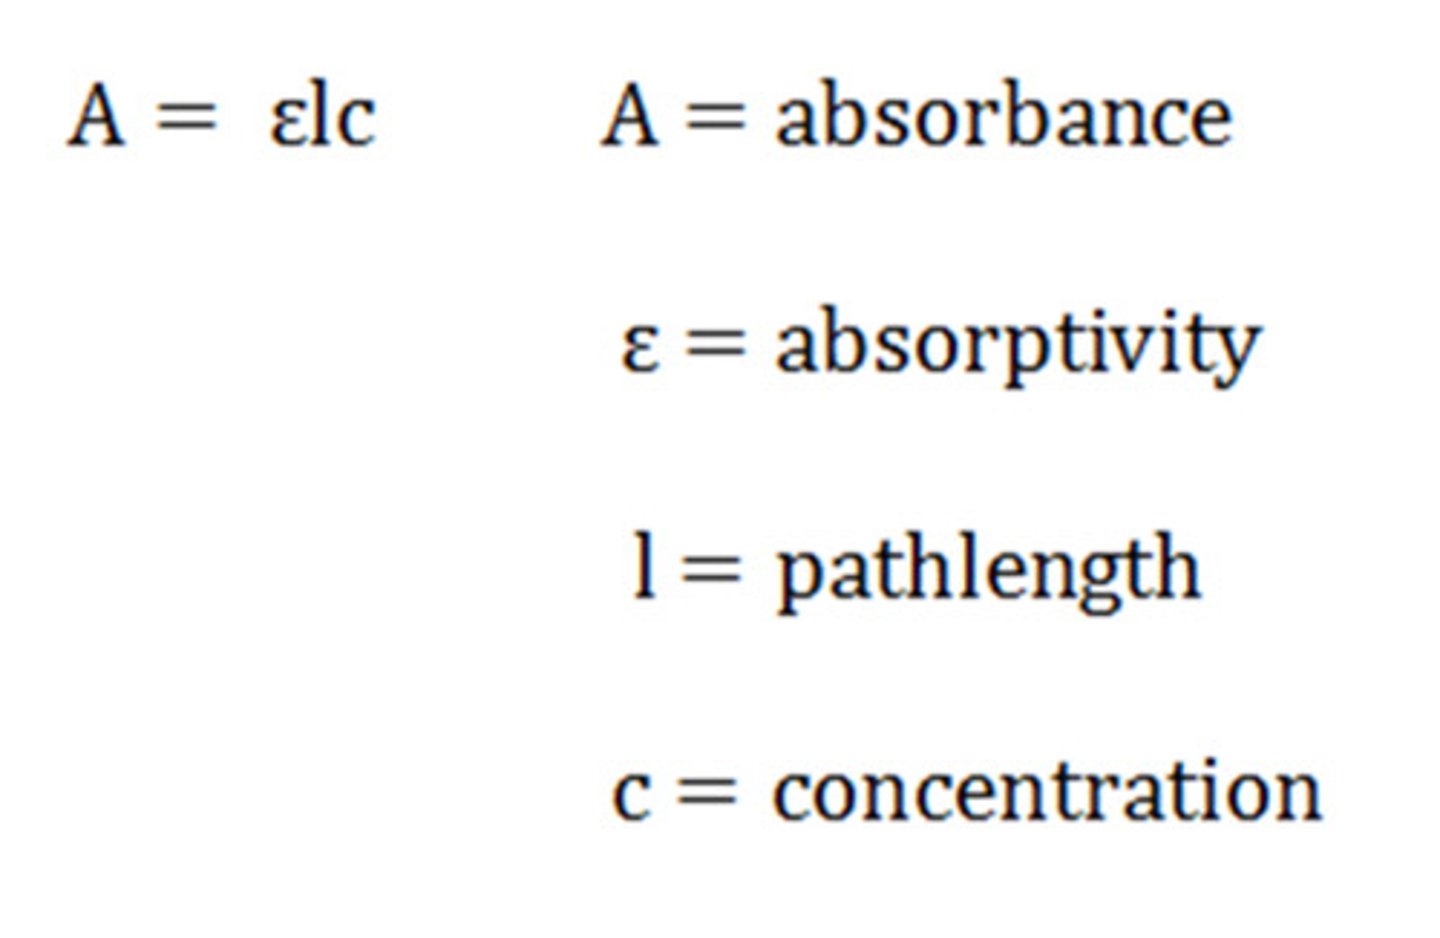
What is beers law?
A=εbc
- A: absorbance
- ε: extinction coefficient (measures how strongly a substance absorbs light)
- b: distance for the light to travel through the sample
- c: concentration
What is the k factor?
similar to ε: extinction coefficient
- k = A/C
Overall, what are the 7 steps to do the Total Protein Assay?
1. find the absorbance of standards, patients, and controls
- bracket samples!
2. calculate the k factor for each standard
- K = A/C
3. calculate the difference between the highest and lowest k factor so that the difference is < 0.004
- you may have to omit some values
4. take the average of all acceptable k values
5. Using the average k factor, find the concentration of every sample
- C = A/K
6. check to see if the values are acceptable
7. if acceptable, report patient results
What is in a reagent blank?
volume of reagent + volume of water that equals the volume of standard/patient/control added
Example
- Standard: 10 mL of Biuret reagent + 20 mL of standard
- Control: 10 mL of Biuret reagent + 20 mL of control
- Reagent Blank: 10 mL of Biuret reagent + 20 mL of water
When running a set of samples in a spectrophotometer, you should always bracket your samples. What does bracket mean?
- have known values at the start and at the end of your batch
- Ex: standards, patient, controls
- Note: batch is everything you set up at 1 time NOT what you put in the spectrophotometer
Switching to Method Validation: Reference Ranges, Interference and Recovery Experiments, Glucose Assay
What is a reference range?
the acceptable range of values for a test based on a population of healthy people
- Ex: women's height, male's weight, children's anxiety
- considered "normal range"
How do you make reference ranges?
1. identify potential outliers
2. calculate central tendency
3. do a Gaussian distribution ±2 SD that includes 95% of the people's values
- Note: a reference range is different for each test and lab space
If 95% of the people's values fall under the distribution, how many healthy people will be out of the range?
1 out of 20 healthy people will have values outside the reference range
What is the difference between a reference range and a reportable range?
- reference range: a range that includes 95% of the people's values
- reportable range: finding the linear range of the test (highest and lowest accurate value)
What is a critical value?
a value outsides the normal range that may be critical to a person's health
What is the goal of method validation?
to do error assessment on the new machine/method
What are the 4 steps on how to run a method validation?
1. check for errors in precision and accuracy
- precision: run multiple controls (2 controls run 2 times a day for 10 days)
- accuracy: interference or recovery experiment
2. run a comparison method studies
3. check linearity limit
4. check detection limit: the smallest amount of analyte that can be detected
What is an interference study? What does it measure?
- determines if the interfering substance affects the assay
- helps measure the constant systematic error (error is constant regardless of the concentration of the analyte added)
How do you run a interference study?
1. have 2 identical solutions containing the analyte
2. put an aliquot of interfering substance into 1 of them and put water into the other
3. calculate the difference between the interference and blank concentration to find the bias
- is it falsely higher or lower
How do you run a interference study with duplicate samples?
1. have 2 identical solutions containing the analyte
2. put an aliquot of interfering substance into 1 of them and put water into the other
3. average the duplicate concentrations
4. calculate the difference in concentration
5. calculate the average difference among all the samples
6. compare the average difference with the amount of error allowable
What is a recovery study? What does it measure?
- determines how much analyte is recovered in the presence of the sample
- measure proportional systematic error
How do you run a recovery study?
1. have 2 identical solutions containing the analyte
2. put an aliquot of analyte into 1 of them so its "spiked"
3. calculate the amount of analyte added by multiplying the concentration of the standard by the whole dilution
4. find the concentration of the solution with and without spike
5. calculate the concentration recovered
- [ ] with spike - [ ] without spike
6. calculate the percent recovery
- ([ ] recovered/[ ] analyte added) x 100
How do you run a recovery study with duplicate samples?
1. have 2 identical solutions containing the analyte
2. put an aliquot of analyte into 1 of them so its "spiked" and put water into the other
3. calculate the amount of analyte added by multiplying the concentration of the standard by the dilution
4. find the concentration of the solution with and without spike
5. average the [ ] of solutions with and without spike for duplicates
6. calculate the concentration recovered
- [ ] with spike - [ ] without spike
7. calculate the percent recovery
- ([ ] recovered/[ ] analyte added) x 100
8. average the percent recovery for duplicates
9. calculate the proportional error
- 100% - average % recovery
10. compare the average difference with the amount of error allowable
Why wouldn't analyte be recovered?
- the sample can react negatively with the analyte
What is an comparison of method study? What does it measure?
- compare the newly selected method to the current one using real patient samples in order to see if there are any systematic differences
- measures random error (scatter around the best fit line), constant systematic error (did the y intercept change), and proportional systematic error (did the slope of the line change)
How do you run a comparison of method studies?
1. make a graph
- Y axis: test method (new)
- X axis: reference method (old)
2. see if the error is random (scatter), constant systematic error (y-intercept), or proportional systematic error (slope)
3. calculate the correlation of coefficient (r)
- y = mx+b
- Ideal: b = 0 and slope = 1
For the glucose assay, what is the background behind the chemical reactions?
1. β-D-Glucose is oxidized by glucose oxidase to form D-Gluconic acid and hydrogen peroxide
2. in the solution, 64% of glucose is in the β form and 36% is in the α
3. to convert α to β, incubation or the enzyme mutarotase is needed
For the glucose assay, what 2 chemical reactions are taking place? How will this allow us to measure the glucose levels?
1. β-D-Glucose + O₂ + H₂O + glucose oxidase (enzyme) → D-gluconic acid and H₂O₂
2. H₂O₂ + 4-aminoantipyrine + phenyl + peroxidase (enzyme) → H₂O + iminoquinone
- the iminoquinone is the substance that changes the solution into a red-purple color
How? more glucose in the solution means more iminoquinone color change
What is sensitivity? How do you calculate it?
the ability of a test to detect a disease
- true positive
true positives / (true positives + false negatives) x 100
What is specificity? How do you calculate it?
ability of a test to detect the absence of a disease
- true negative
true negatives / (true negatives + false positives)
What is the difference between analytical and clinical sensitivity?
1. analytical: measures the detection limit (the smallest amount of analyte that can be detected)
2. clinical: finds the proportion of individuals with the disease who test positive
What is the difference between analytical and clinical specificity?
1. analytical: the ability of a method to react only with the analyte
2. clinical: finds the proportion of individuals without the disease who test negative
What is a false positive? What is a false negative?
- false positive: not positive, its actually negative
- false negative: not negative, its actually positive
What is a positive predictive value? How do you calculate it?
probability of having a disease given a positive test result
true positive/ (true positive + false positive) x 100
What is a negative predictive value? How do you calculate it?
probability of not having a disease given a negative test result
- true negative/ (true negative + false negative) x 100
Are sensitivity/specificity disease dependent or are predictive values?
disease dependent: the values depend on the prevalence of the condition in the population
predictive values
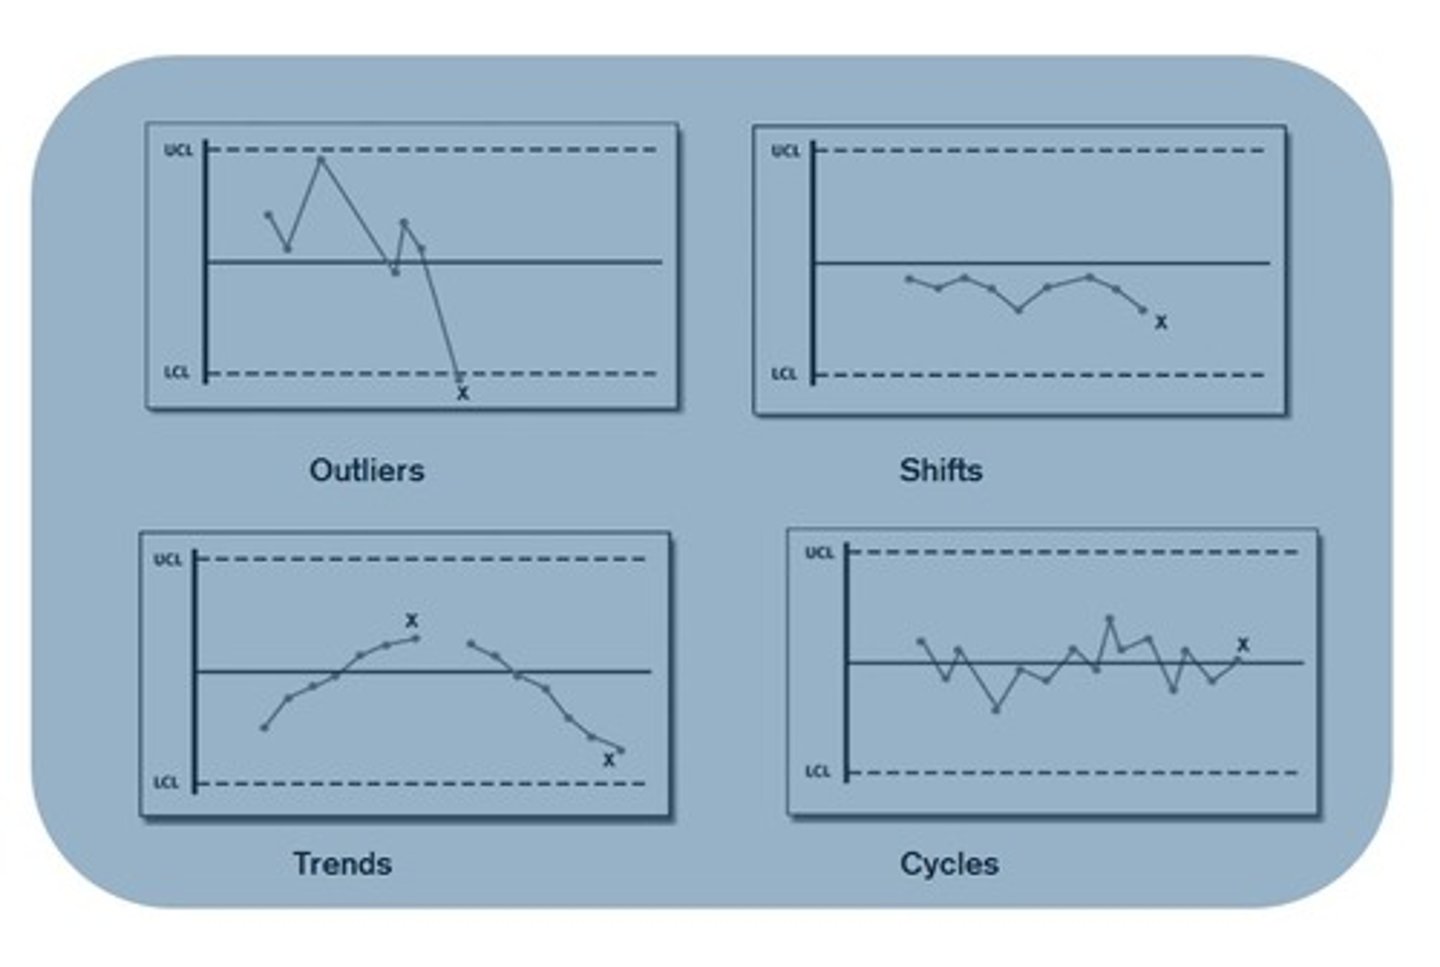
What can cause shifts in QC values?
1. new reagents
2. method not calibrated
3. something is wrong with the machine/pipette
What can cause trends in QC values?
1. deterioration of the reagent
2. lens getting dirtier
3. contamination over time