AP Statistics - Bell Curves and Analysis of Data
1/11
There's no tags or description
Looks like no tags are added yet.
Name | Mastery | Learn | Test | Matching | Spaced | Call with Kai |
|---|
No analytics yet
Send a link to your students to track their progress
12 Terms

Percentile
The percent of values less than a specific value in the dataset.
The formula is: # of values lower than percent/total number of values

Z-score
A measure that describes how many standard deviations a data point is from the mean of a dataset.
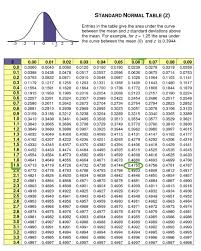
Z-score formula
Z = (X-average)/Sx

When you + / - from EVERY data point
The center changes, everything else is the same

When you * / / from EVERY data point
Spread and center change, the shape stays the same
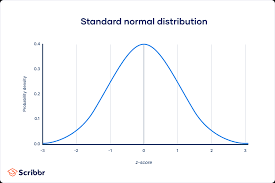
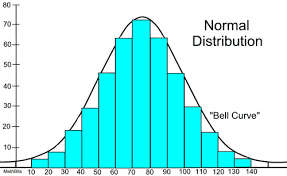
Normal distribution
A probability distribution that is symmetric around the mean, showing that data near the mean are more frequent in occurrence than data far from the mean. It follows a bell-shaped curve.
Imperial rule
A statistical rule that states that for a normal distribution, approximately 68% of the data falls within one standard deviation of the mean, about 95% within two standard deviations, and about 99.7% within three standard deviations.
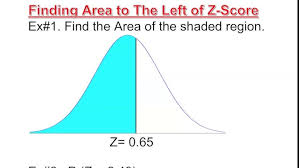
When a question asks if something is less than z-score (left)
The value is okay to keep as the solution to find the left area of a bell curve
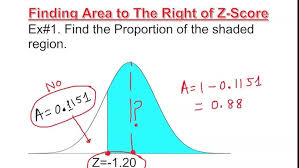
When a question asks if something is more than z-score (right)
You must do 1-z-score probability to find the right area of a bell curve.
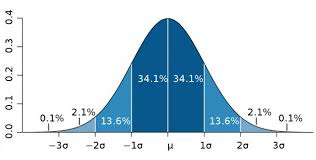
Bell curve values
0.15, 2.35, 13.5, 34, 34, 13.5, 2.35, 0.15
Normality
A key assumption in statistical analysis, indicating that data should follow a normal distribution to apply certain statistical tests effectively.
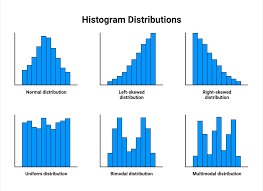
Abnormality
A key assumption in statistical analysis, indicating that data should not follow a normal distribution.