STA 147 - Ch 3.2: Measures of Dispersion (Mean, Median, Mode) and Empirical Rule
1/35
There's no tags or description
Looks like no tags are added yet.
Name | Mastery | Learn | Test | Matching | Spaced | Call with Kai |
|---|
No analytics yet
Send a link to your students to track their progress
36 Terms
(EXAMPLE/PRACTICE from 3.1) Comparing Two Sets of Data:
To order food at a McDonald’s restaurant, one must choose from multiple lines, while at Wendy’s Restaurant, one enters a single line. The following data represent the wait time (in minutes) in line for a simple random sample of 30 customers at each restaurant during the lunch hour. For each sample, answer the following:
(a) What was the mean wait time?
(b) Draw a histogram of McDonald's wait time.
(c) Draw a histogram of Wendy's wait time.
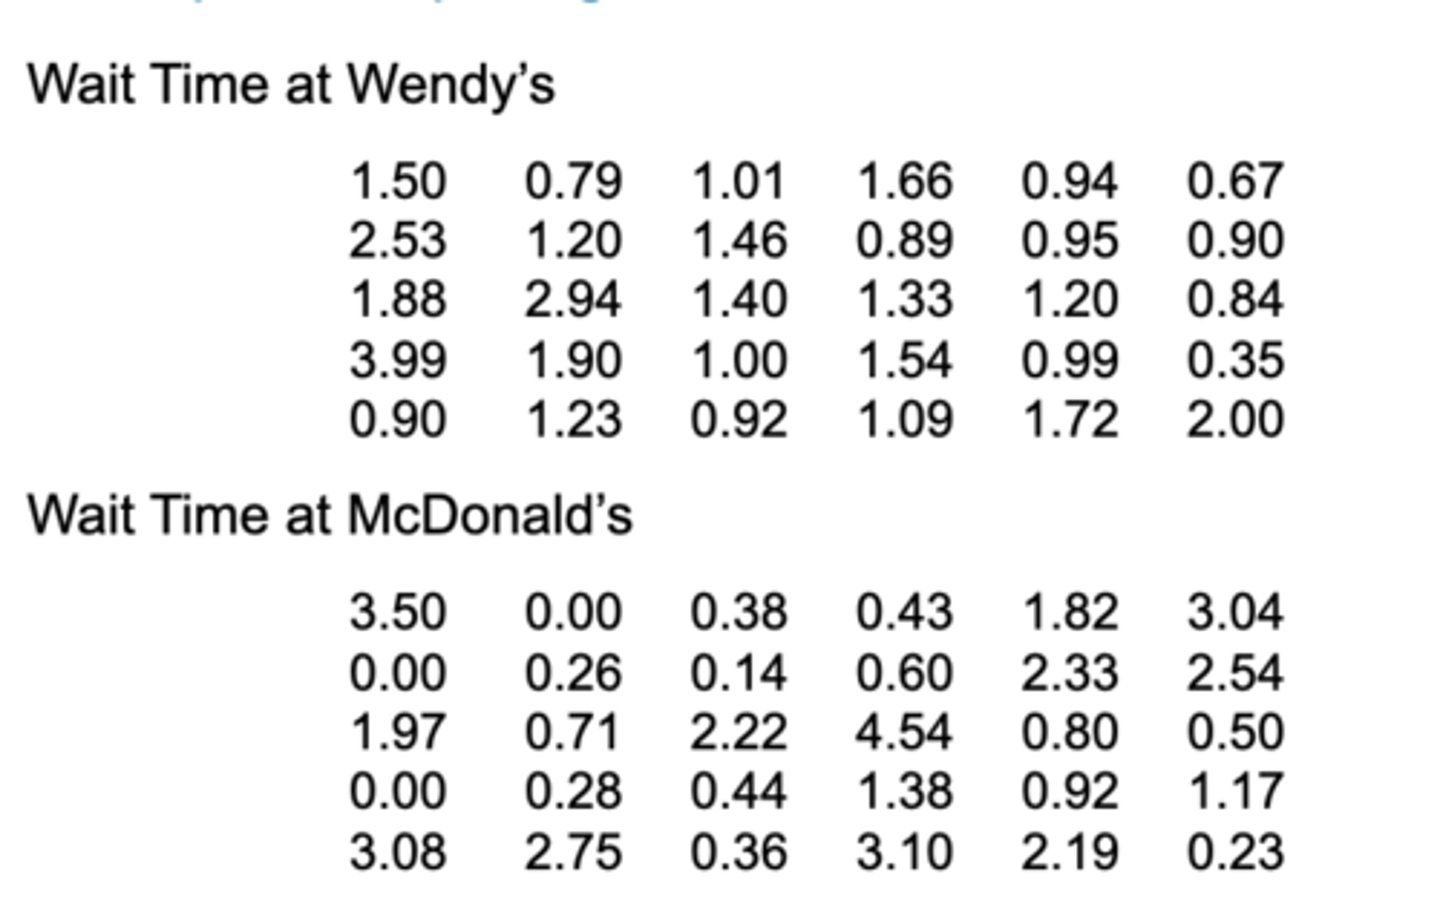
(a) What was the mean wait time?
1.39 minutes.
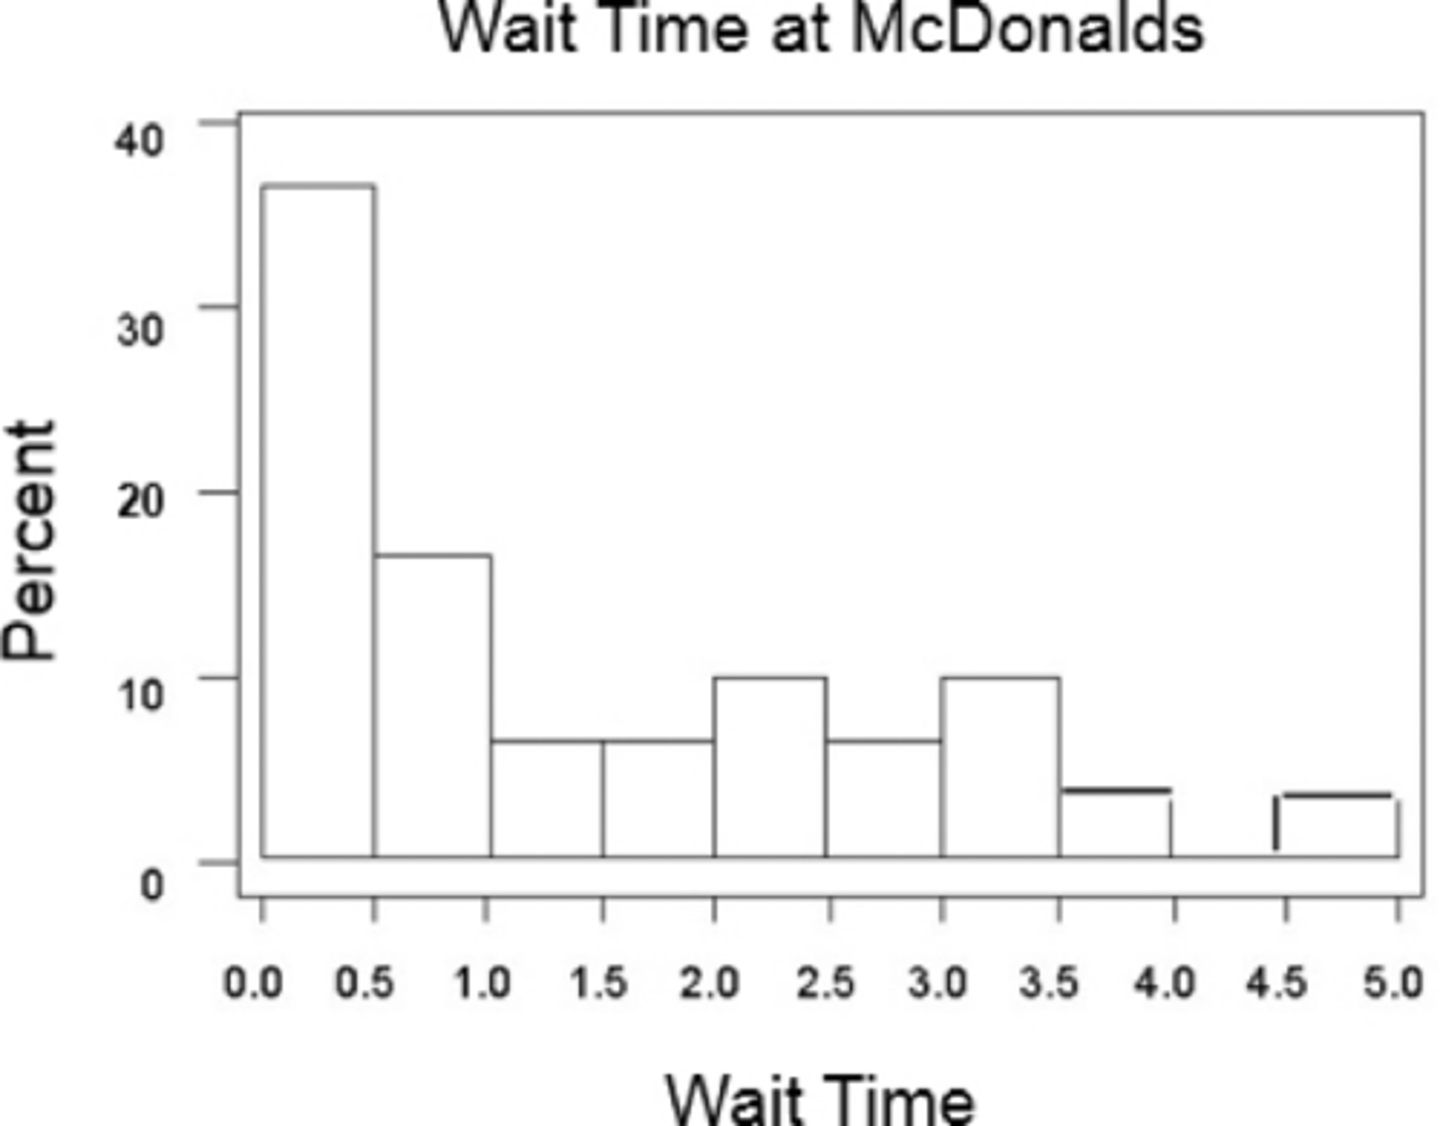
(b) Draw a histogram of McDonald's wait time.
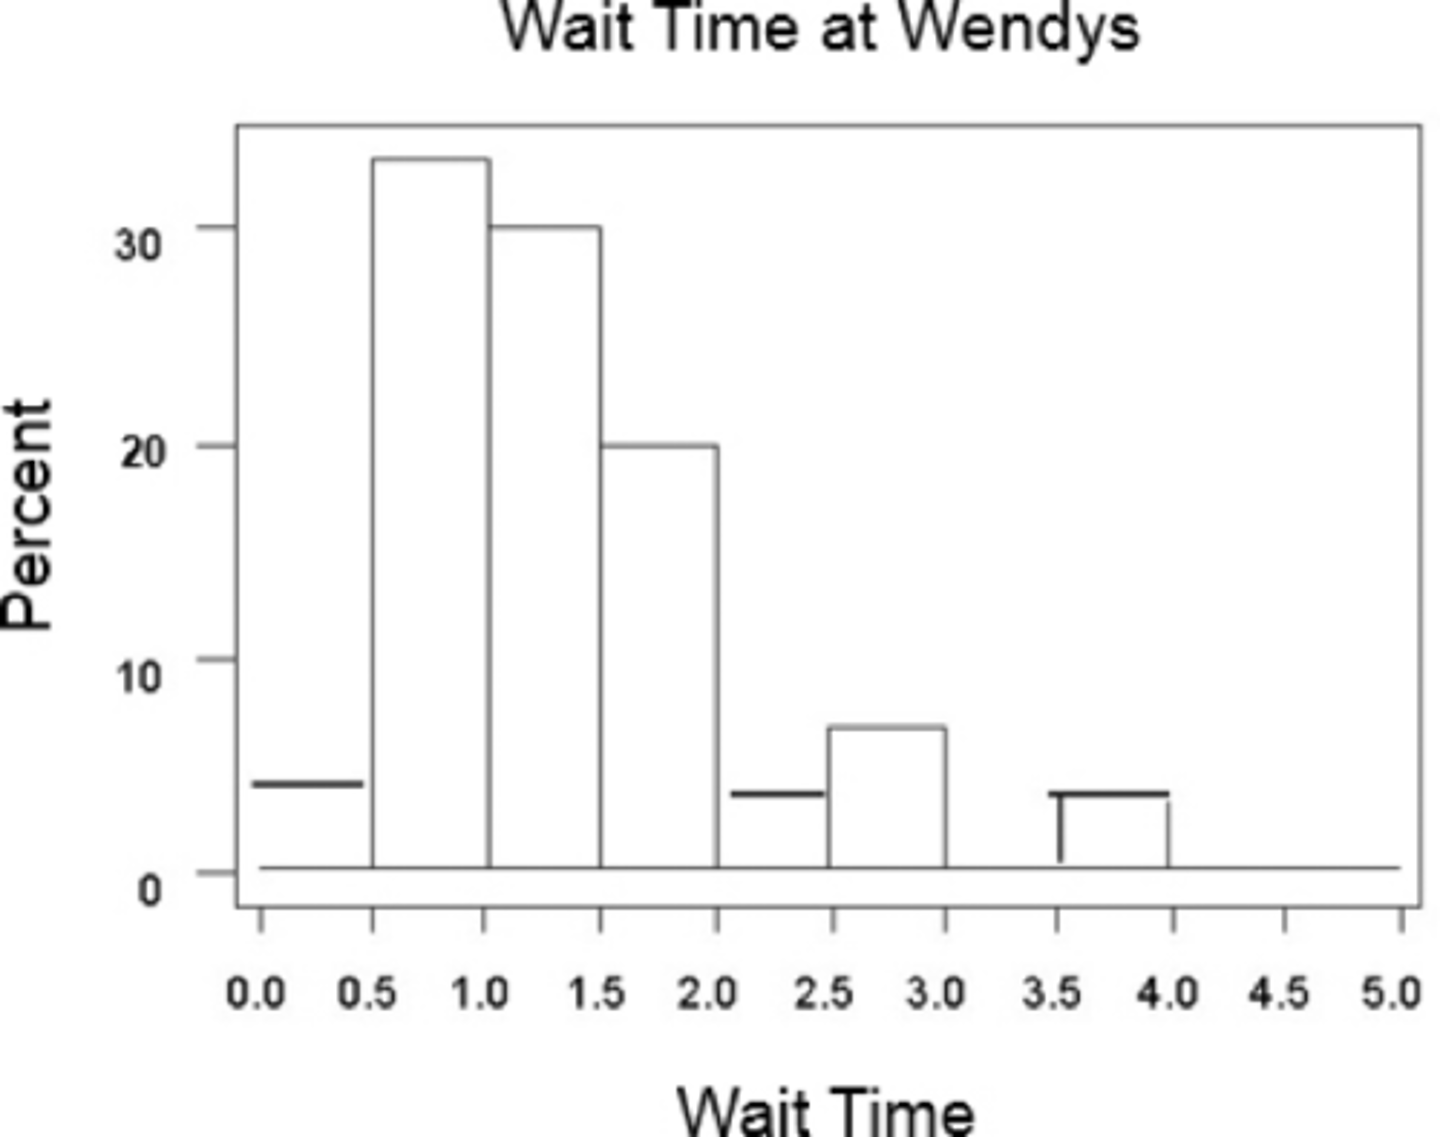
(c) Draw a histogram of Wendy's wait time.
What is the RANGE of a variable?
Largest data value − Smallest data value
Range is generally not considered a great measure; why?
because no matter how large your data set is, you are only using two values to compute it. However, it can give us a rough idea of what’s going on sometimes.
EXAMPLE Finding the Range of a Set of Data
The following data represent the travel times (in minutes) to work for all seven employees of a start-up web development company.
23, 36, 23, 18, 5, 26, 43
(a) Find the Range
(a) Range is 7
43 - 36 = 7
Standard Deviation
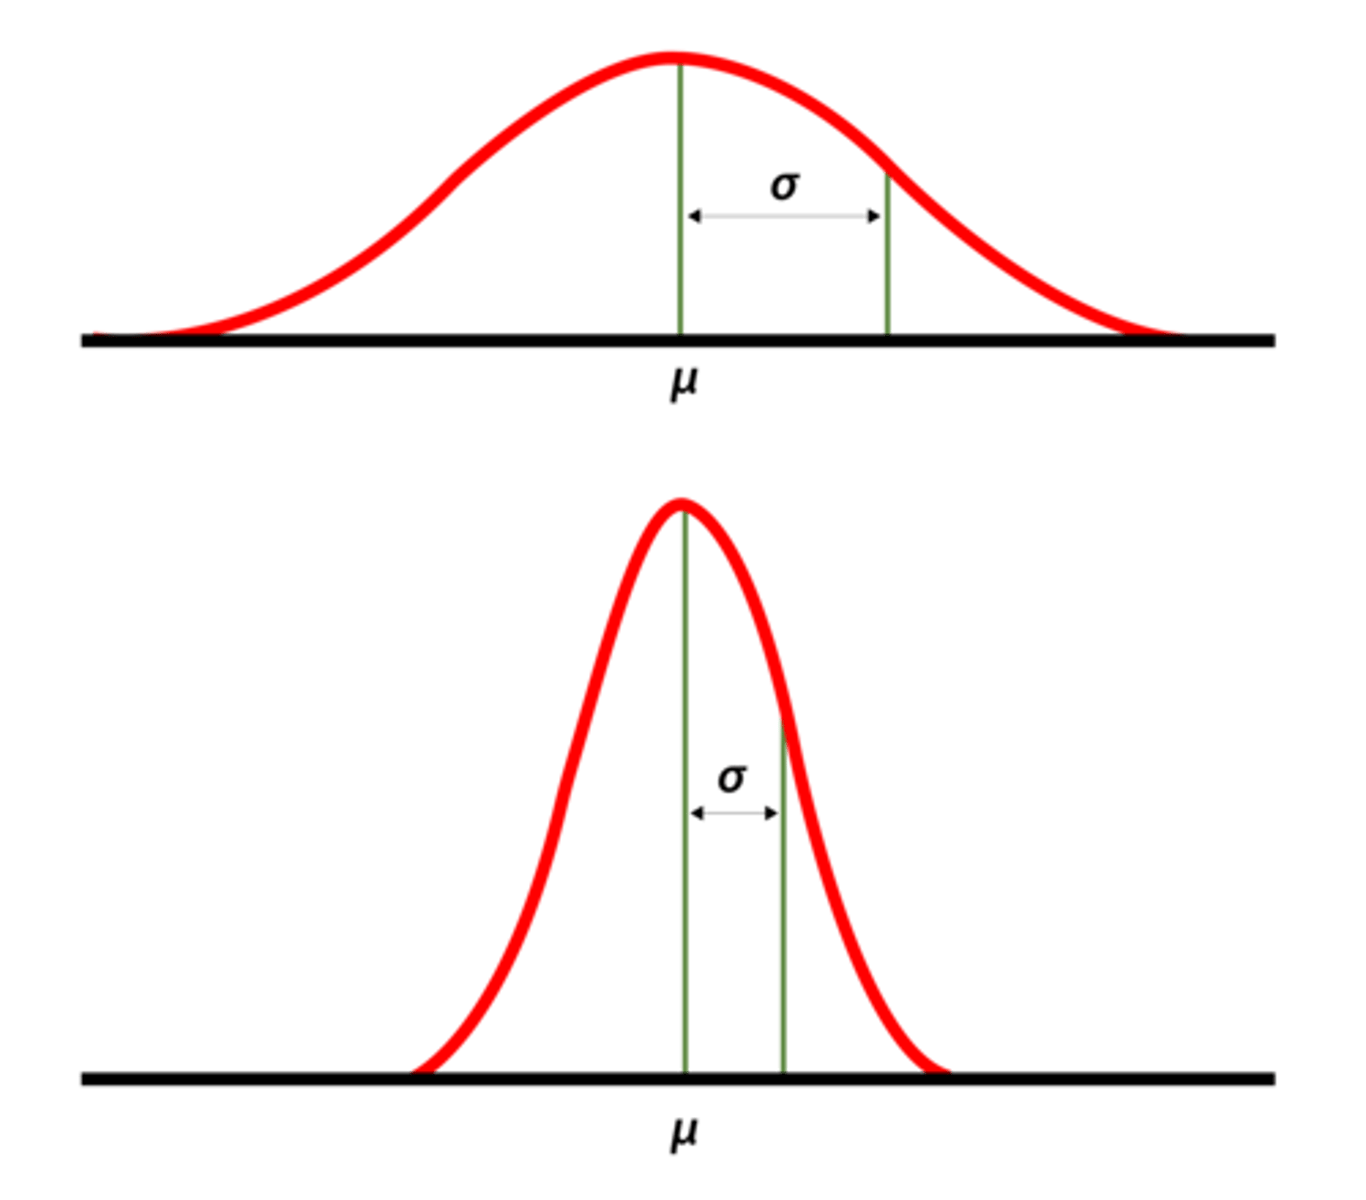
describes how spread out the data is in relation to the mean
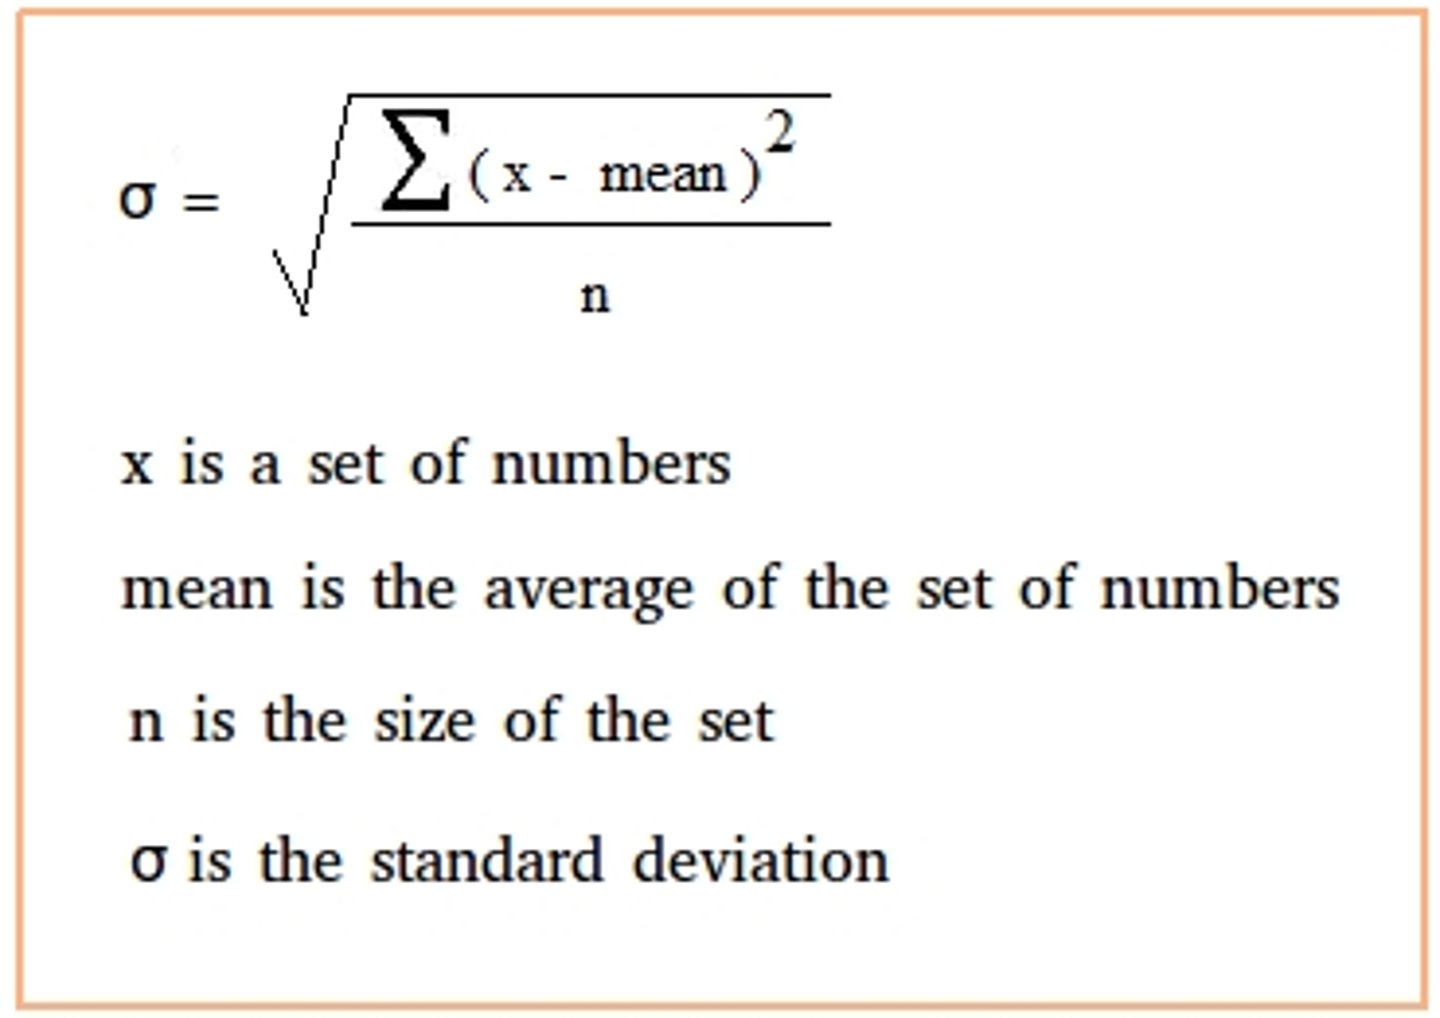
How do you find Standard Deviation?
squaring the difference between value(s) and the mean, then dividing it by the # of values
Low/small standard deviation indicates data will appear as...
clustered tightly around the mean
high/large standard deviation indicates data will appear as...
more spread out around the mean
Two types of standard deviations
Population standard deviation
Sample standard deviation.
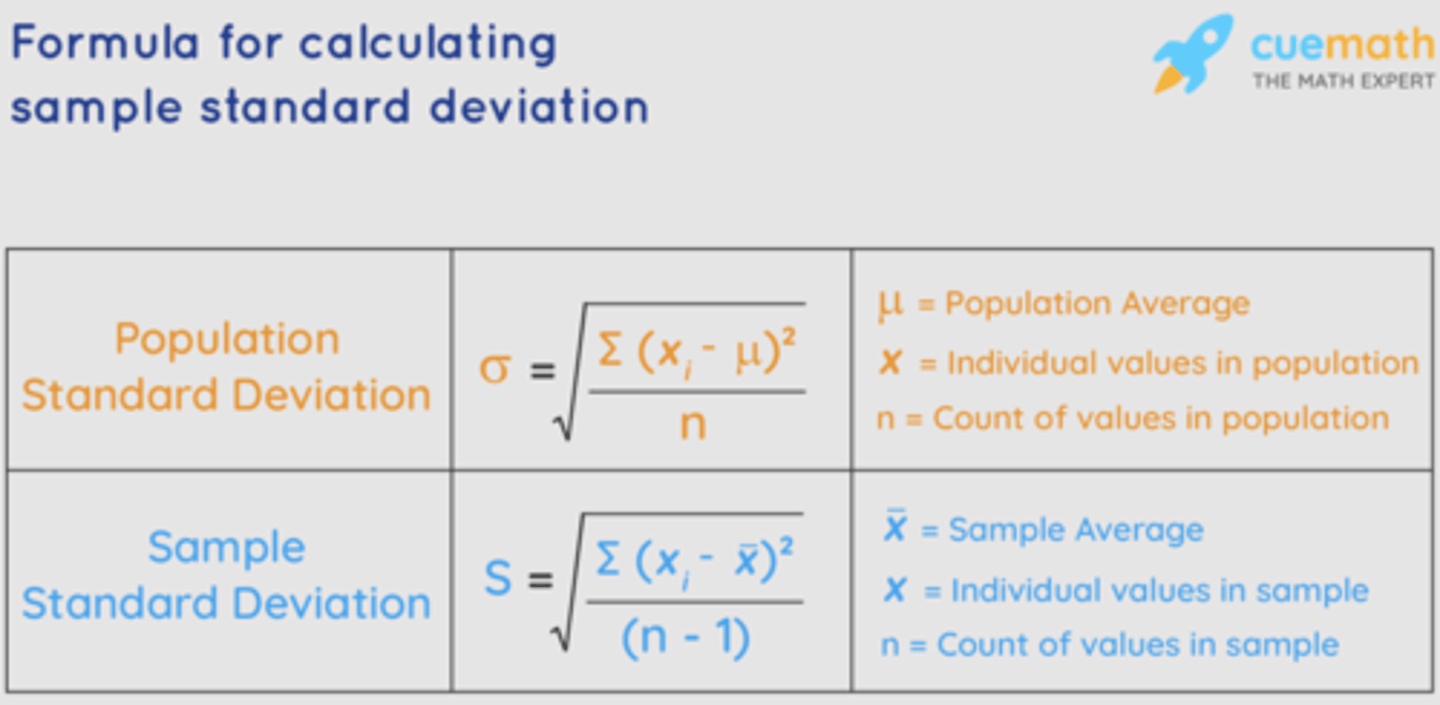
What is the Population Standard Deviation?
A statistical term that basically tells you how spread out the values of a variable are across an entire group of things (like all the people in a city), on average, compared to the "average" value of that group
What symbol represents POPULATION Standard Deviation?
σ (lowercase Greek sigma)
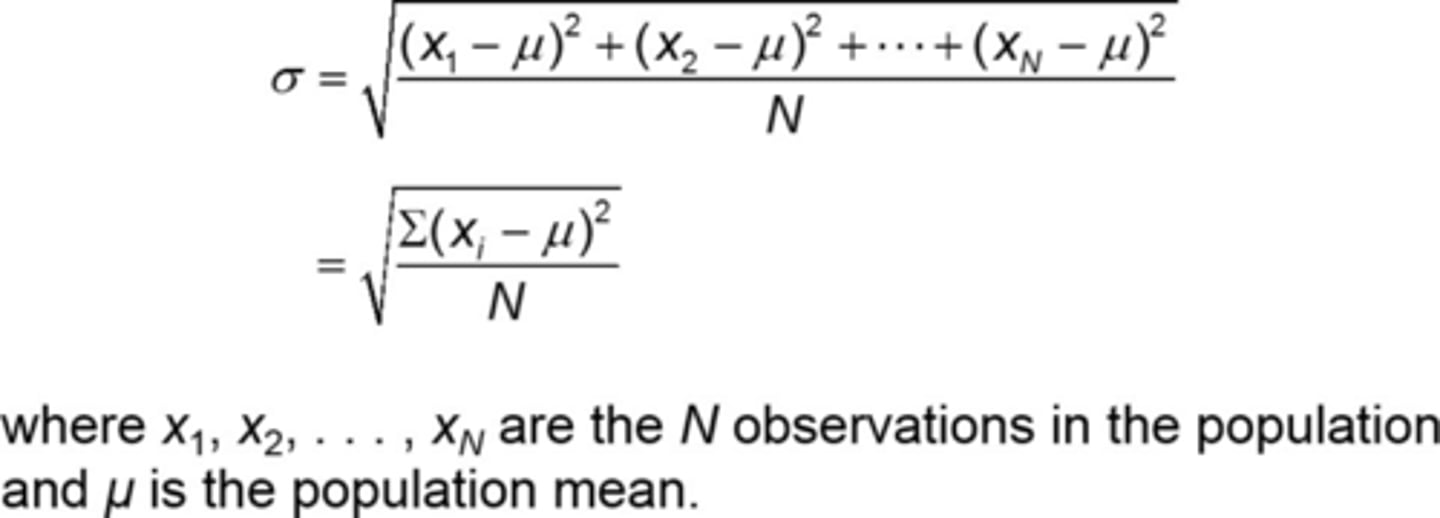
How do you calculate PSD?
1. subtract each individual observation (data point) by the population mean.
2. square the difference to eliminate negative values.
3. Add all squared differences together
4. Divide by the N (number of observations)
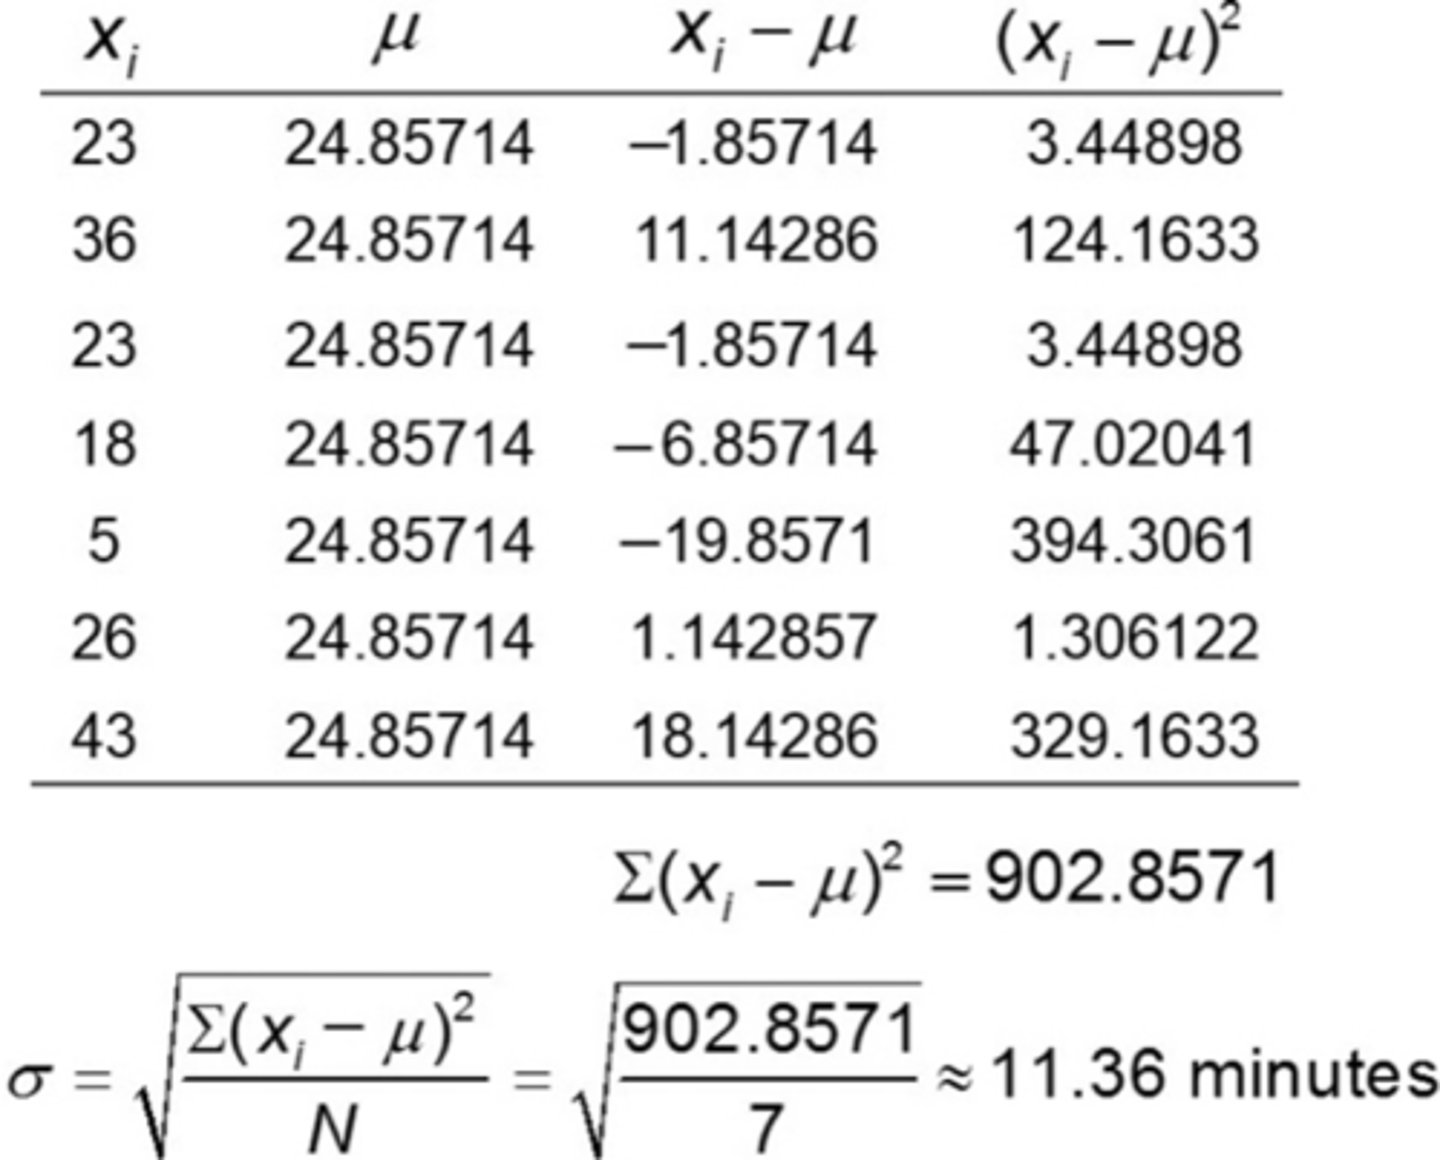
EXAMPLE Computing a Population Standard Deviation
The following data represent the travel times (in minutes) to work for all seven employees of a start-up web development company.
23, 36, 23, 18, 5, 26, 43
a) Compute the population standard deviation of this data. (You will never be asked to compute this by hand, but here it is shown. Also, there is no function for this on minitab, so look up standard deviation calculator and press the first link)
(a) μ
What is the Sample Standard Deviation?
The standard deviation of a sample set
What symbol represents SAMPLE Standard Deviation?
s
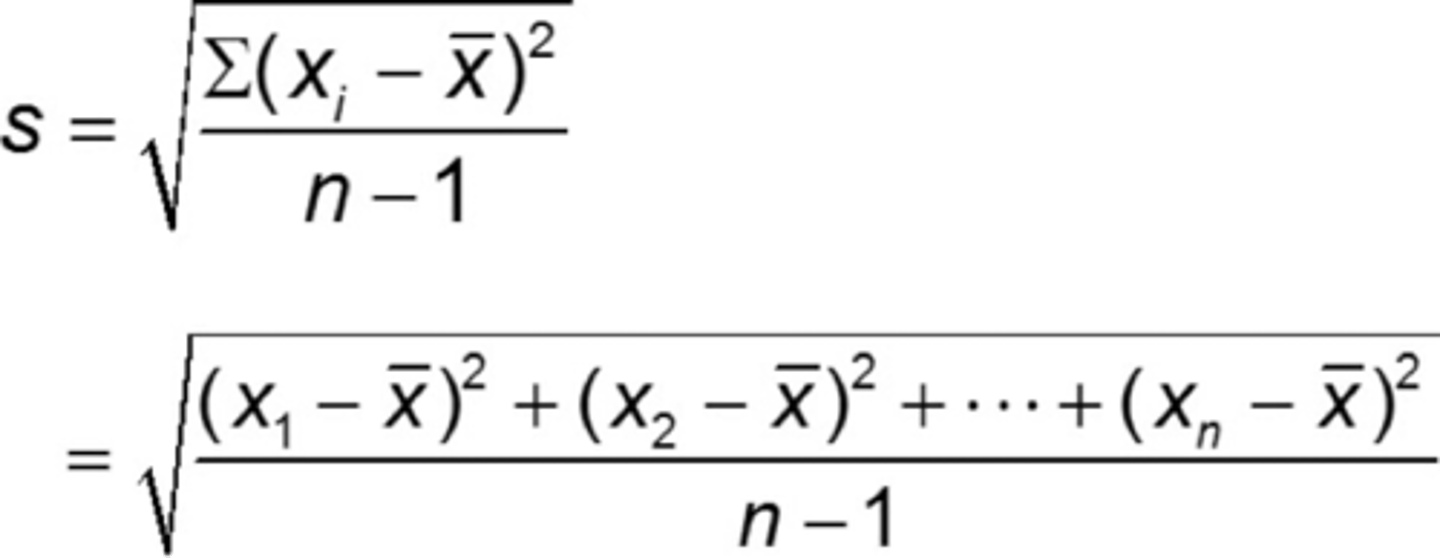
How do you calculate Sample Standard Deviation?
1. Calculate the mean (simple average of the numbers).
2. For each number: subtract the mean and square the obtained result.
3. Sum up all of the squared results.
4. Divide this sum by one less than the total number of data points (n - 1). This will give us the sample variance.
5. Take the square root of this value to get the sample standard deviation.
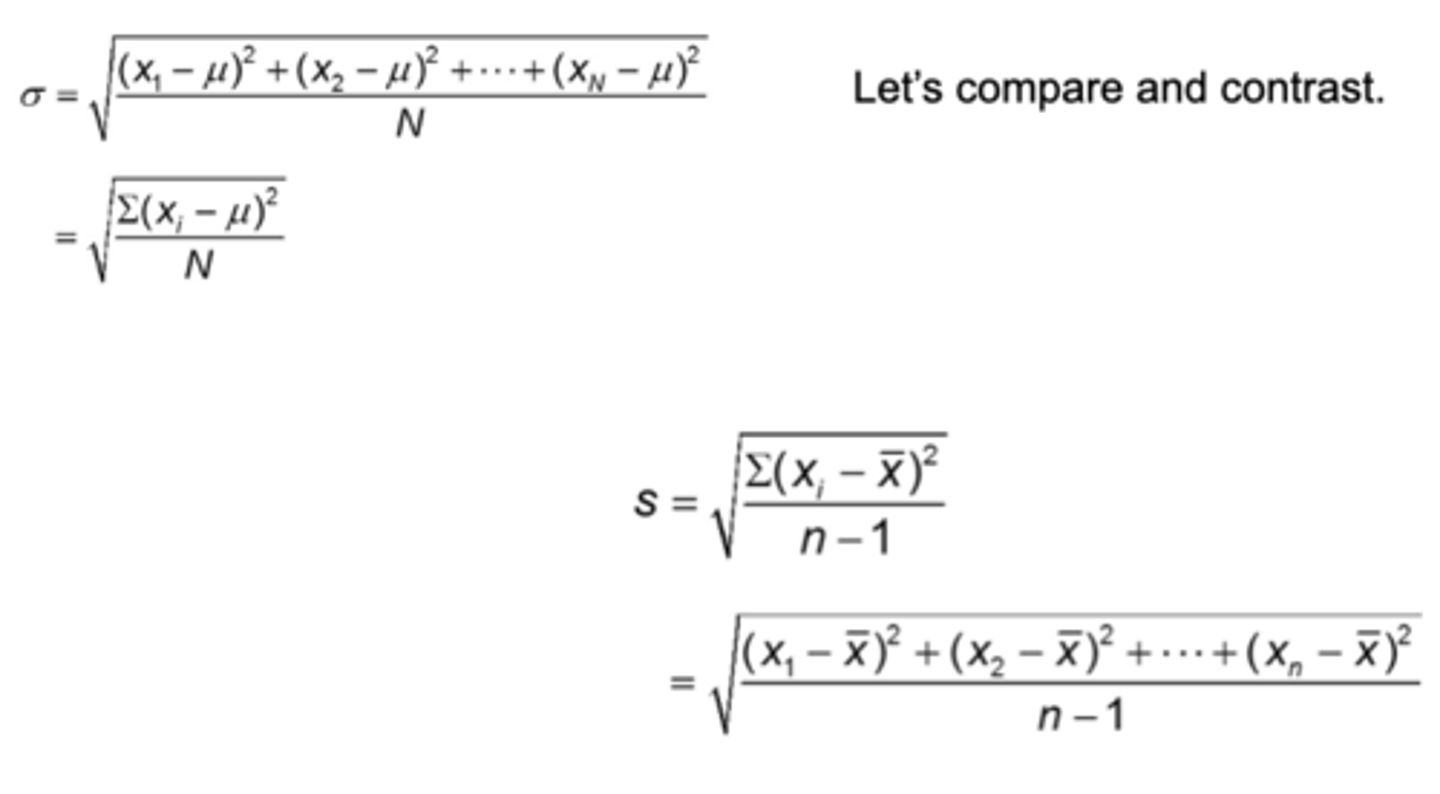
What is the difference between the Population and Sample standard deviation formula?
While calculating the population standard deviation, we divide by n, the number of data values. For calculating the sample standard deviation, we divide by n -1 i.e., one less than the number of data values.
s is a Statistic. Why?
Because it is of a numerical summary SAMPLE.
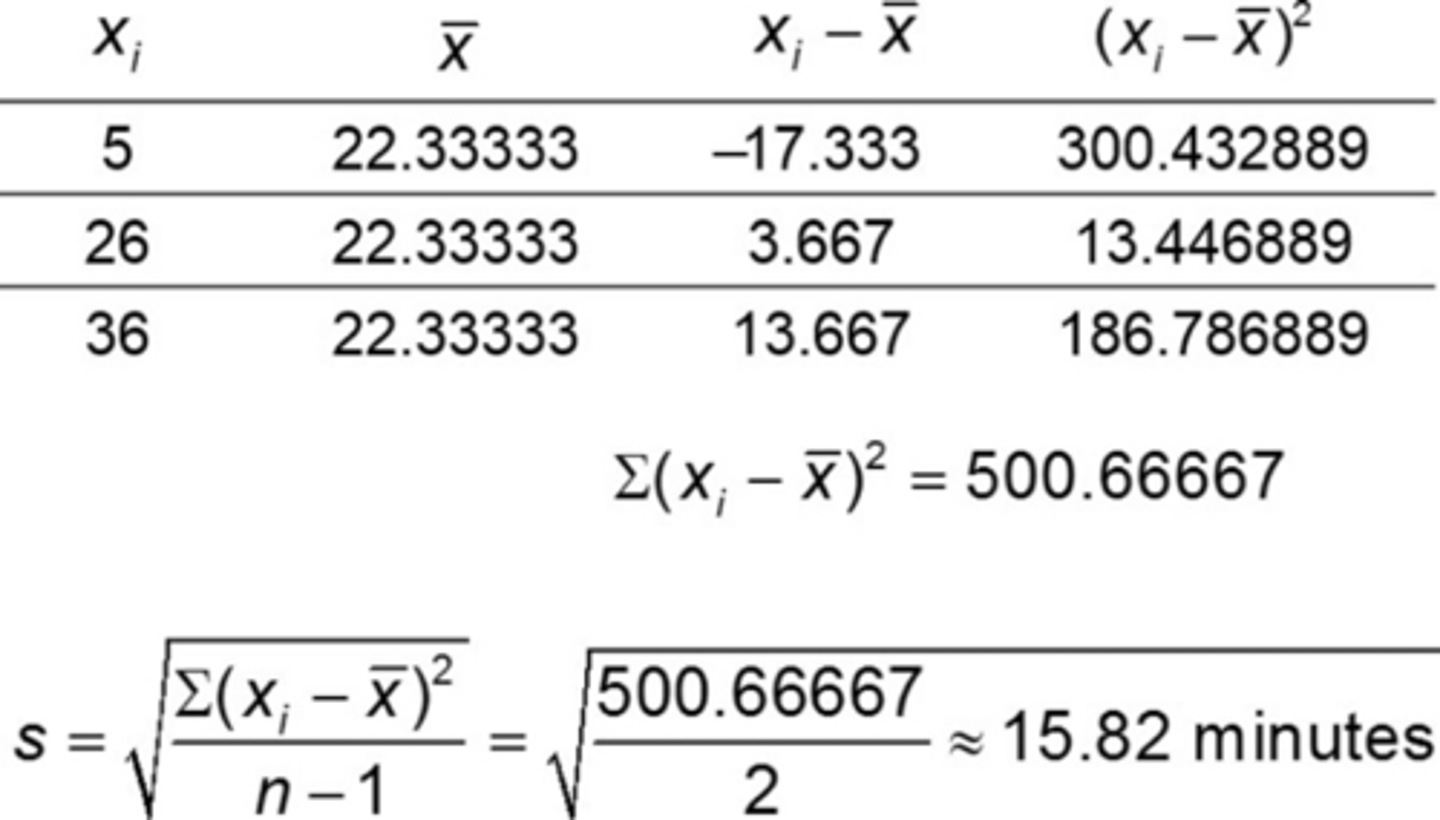
EXAMPLE Computing a Sample Standard Deviation
Here are the results of a random sample taken from the travel times (in minutes) to work for all seven employees of a start-up web development company:
5, 26, 36
(a) Find the sample standard deviation.
(a)
EXAMPLE Comparing Standard Deviations
Determine the standard deviation waiting time for Wendy’s and McDonald’s. Which is larger? What does this actually mean?
Sample standard deviation for Wendy's:
0.738 minutes
Sample standard deviation for McDonald's:
1.265 minutes
Recall from earlier that the data is more dispersed for McDonald's resulting in a larger standard deviation.
- Larger standard deviations indicate "less consistency".
- Smaller standard deviations indicate "more consistency".
- Standard deviations are more helpful as a comparison.
Variance
its literally just the square of the standard deviation.
What is population variance symbol?
σ2
What is sample variance symbol?
s2
EXAMPLE Computing a Population Variance
The following data represent the travel times (in minutes) to work for all seven employees of a start-up web development company.
23, 36, 23, 18, 5, 26, 43
(a) Compute the population and sample variance of this data.
(b) Consider the previous sample of 5, 26, 36.
σ = 11.36 so the population variance is σ2 = 129.05 minutes
s = 15.82, so the sample variance is s2 = 250.27 minutes
The Empirical Rule is ONLY USED on what shape of distribution?
Bell-shape
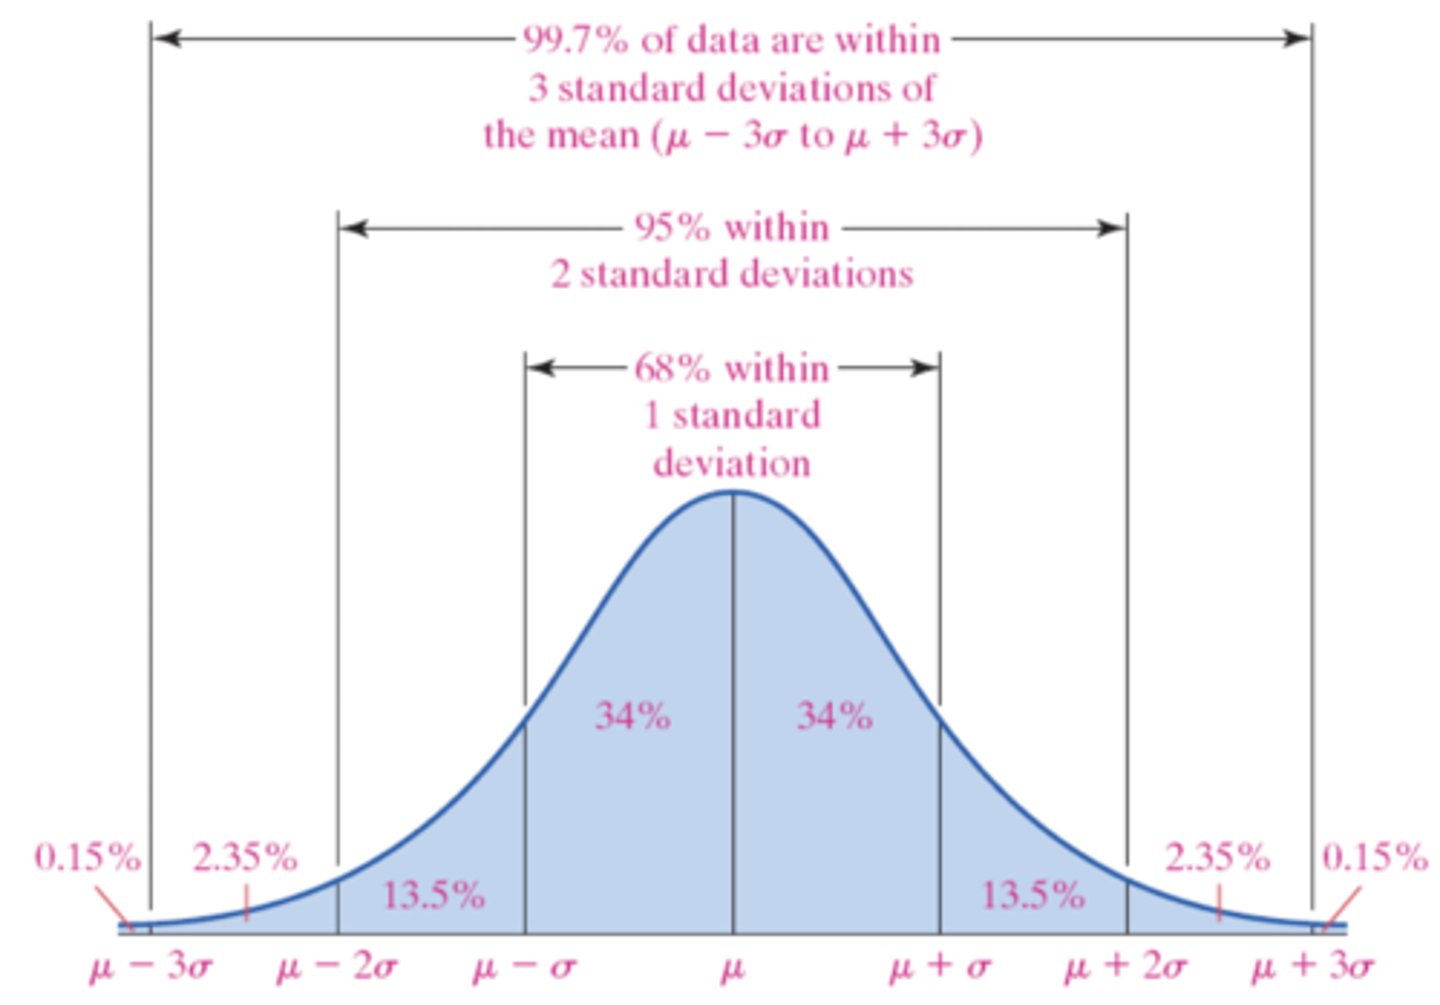
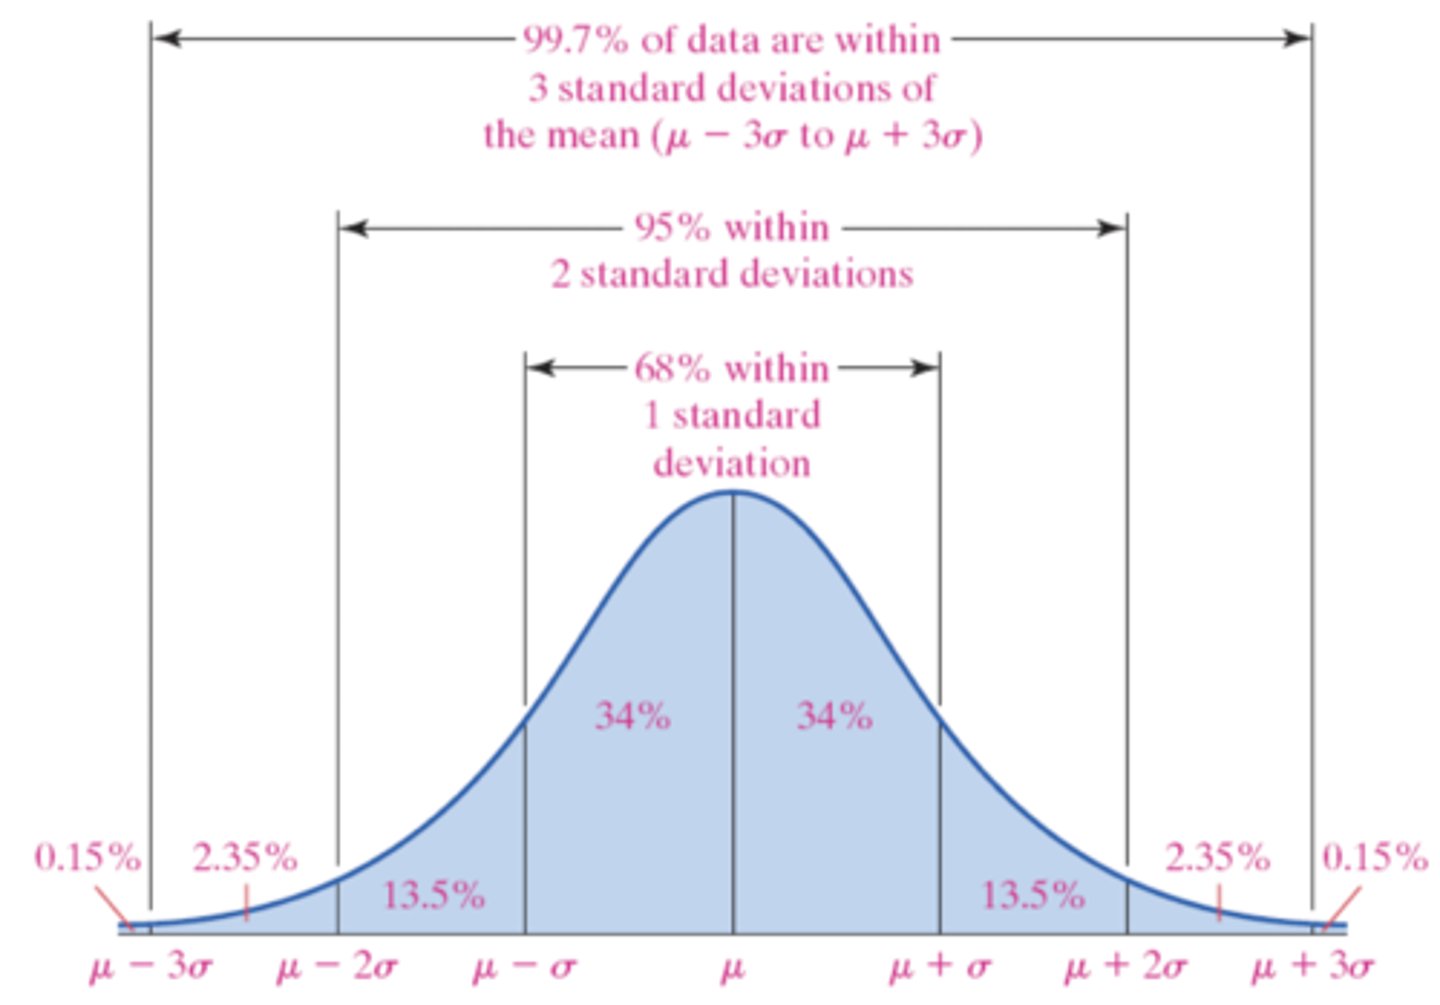
The Empirical Rule states that:
If a distribution is roughly bell shaped, then....
• Approximately 68% of the data will lie within 1 standard deviation of the mean → (68% of the data lie between μ − 1σ and μ + 1σ.)
• Approximately 95% of the data will lie within 2 standard deviations of the mean → (95% of the data lie between μ − 2σ and μ + 2σ)
• Approximately 99.7% of the data will lie within 3 standard deviations of the mean → (99.7% of the data lie between μ − 3σ and μ + 3σ)
NOTE: We can use the Empirical Rule based on sample data with a simple swap of symbolic properties (
EXAMPLE Using the Empirical Rule
The following data represent the serum HDL cholesterol of the 54 female patients of a family doctor.
41 48 43 38 35 37 44 44 44 62 75 77 58 82 39 85 55 54 67 69 69 70 65 72 74 74 74 60 60 60 61 62 63 64 64 64 54 54 55 56 56 56 57 58 59 45 47 47 48 48 50 52 52 53
(a) Compute the population mean and standard deviation.
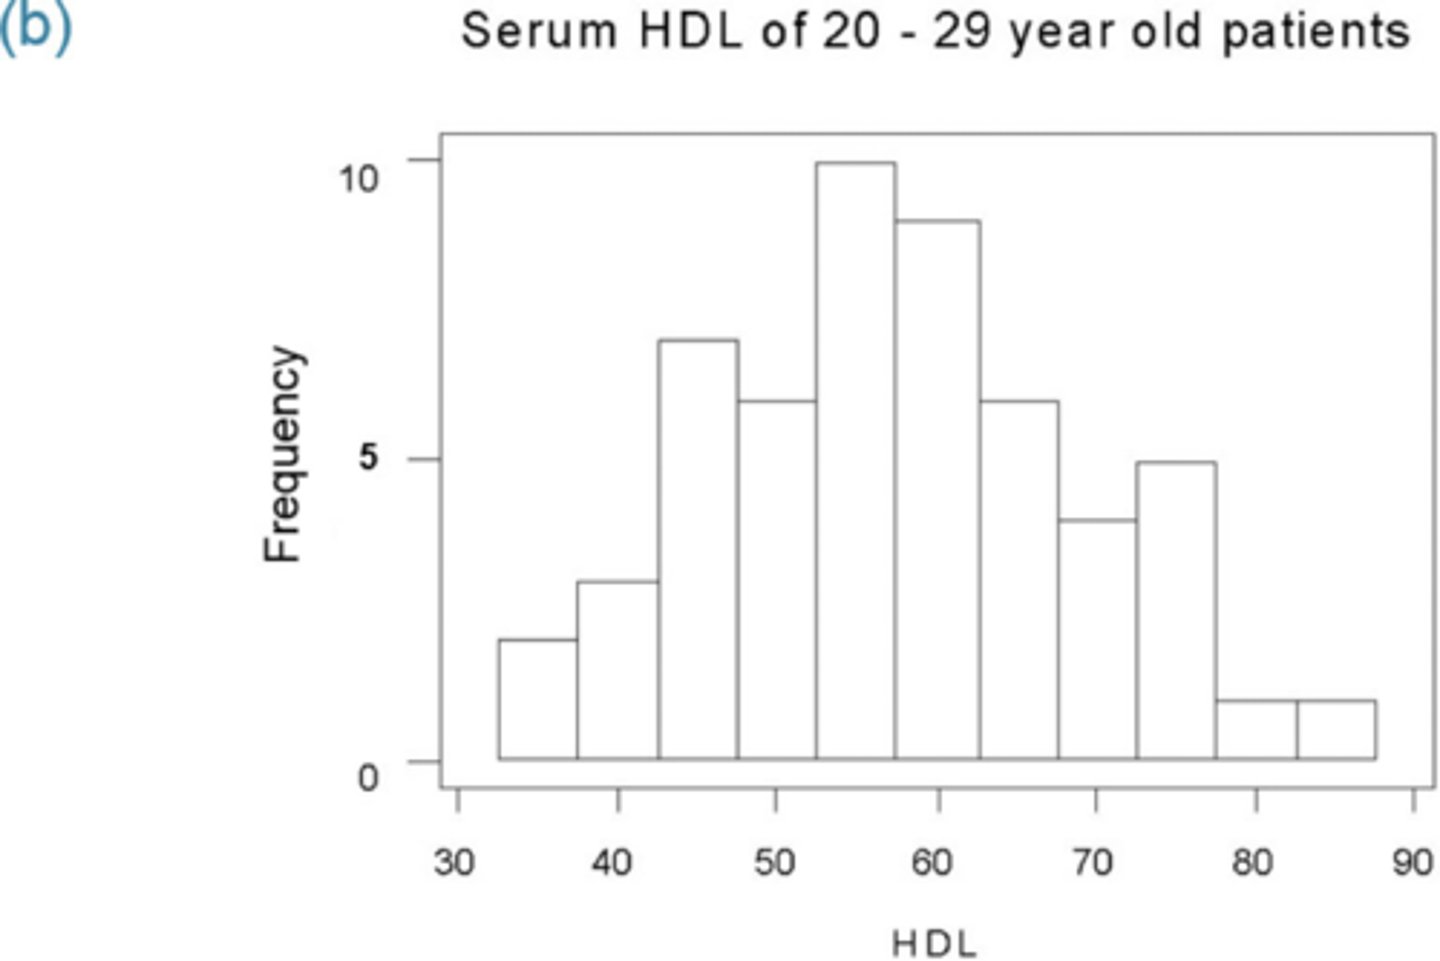
(b) Draw a histogram to verify the data is bell-shaped.
(c) Determine the percentage of all patients that have serum HDL within 3 standard deviations of the mean according to the Empirical Rule.
(d) Determine the percentage of all patients that have serum HDL between 34 and 69.1 according to the Empirical Rule.
(e) Determine the actual percentage of patients that have serum HDL between 34 and 69.1.
(a) Compute the population mean and standard deviation.
Using a TI-83 plus graphing calculator, we find μ= 57.4 and σ = 11.8
(b) Draw a histogram to verify the data is bell-shaped.
(e) Determine the actual percentage of patients that have serum HDL between 34 and 69.1.
(c) Determine the percentage of all patients that have serum HDL within 3 standard deviations of the mean according to the Empirical Rule.
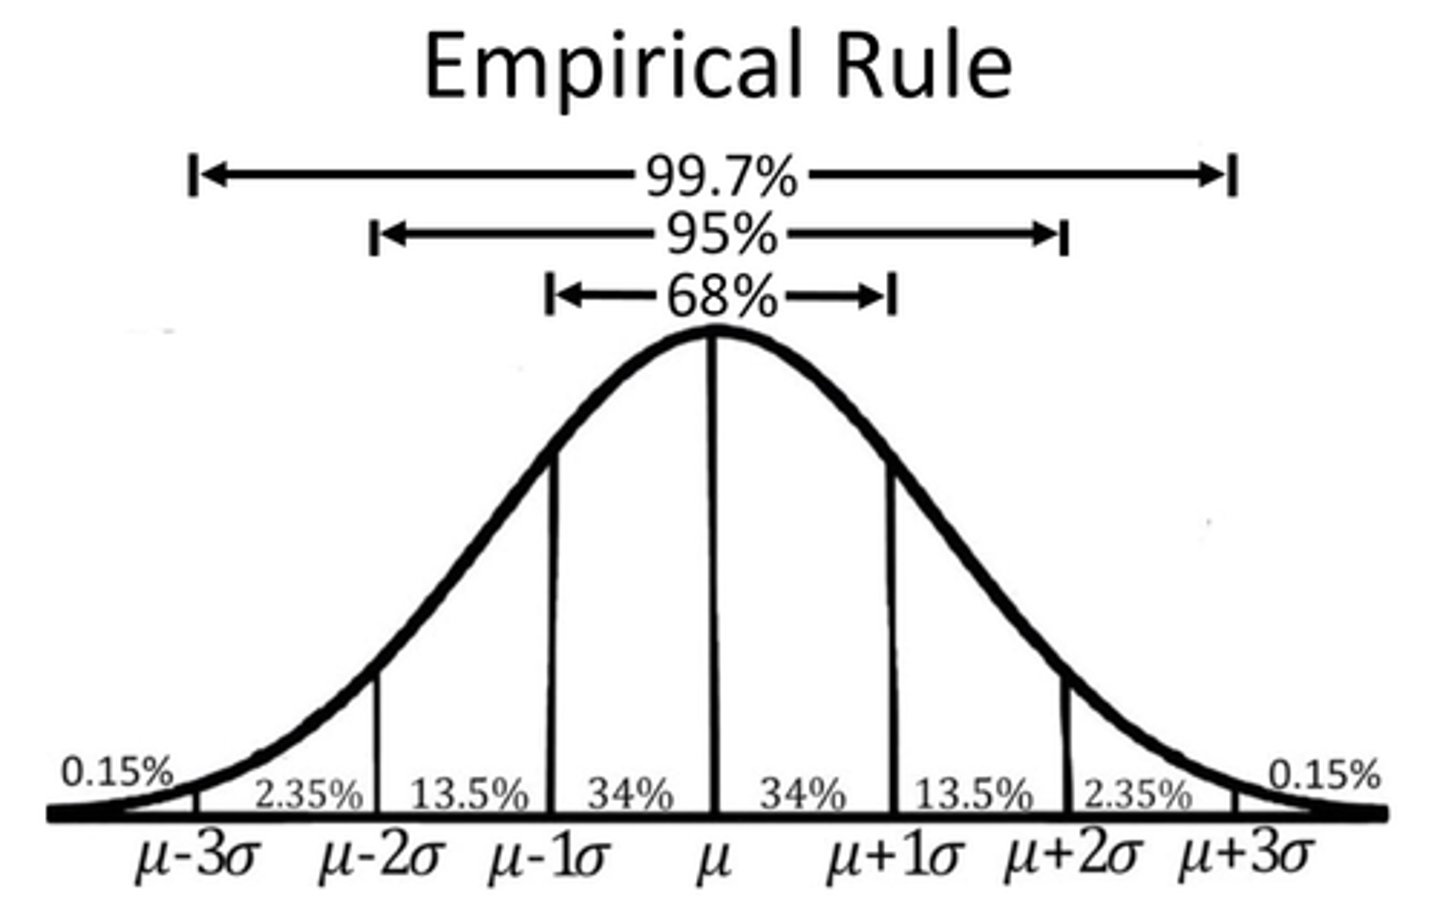
According to the Empirical Rule, 99.7% of the all patients that have serum HDL within 3 standard deviations of the mean.
(d) Determine the percentage of all patients that have serum HDL between 34 and 69.1 according to the Empirical Rule.
To calculate the percentage, divide the number of candies that weigh between the specified weights, inclusive, by the total number of candies, and multiply by 100.
13.5% + 34% + 34% = 81.5% of all patients will have a serum HDL between 34.0 and 69.1 according to the Empirical Rule.
(e) Determine the actual percentage of patients that have serum HDL between 34 and 69.1
(e) 45 out of the 54 or 83.3% of the patients have a serum HDL between 34.0 and 69.1

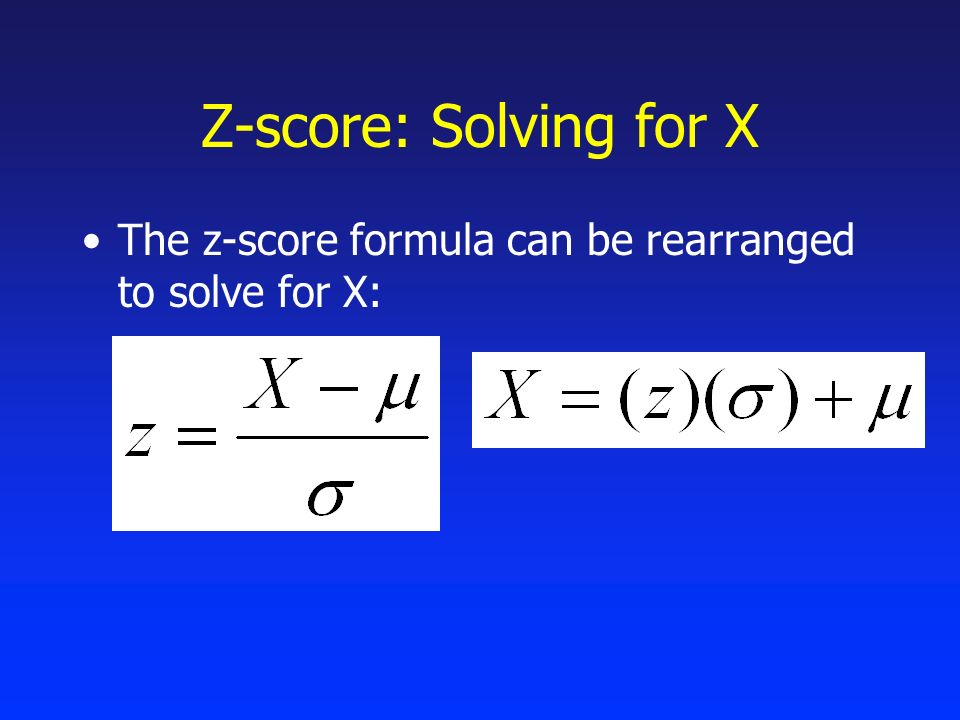
Finding x
