Climate Attribution, Detection, and Future Projections: Key Concepts in Climate Science
1/89
There's no tags or description
Looks like no tags are added yet.
Name | Mastery | Learn | Test | Matching | Spaced |
|---|
No study sessions yet.
90 Terms
Fingerprinting
Using theory to predict signatures/fingerprints we should see for various climate drivers and examining observations to confirm/deny hypothesis.
Empirical / Statistical Analysis
Using math model with observations to estimate response to various climate forcings; easiest to implement but can miss factors.
Climate Modelling
Natural only vs natural + anthropogenic model runs; allows comparison between human and natural effects.
Rising tropopause
Pattern consistent with greenhouse gases, sun, volcanoes.
Land warming faster than oceans
Consistent with greenhouse gases and sun.
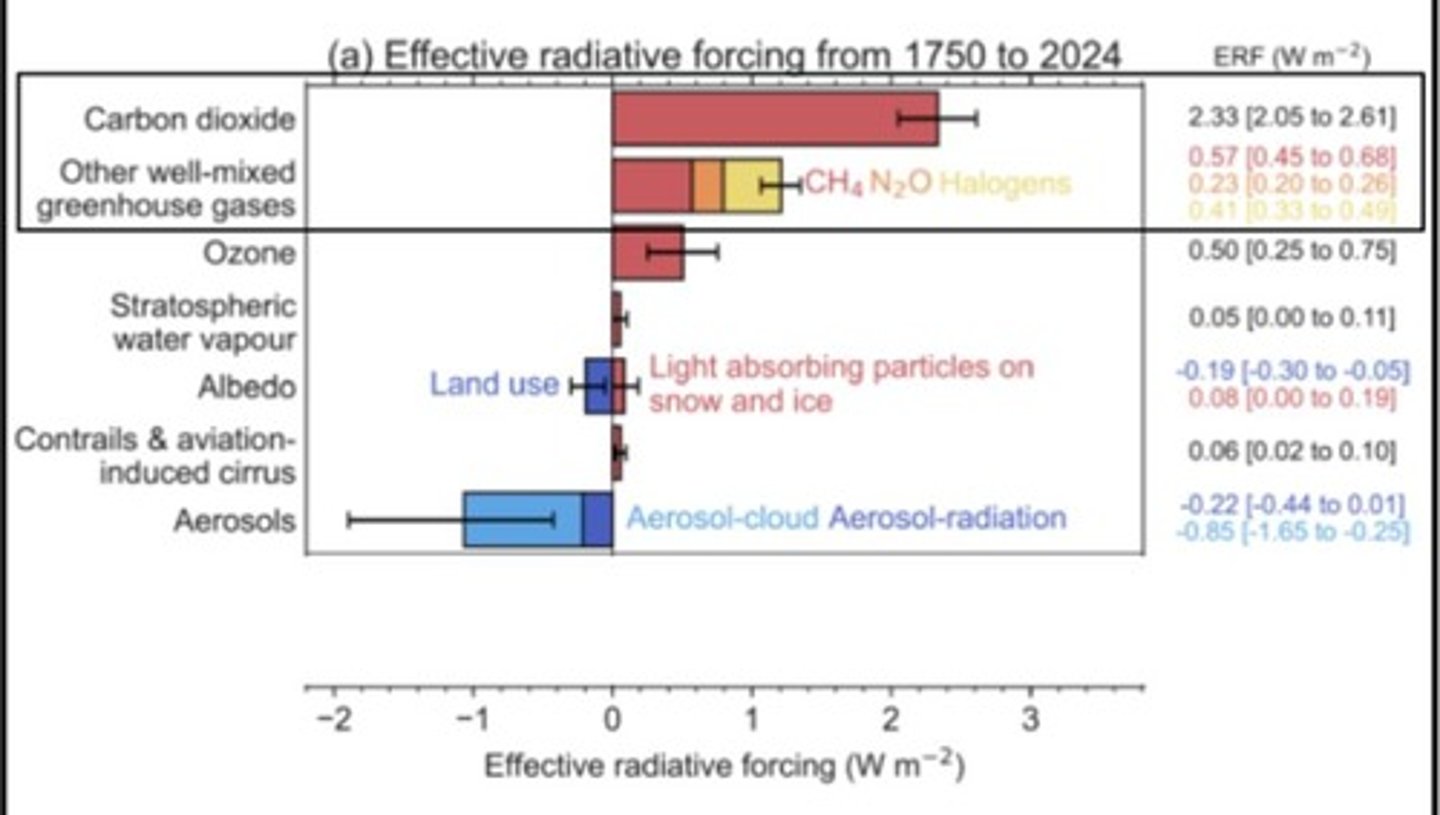
Carbon dioxide (CO₂)
By far the largest contributor, causing about +2.3 W/m² of forcing since preindustrial times.
Other well-mixed greenhouse gases
CH₄, N₂O, halogens also add warming, totaling roughly +1.2 W/m² combined.
Positive bars
Energy gain = warming influence.
Aerosols
Tiny airborne particles that create negative forcing by reflecting sunlight and increasing cloud brightness.
Negative bars
Energy loss = cooling influence.
Total effective radiative forcing
When all are combined, it is positive, meaning the Earth's energy balance is tilted toward warming.
Main driver of warming
CO₂ and other greenhouse gases.
Partial offset
Aerosols and albedo changes (cooling).
Total Anthropogenic bar
Shows that human-caused forcing is overwhelmingly responsible for modern climate change, adding roughly +3 W/m² of warming influence.
General Circulation Models (GCM)
Uses equations to stimulate energy, fluid and mass exchanges and interactions throughout earth systems.
GCMs
Analogous to long-term weather models; months to years to run.
Modern GCMs
Adjusted to better match complex physics of the atmosphere.
Boundary conditions in GCM
GCMs require boundary conditions and run without changes until they are stable.
Ensemble of models
Modelling groups do the same scenarios with their models to produce an ensemble of models.
Best estimate of warming since 1850
100% of warming is due to human activity (+1.3ºC).
Human emissions of aerosols
Mask some of the effects of GHG warming.
Climate Sensitivity
Measure tells us how sensitive climate is to a change in radiative forcing.
Higher Sensitivity
Means more change in climate.
Lower Sensitivity
Means less change in climate.
Global Temperature Response
Usually expressed as response to a change in radiative forcing.
IPCC
Presents climate sensitivity as response to a doubling of preindustrial GHG forcing (about +3.6 w/m2).
Transient Climate Response (TCR)
Measure of the shorter-term response to a change in radiative forcing, only includes faster climate feedbacks.
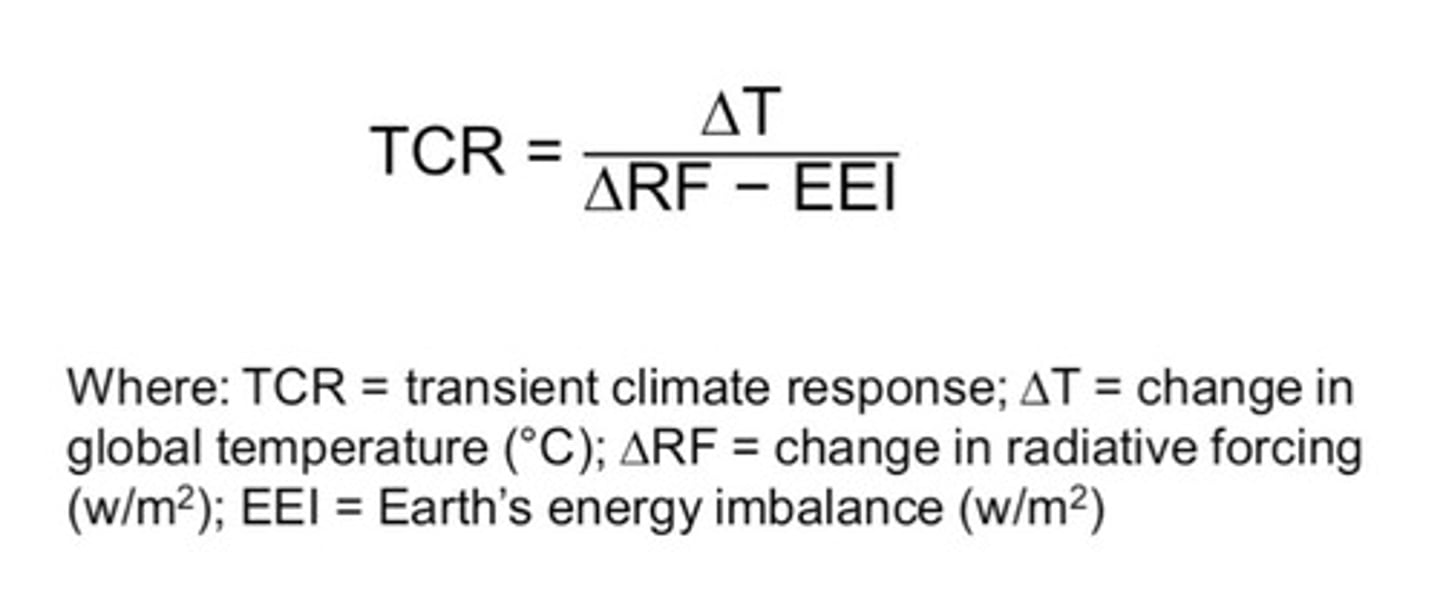
TCR Calculation
Originally calculated as change in global temperature for a 20-year period at doubling of GHG forcing.
Recent TCR Studies
Calculate it by dividing the observed change in global temperature by change in total radiative forcing over the same period.
TCR Range
IPCC AR5 gives a likely TCR range of ~0.27ºC to ~0.69ºC per w/m2.
Earth's Energy Imbalance
Measured as 0.99 W/m2.
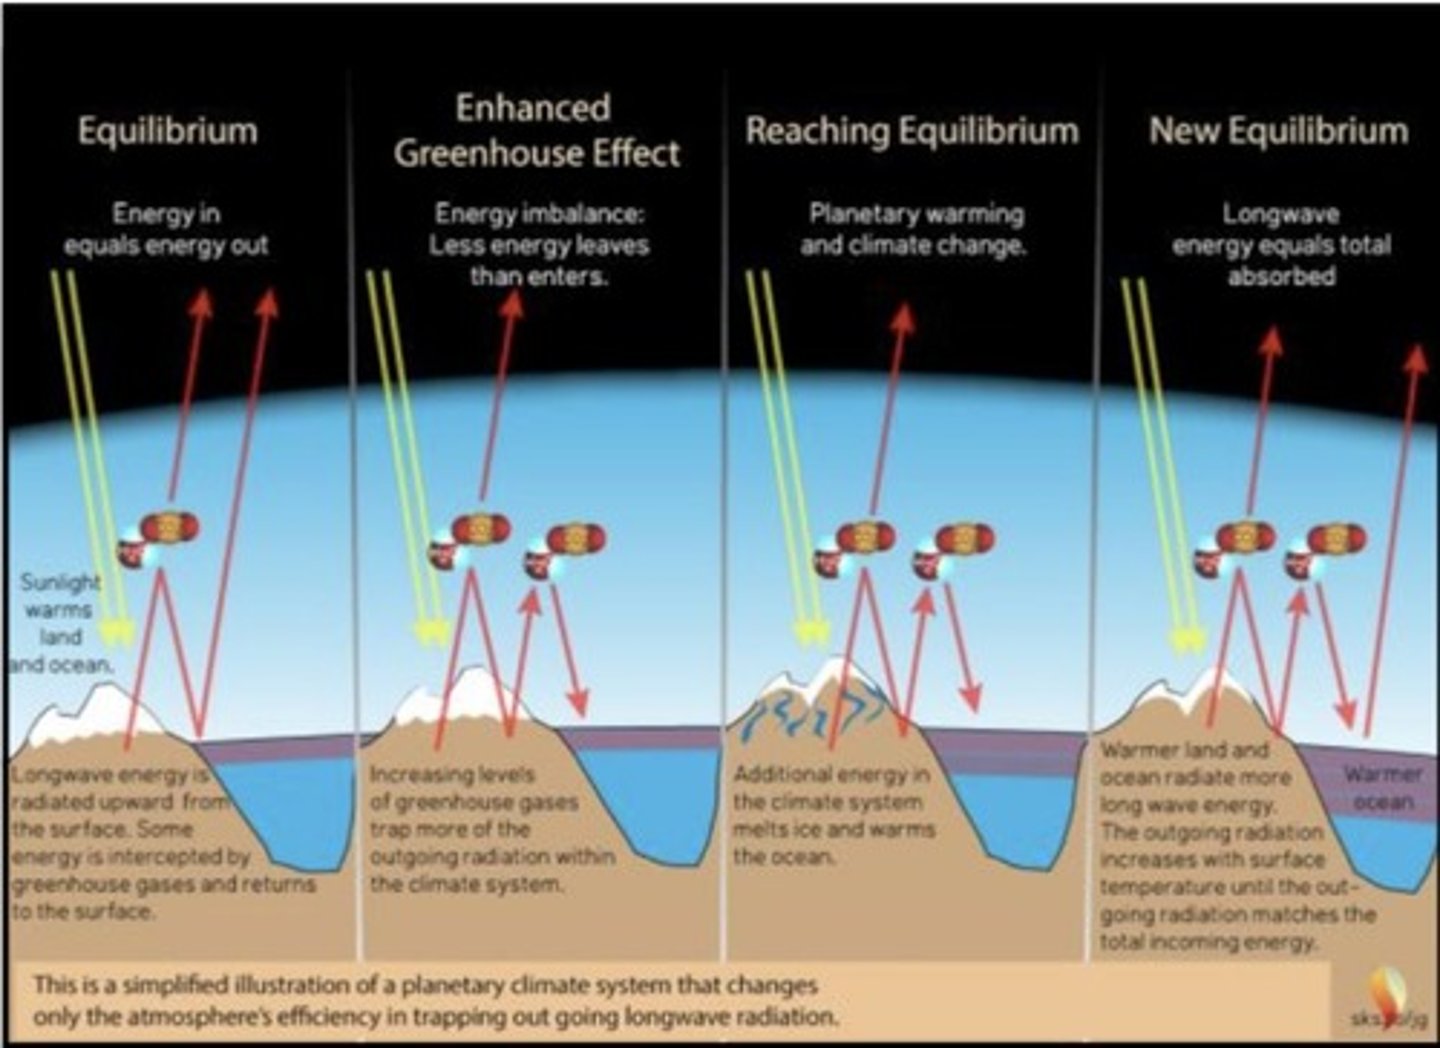
Effective Radiating Temperature
Temperature at which a system radiates away as much energy as it receives.
Equilibrium
Energy in = energy out.
Enhanced Greenhouse Effect
Energy imbalance: less energy leaves than enters.
Global Temperature Change
Global temperature change so far is about 1.3ºC.
Committed Warming
Our TCR estimate is 0.55, therefore ~0.55ºC of warming has already been committed.
Ongoing Increase in Radiative Forcing
About +0.57 per decade.
Paris Agreement
Holding the increase in the global average temperature to well below 2ºC above pre-industrial levels.
Unavoidable Warming
Some additional warming (~0.5°C) is effectively unavoidable.
Total Warming Plausibility
Meaning ~1.8°C total is very plausible even under strong mitigation.
Temporary Overshoot
Holding to 1.5°C now likely requires temporary overshoot and large-scale carbon removal later in the century.
Zero Emission Commitment (ZEC)
Refers to how much warming we are 'committed to' after we reach net zero emissions.
Warming follows cumulative CO₂
Rising emissions lead to both CO₂ and temperature increases.
Temperature plateaus
Occurs when emissions stop (ZEC phase), CO₂ stabilizes, and ocean feedbacks balance.
Long term warming
Slight drift up or down depending on model; warming is effectively locked in for centuries.
Change in Temperature after Net Zero in Climate Models (ZEC)
Most models cluster near zero, meaning after CO₂ emissions stop, global temperature remains roughly stable for centuries.
Earth's Zero Emissions Commitment (ZEC)
Close to 0°C ± 0.2°C.
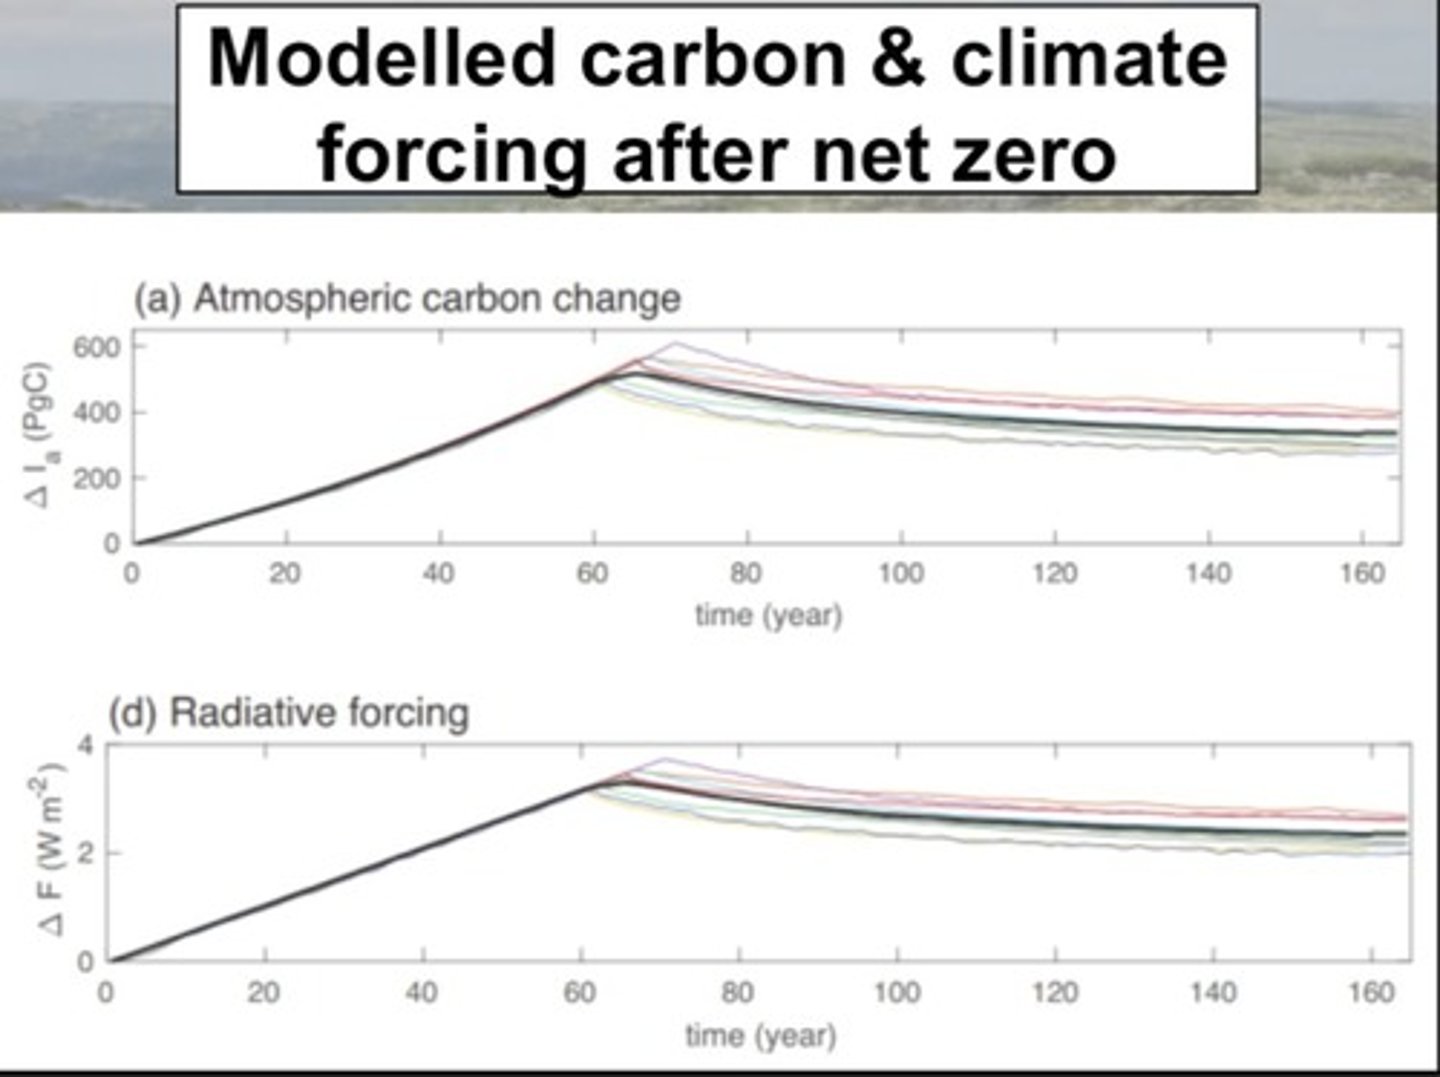
Modelled Carbon and Climate Forcing after net zero
CO₂ doesn't vanish quickly; it lingers for centuries, slowly decreasing even after emissions stop.
Radiative forcing
Falls slowly because CO₂ removal is slow, meaning the planet continues to absorb more energy than it emits for decades.
Natural processes and climate
Always influenced climate, but at much slower rates.
Modern warming spike
Steeper and faster than any comparable event in at least the last 10,000 years.
Equilibrium Climate Sensitivity
Change in global surface temperature that occurs once medium to long term feedback processes reach equilibrium.
IPCC AR5 ECS range
Gives likely ECS range of 1.5ºC to 4.5ºC for a doubling of GHG forcing.
Net zero commitment
One way of stimulating the future climate.
Standard emission scenarios via CMIP
Historical climate model runs can use observed GHG, aerosol concentrations.
Input scenarios
Consider predicted fossil fuel usage, mitigation strategies, and international cooperation.
RCP Model Scenarios
Only 4 RCP: 2.6, 4.5, 6.0, 8.5.
RCP numbers
Signify radiative forcing for this scenario.
RCP scenarios
Run to at least 2100 AD, ranging from negative emissions (2.6) to burning most fossil fuels (8.5).
Core idea of climate prediction
Predicting climate = (future forcing) + (estimate of sensitivity).
What controls emissions?
A question regarding the factors influencing emissions.
IPAT
I = P x A x T
I
GHG emissions
P
Population
A
Affluence (GDP per person)
T
GHG intensity (emissions per $GDP)
Split T
T = EI x CI
EI
Energy intensity = energy per $GDP (J/$)
CI
Carbon intensity = CO₂ per energy (CO₂/J)
GtC to GtCO₂ conversion
Multiply by 3.67 (44/12)
Population change since 1960
Population ↑ sharply (7.8B by mid-2020; +200k/day)
Affluence change since 1960
Affluence (GDP/person) ↑ (global growth)
EI change since 1960
EI ↓ (efficiency gains; structural shift to services; LEDs, etc.)
CI change since 1960
CI ↓ to ~2000 (coal → gas), ↑ in 2000s (coal surge in China), then ↓ in 2010s (gas displacing coal)
Net emissions change
Emissions ≈ tripled 1960→2018 because PPP and AAA rose faster than EI & CI fell
SSP1
Sustainability: greener, equitable, slower pop growth, fast CI drop
SSP2
Middle of the road: historical trends continue
SSP3
Regional rivalry: fragmented, slower tech, high CI, lower affluence, higher pop in poorer regions
SSP4
Inequality: divided world but rapid low-CI tech for elites
SSP5
Fossil-fueled development: rich & fast growth but fossil-heavy (high CI)
Radiative forcing suffix
Suffix = radiative forcing in 2100 (W/m²)
Common SSP scenarios
SSP1-26, SSP2-45, SSP3-70, SSP5-85 (≈ successors to RCP2.6, 4.5, 8.5)
CO₂ and forcing relationship
Feed scenarios into carbon-cycle models ⇒ CO₂ concentrations ⇒ radiative forcing
CO₂'s role in future forcing growth
CO₂ dominates future forcing growth due to long lifetime (centuries) and accumulation
Temperature projections near-term
Near-term similarity across scenarios until ~2040-2050 (CO₂ stock dominates)
2100 warming projections
SSP1-26: ~+2.0 °C (~+1 °C above 2010s), SSP2-45: mid-range, SSP3-70: higher, SSP5-85: ~+5.5 °C (~+4.5 °C above 2010s)
Irreversibility beyond 2100
Even if emissions stop abruptly, CO₂ declines slowly (centuries-millennia)
Temperature persistence
Temperatures remain elevated for ~≥1000 years due to persistent elevated CO₂, ocean heat capacity, slow feedbacks (ice sheets, etc.)
Weather predictability
Weather: initial-value problem (needs today's exact state) → predictability ~days
Climate predictability
Climate: boundary-value problem (needs forcing) → statistics predictable decades+