Human Fieldwork - Llandudno
1/40
There's no tags or description
Looks like no tags are added yet.
Name | Mastery | Learn | Test | Matching | Spaced | Call with Kai |
|---|
No analytics yet
Send a link to your students to track their progress
41 Terms
What was our key question for the investigation?
To investigate differences in quality of life in Llandudno between the town centre + inner city compared to the suburbs
Define the following key words: quality of life
The standard of health, comfort, and happiness experienced by an individual or group
Define the following key words: Inner city
Residential area characterised by dense terrace housing built in the 19th century. Situated near formal industrial areas of a city.
Define the following key words: Suburb
Residential areas characterised by detached or semi-detached house with large gardens built from 1930’s onwards.
Define the following key words: Accurate
Data that is as close as possible to the true value
Define the following key words: Reliable
Being able repeat and get a similar result every time
Define the following key words: Qualitative
Data that involves words, pictures etc e.g. someone’s answer to a questionnaire - opinion based
Define the following key words: Quantitive
Data that involves number, usually measurements of something in the field e..g height of a tree
Define the following key words: Subjet
Something that is based on someone’s opinion
Why have we chosen this investigation?
Urban areas face huge challenges and there is a big variety in quality of life within different parts of cities.
What are some examples of challenges to quality of life?
poverty in areas that have experienced deindustriliation
Seasonal unemployment in costal towns like Llundudno
Seasonal reduction in employment if people become part time e.g. summer there may be more jobs but in winter some jobs may disappear of make less money
High crime rate in some towns/ cities
Urbanisation = impermeable surfaces = surface water = flooding
Overpopulation if cities grow = less space = demand for housing = house price increases (also since Covid more pressure in smaller towns) or in retirement towns with second homes
Traffic, often from tourism = air pollution + congestion (see London) on local scale BUT also global scale releases more greenhouse gases
Education - growing urban areas may not be enough school places or access to opportunities
Llundudno context
it is a costal town with 20, 000 people
Originally a fishing village then with the railway became a tourist town
84% are employed (in line with UK average)
Lots of people work in hospitality and retail
What was our hypothesis?
Our hypothesis is that the quality of life will better in the suburban areas (Tudno 3) than in the town centres plus inner city (Tudno 1)
What is the justification for our hyphtesis?
We thought this because the air quality will be better as there will be less traffic, there will be less noise pollution, lower crime rates, houses will be bigger with more green space
What were the hazards in our risk assessment?
someone might get annoyed = shout at you → be polite + respectful
Traffic/ cars = injury → take care when crossing roads, use the crossing, listen to teachers
Getting lost = being left behind in Llandudno → stay in groups of 3, have staff phone numbers
Weather = may be too cold/ wet = hyperthermia/ sun burn → dress appropriately, bring layers + sun cream
What where our two data collection methods?
Environmental quality assessment (quantitive, numerical data)
Questionnaires (qualitative opinions)
Explain the environmental quality assessment type of data
We looked at factors such as litter, building upkeep, traffic and green space. Whilst all elements were ranked with numbers (1 being the worst and 10 the best) some data was quantitive, for example by counting the number of trees in a given area, and other data was qualitative, for example noise pollution as we judged this ourselves, rather than measuring it.
Explains the questionnaire type of data
Questionnaires are subjective as you are asking for someone’s opinion rather than measuring a specific value
How did we carry out the environmental quality assement?
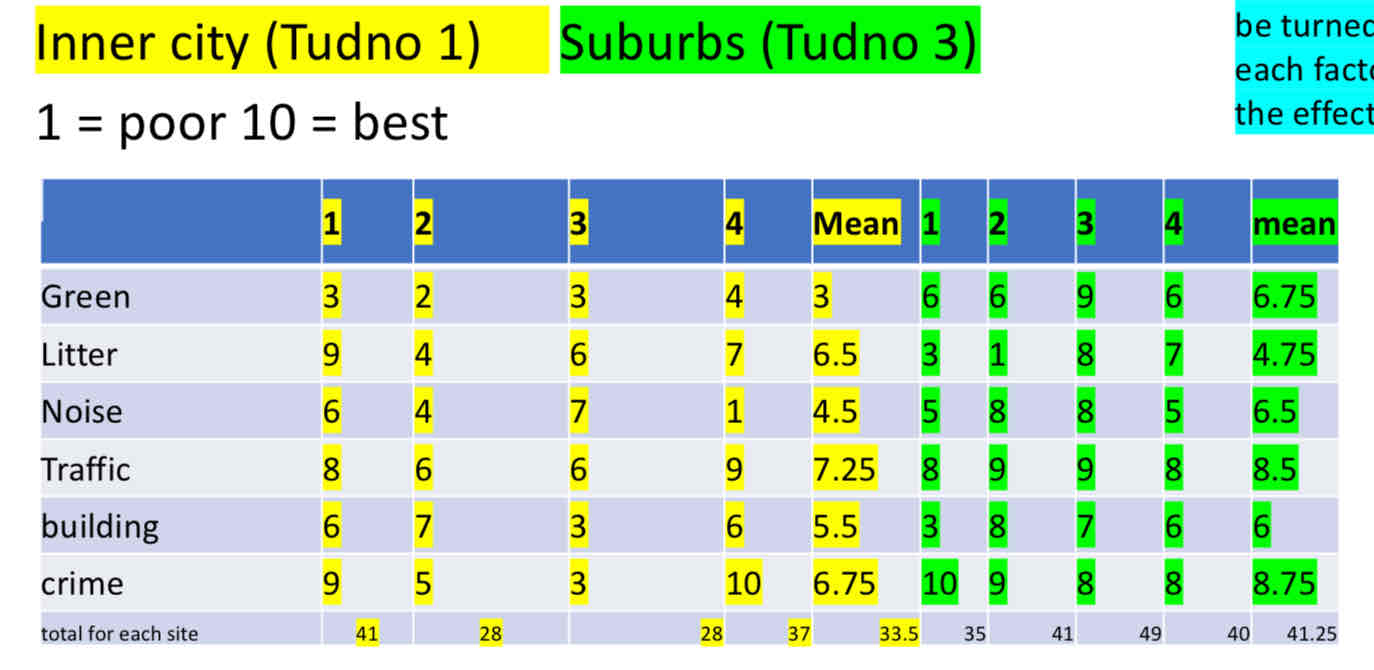
A table was created looking at aspects including litter, building upkeep and green space.
Each score for each aspect could be turned into a mean score for each factor which would reduce the effect of anomalies
What were the results of the EQA?
What was the question asked in the questionnaire + options?
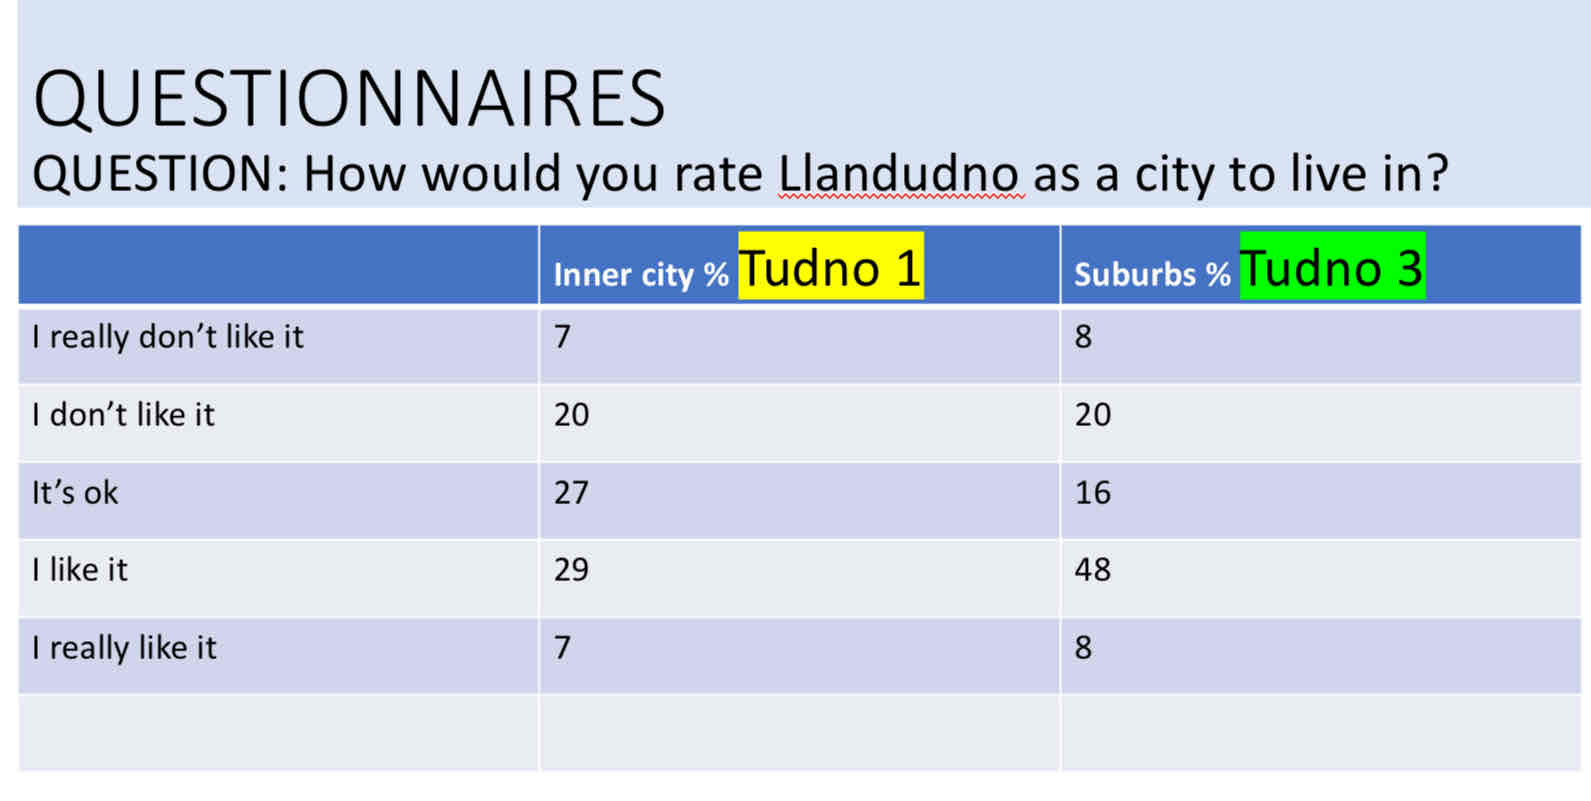
How would you rate Llundudno as a city to live in?
I really don’t like it, I don’t like it, it’s ok, I like it, I really like it
What were the results of the questionnaire?
Headline figure - how was this data displayed + why
This data had to be % as there were more respondents in the inner city areas than in the suburbs.
Describe the data from the questionnaire
Only 36% of the people in the inner city liked or really liked living in the inner city but a huge 56% liked or really liked living in the suburbs. Interestingly 1% more people really DID NOT like living in the suburbs but on balance, people were positive about the suburbs.
What sampling strategy was used for the questionnaire + why?
Questionnaire was stratified sampling strategy to ensure respondents were asked in both locations but within each location we used opportunity sampling
What sampling strategy was used for the EQA + why?
Stratified sampling strategy to run sure we had examples from both areas
Asses your data presentation for the questionnaire
Methods for questionnaire presentation: bar chart
Advantage: shows different categories easily and allows us to compare the two study areas. It is easy to get precise figures from a bar chart
Disadvantage / how to improve the simple bar chart: this does not give locational context so you could put the bars on a map of Tudno 1 and Tudno 2
Asses your data presentation for the EQA
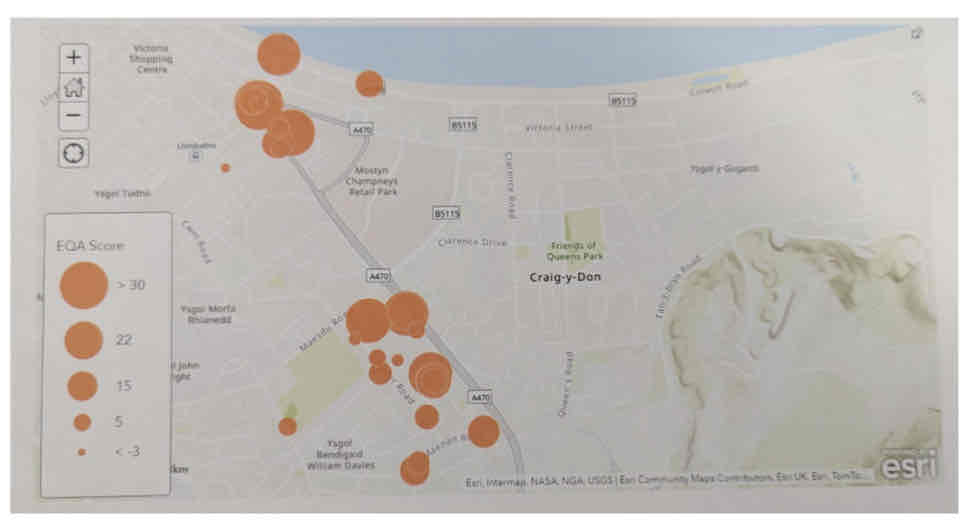
The overall scores for each survey point were uploaded to ARC GIS and turned into proportional circles. This was shown as LOCATED PROPORTIONAL CIRCLES using GIS. This size of the circles indicated the score with larger circles indicating higher scores, however this was not made clear on the key.
This method allows a very visual comparison of the OVERALL environmental quality of each survey point and also gives us excellent locational context to help explain the maps. However, it does not show how much each individual aspect of environmental quality that made up the overall score achieved e.g. building quality or noise.
Additionally, it can be difficult to get the exact figures from proportional circles. Finally, some of the circles when plotted on the map overlapped each other making them hard to read.
Description and conclusion
my hypothesis was that people would have a better quality of life in the SUBURBS THAN OM THE INNER CITY
My questionnaire data SUPPORTS my hypothesis. (Why data % + results 36% etc)
The EQA results DO support this hypothesis. The average score fort the inner city was 33.5 and the average score for the suburbs was 41.25 suggesting that the environmental quality was better in the suburbs. Larger circles indicating higher values tended to be found along the main roads near the shopping hubs which have benefitted from regeneration and investment and lower in more residential side streets.
Explain your conclusion
Houses are bigger so they have more space, they are also more likely to have gardens meaning more access to outdoor space and also private outdoor space. There is also less traffic than in the inner-city leading to less noise and air pollution, and they are more likely to have better payed jobs. They may also have closer relationships with neighbours as it is more of a community than the inner-city
How can we be sure our conclusions are correct?
Our conclusions match our hypothesis which suggests that our results are correct, furthermore these results match the Burges model which our hypothesis was formed based on suggesting that our results are correct as they match the general trend. Whilst our data only comes from one area, we cannot say that it is true for all places, however in matching the model it suggests that it is. Furthermore, whilst not all our data collection was fully reliable, overall with means calculated our data was fairly reliable. Therefore we think our conclusion is reliable and accurate. |
Pros and cons of EQA as a method
Our EQA data was just based on looking around four streets and was SUBJECTIVE based on our opinions. We did take an average to reduce anomalies but it may have been affected by the fact our group was all female and teenagers.
Stratified sampling was a good idea as if we had just done random sampling we may have eneded up with all or most sample points in the suburbs which would not have given a good comparison.
Pros and cons of questionnaire as a method
The sample size was small and may not be representative of the whole population eg we did it on a school day while many people were at work so most of the sample was elderly. This may affect the reliability - if we repeated the sample at another time we may have had different results.
Also we may have felt more comfortable approaching some people than others meaning our sample may not be representative.
Ideally we would like to have a stratified sample that matched the demographic profile of Llandudno but a high rejection rate makes this very difficult.
Explain why this is a suitable location to sample [3]
Big enough population (with 20, 000 people) to show the differences between inner-city and suburb area. Tudno 1 and Tudno 3 are close together so we were able to sample both areas on the same day at times close together. Llandudno has distinct areas so we could easily investigate the differences in quality of life.
What risks did you have to manage and how did you manage them? [4]
Someone might get annoyed = shout at you – be polite + respectful
Traffic/ Cars = injury – take care when crossing roads, listen to teachers
Getting lost = being left behind in Llandudno – stay in a group of 3 + have staff phone numbers
Weather = may be too cold/ wet = hypothermia/ sun burn – dress appropriately, bring layers + suncream
Explaining why your key question for the investigation was appropriate [2]
Llandudno is big enough to have distinct areas such as inner city and suburbs. Therefore, we were able to investigate the quality of life in each as the suburbs should have a higher quality of life as the houses are bigger, people have more space and often have higher salaries
What was your hypothesis and can you justify it?
Hypothesis: Our hypothesis is that the quality of life will be better in the suburb areas (Tudno 3) than the in the town center plus inner city (Tudno 1).
Justification: We thought this because the air quality will be better as there will be less traffic, there will be less noise pollution, lower crime rates, houses will be bigger with more green space
To what extent was your primary data collection successful? [8 + 3 SPAG]
To collect data for our questionnaire each group asked 4-5 people n each of the areas and these results were then added together. This allowed for a greater data set to be analysed. However, 70% asked in the suburbs were retired as we carried out the questionnaire on a school day in the middle of the day. Working aged people were not represented as they were at work. And in the inner-city areas the majority of people were tourists and so did not reflect the view of residents. This meant that we couldn’t reach a reliable and strong conclusion.
Questionnaires are also subjective, and we only got responses from people who were prepared to talk to us. They may have been more positive people, and this is shown in our data as 72% of people in the suburbs answered very positively about their quality of life.
The environmental quality assessment was successful as we looked at different qualities in the suburbs ad the inner-city. However, some of our data was subjective so people may have had different opinions making it inaccurate. We overcame this by finding a mean to remove any anomalies from the results.
Overall, I believe this EQA was successful as it matched our hypothesis with Tudno 1 (inner city) scoring 33.5, and Tudno 3 (suburbs) scoring a higher score of 41.25 which shows that it has a better quality of life
How did your investigation allow you to reach a strong conclusion [8 + 3 SPAG]
Our EQA data was just based on looking around a small number of streets and was subjective based on or opinions. We did take an average to reduce anomalies, but it may have been affected by the fact our group was all female teenagers.
Stratified sampling to ensure we had examples from both areas was a good ideas as if we had just done random sampling we may have ended up with all or most sample points in the suburbs which would not have given a good comparison.
For our questionnaire, the sample size was small and may not be representative of the whole population. The small sample size may affect the reliability as we may not have had a representative sample of the population. Also we may have felt more comfortable approaching some people than others meaning our sample may not be representative.
Ideally we would like to have a stratified sample that matched the demographic profile of Llandudno but a high rejection rate makes this very difficult.
Evaluate the usefulness of one method of data presentation you have discussed [4]
The overall scores for each survey point were uploaded to ARC GIS and turned into proportional circles. This was shown as LOCATED PROPORTIONAL CIRCLES using GIS. The size of the circle indicates the score with larger circles indicating higher scores, however this was not made clear on the key.
This method allows a very visual comparison of the OVERALL environmental quality of each survey point and also gives us excellent locational context to help explain the maps. However, it does not show how much each individual aspect of environmental quality that made up the overall score achieved eg, building quality or or noise.
Additionally it can be difficult to get the exact figures from proportional circles. Finally, some of the circles when plotted on the map overlapped each other making them hard to read.
How could you improve your data collection methods? [6]
We could have found ways to collect more quantitive data to ensure that it is more accurate and reliable as it will be the same across all areas and will not vary based on opinions or bias. Furthermore, we could have taken our data across multiple different days and times to ensure that the entire demographic is represented. If it is not possible to avoid some qualitative data, we could have ensured others (not just female teenagers) gave their input to ensure that it is less biased and represents wider views.