Unit 2 AP Human geography
1/77
There's no tags or description
Looks like no tags are added yet.
Name | Mastery | Learn | Test | Matching | Spaced |
|---|
No study sessions yet.
78 Terms
Malthusian theory
Population grows exponentially while food output only grow arithmetically. This would result in a food shortage and famine due to overpopulation.
Carrying capacity
The amount of population that a location can support WITHOUT harming the enviorment
Were did Thomas Malthus live ?
England 1700’s
What did Thomas Malthus experience ?
Industrial Revolution
name of essay from Malthusian theory
1798 An essay on the principles of population growth
Exponentially example
2,4,8,16
Arithemtically
1,2,3,4
Criticisms of Malthusian Theory 1
Factors slowing population growth
- contraceptives -Education and advancement of woman
Criticisms of Malthusian theory 3
New technologies and inventions
More efficient travel to deliver food
refrigeration in trucks and rail cars
tin cans to preserve food for longer
Criticisms 2 Malthusian Theory
Factors that have increased efficiency of farming
Mechanized farming
hybrid seeds
chemical fertilizers
Boserup’s theory / claim
Food supply is impacted directly by population growth
As population increase = human innovation creates more food
what does neo mean
neo means new
Neo Malthus theory
Earth can only sustain a limited finite amount of people
global overpopulation , Strain on natrual resources, Overconsumption , famine , starvation , water insecurity , desertification , pollution
Pro-natalist Policies Causes/Concerns
Aging population declining workforce declining population
Were do Pro-natalist policies Causes/concerns take place ?
Stage 4 & 5 Countries
EXAMPLES of pro-natalist policies
Propaganda, financial support,
Financial support examples
free os sub sized child care, free education opportunities, lengthy & paid maternity leave
Immigration policies to promote population growth
encourage skilled workers, youth immigration programs , family immigration programs
ANTI- natalist policies
Government programs designed to decrease the fertility rate and slow down population growth
Anti-natalist policies Causes/concerns
overpopulation & rapid growth , limited resources & infastructure, risk of famine
Were are anti-natalist policies Causes/concerns taking place ?
stage 2 countries
examples of anti natalist policies
propoganda , ecenomic fear,smaller families,wait for marriage and kids , encourage having girls
examples of anti-natalist policies 2
financial disincentives &incentives (fines & taxes per child) , Prizes and rewards (discounts of child care for having limited number , cash bonuses preferential housing , loans , cars
unintended consequences of anti-natalist policies
abortions , abandonment of babies , sex selective abortions favoring boys over girls,skewed sex ratios impacting future marriage and reproduction
Were do people not settle ?
Too hot
Too cold
Too wet
Too chilly
Too dry
Ecumene
Habitable Areas of the world
Were are people likely to settle in ?
Low elevation
Fertile soil
Temperate Climates
Near a body of water
Mid-Latitudes
What economic influences were people distribute /live ?
Job opportunities Access to Natural Resources
Social Influences on distribution
Housing availability
Safety
Access to transportation
A feeling of belonging
Community
How do geographers calculate Arithemtic population density
Total population divided by land area
What are Limitations of Arithmetic Density
Does not tell us : Where people are located within the country
Clusterd ? Dispersed ? Pattern?
How too calculate Physiological Population density ?
Total population divided by arable Land
Carrying Capacity Definition
The amount of people a country’s land can support by available resources without damaging environment.
How to calculate Agricultural population density
Farmers divided by arable Land
What does high population density impact ?
Access to housing , jobs , water , services medical, fire, police (more expensive in higher density areas)
What is Redistricting ?
process of redrawing electoral district boundaries after the census every 10 years
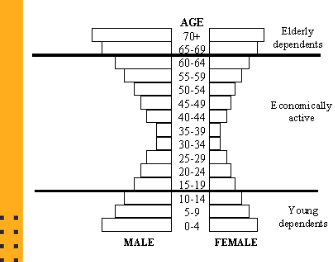
why are population pyramids Important ?
shows composition of country
Shows is their is growth
Can be used at various scales
Gives insight into what country might need
Dependency ratio
The number of people in a dependent age group is divided by the number of people in the working age group multiplied by 100
What does wider base in a population pyramid signify ?
More babies are being born
What does a larger top in population pyramid signify ?
More people are getting old
Impacts of high dependency ratio
Not earning an income
Not paying taxes
working population face -higher taxes
Sex ratio Definition
The proportion of males to females in a population
what could cause fewer women or fewer men in a society
war , insufficient healthcare for women , migration , gendercide/ sex selective abortions
What is this picture ?
Dependency Ratio example
Which side are males and females on a population pyramid ?
males to left : females to right

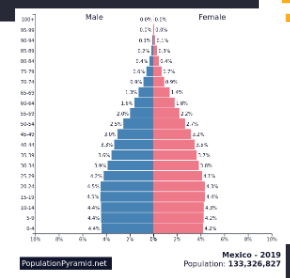
Identify the trend in this picture
Triangle
Wide base = growth
Fast population growth
Younger population
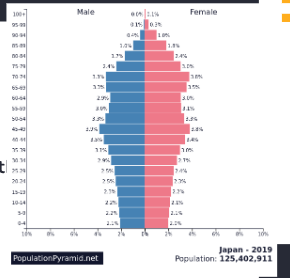
Identify the trend in this picture
Bishop hat
Slower population growth
Population starting to age
Identify the trend in the picture
Inverted triangle
Base smaller than top
Population decline - negative population growth
Graying population/Older populations

identify the trend
Rectangle shape
Cohorts look the same
Zero population Growth
Stable population
CBR
Crude Birth Rate
CBR-defintion
the number of live births occurring in one year per 1,000 people
TFR
Total Fertility Rate
TFR- Defintion
Avearge number of children who would be born per women during her child bearing years
CDR
Crude Death Rate
CDR- Defintion
the number of deaths occurring in one year per 1,000 people
Life expectancy- Defintion
The number of years the avearge person will live
IMR
Infant Mortality Rate
IMR- Defintion
The number of children who die before one year of age
How Do Geographers calculate NIR
Subtract the CDR from CBR
NIR or RNI
Natrual Increase Rate or Rate of Natrual Increase
How do geographers calculate population growth rate ?
Births - Deaths + Immigrants - Emigrants
How to calculate doubling time
Divide 70 by Annual Growth rate
Characteristics of stage 1 DTM Model
High TFR- children not likely to survive
Need for child labor
CDR - low life expectancy - famine poor diet , diseases , warfare , inadequate housing
NIR - low growth
Population Composition - youth Dependancy
Characteristics of Stage 2 DTM Model
CBR- same as stage 1
CDR -still low life expectancy but, improved nutrition sanitation and medicines
NIR- Rapid growth
Population composition - Youth Dependancy
What countries are in stage 2 of DTM
LDC’s , Niger , Mali, south Sudan
Characteristics of stage 3 DTM Model
CBR- urbanization reduces child labor
Increase in healthcare , female employment and education
CDR- Life expectancy increases due to advancements
NIR- Growth slows
What countries are in stage 3 of DTM
Turkey, Mexico, Indonesia, India
Characteristics of stage 4 DTM
CBR- same as stage 3
CDR- Life expectancy continues to increase
NIR- Falls & then stabilizes at low growth
Population composition - Beginning to shift to elderly dependency
What countries are in stage 4 of DTM
China, Australia, Canada, South Korea , US
Characteristics of stage 5 DTM
CBR- Replacment level or Zero population growth
CDR- Most medically advanced
nIR - Negative or very low
population composition: Most likely to have high elderly Dependency
what countries are in stage 5 of DTM Model
Japan , Germany
Characteristic of stage 1 ETM Model
Pestilence & Famine
Infectious diseases
-Cholera
-Tuberculosis
Pandemics & Epidemics
Animal attacks & Accidents
Malnutrition
Stage 2 of ETM Model
Receding Pandemics
Pandemics and infectious disease - decline due to medical advances and sanitation and improved nutrition
Stage 3 of ETM
Degenerative & Human Made Diseases
Diseas associated with aging and life style choices
Heart diseas
Cancer
Stage 4 of ETM Model
Delayed Degenerative Diseas
Diseas associated with aging and life style choices can be delayed with medical advancements
Alzeihmer’s , Dementia
Stage 5 of ETM
Reemergence of infectious diseases
Bacteria and parasites become resistant to antibiotics & vaccines
Ebola , COVID-19