AP Stats Unit 1
1/24
There's no tags or description
Looks like no tags are added yet.
Name | Mastery | Learn | Test | Matching | Spaced |
|---|
No study sessions yet.
25 Terms
Statistics
Studies concerning data collection, organization, analysis, interpretation, and presentation
Statistic
Calculation made from data
Data
Systematically recorded information with corresponding context
Variable
Characteristic differing from one subject to another
Two types of Variables
Quantitative and Categorical
Two types of Quantitative Variables
Discrete (Whole #s)
Continuous (Anything with a decimal)
Frequency v Relative Frequency
Raw numerical values vs. Percentages/Proportions
Ways to represent Categorical Data
Charts- Pie, Bar, Side By Side Bar Chart
Tables- Frequency/Rel. Frequency Tables
Ways to represent Quantitative Data
Dot Plot
Stem/Leaf Plot
Histogram
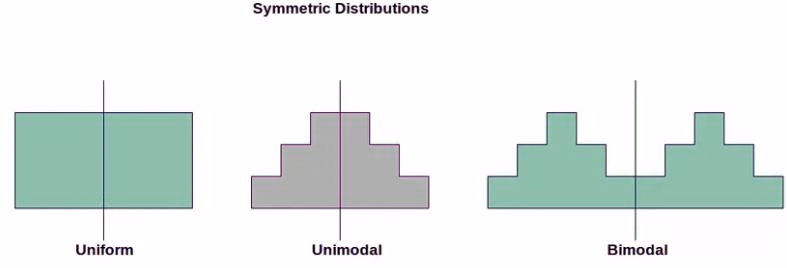
Three Distributions of Graphs: uniform, unimodal, and bimodal
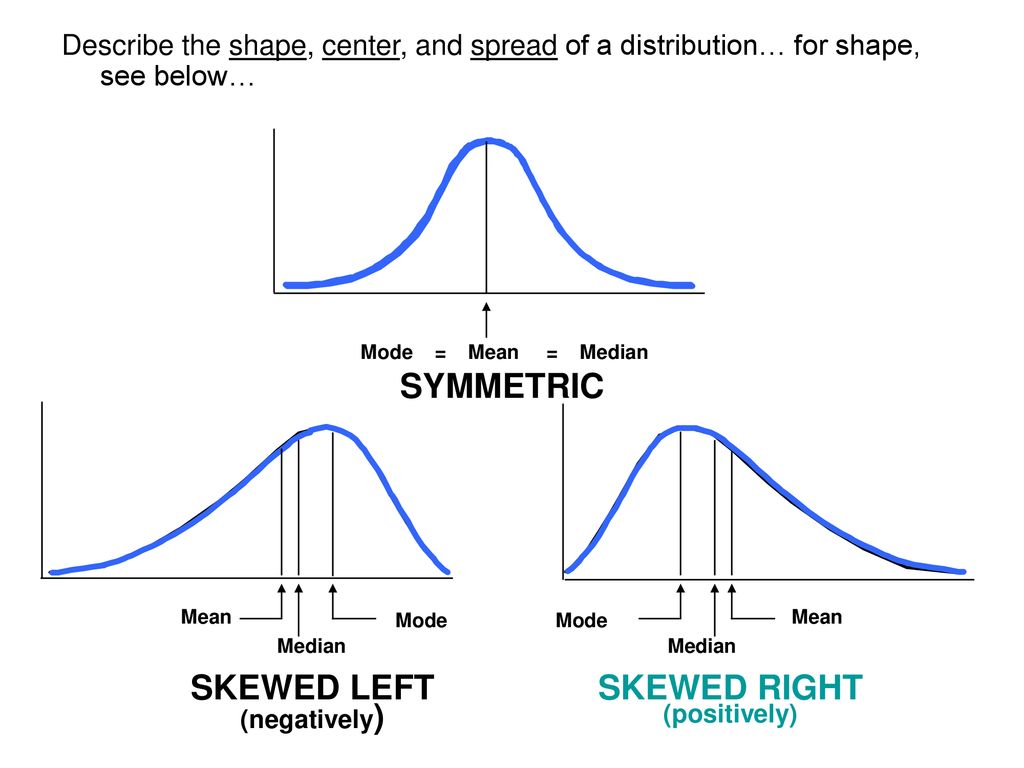
Three Skews of Graphs: Skew left, skew right, symmetric
Note how skew affects where mean and median will be
What is the appropriate acronym for describing a distribution?
SOCCS
S- Shape (Distribution/Skew)
O- Outliers/Unusual features (Gaps)
C- Context
C- Center (Mean, Median)
S- Spread (Range [Max-Min], IQR)
Mean
Average (Sum of all terms / # of terms)
Median
Exact middle number within a set
i.e {4,6,9,11,12}
Q1/Q3
Exact middles of the lower/upper halves of a data set
{1,2,3,4,5,6,7}
IQR
Q3-Q1
Represents the spread of the middle 50% of the data set
Sx/Standard deviation
Average distance each value is from the mean
What are the two ways to calculate outliers?
1.5 x IQR
Mean ± 2Sx
Nonresistant vs Resistant
Affected by outliers (Mean, Sx, Range) vs
Not affected by outliers (Median, IQR)
What values make up a 5-number summary?
Minimum, Q1, Median, Q3, Maximum
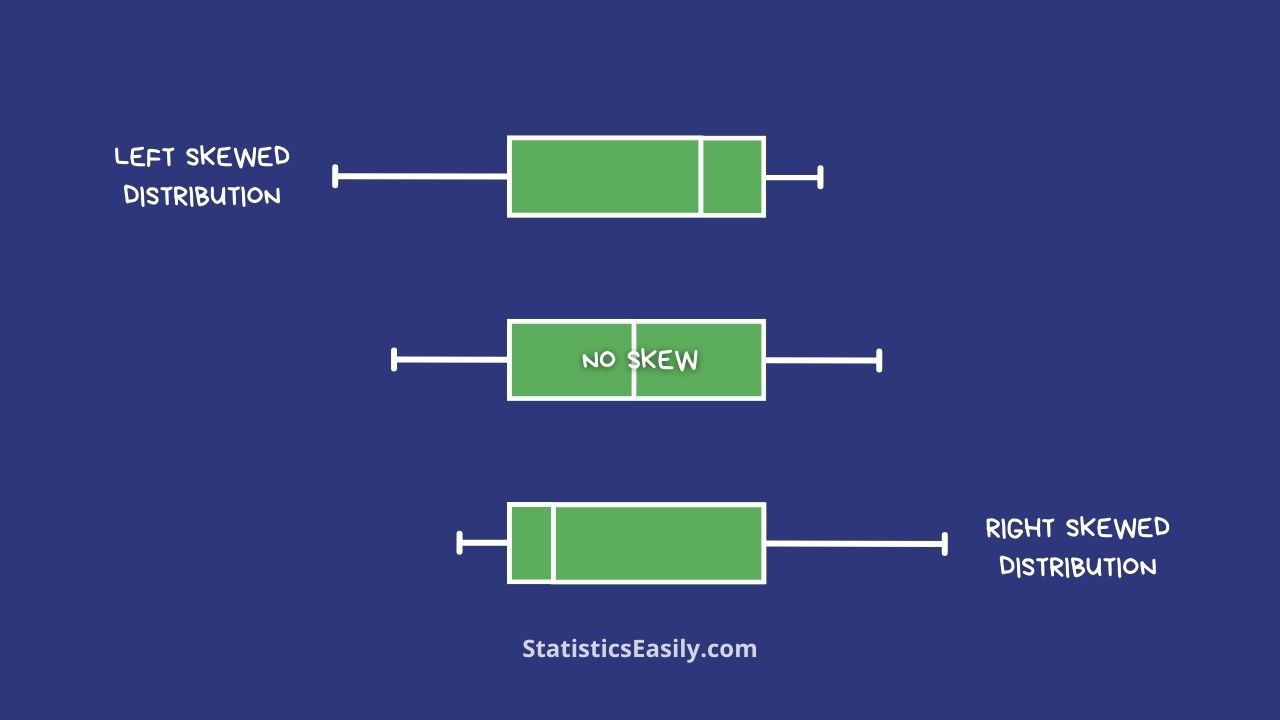
Boxplots’ Demonstration of Skew
Percentile
Percent of values less than or equal to the given number
Z-Score
How many standard deviations above or below the mean a given value is
(Individual value - Mean)/Standard deviation
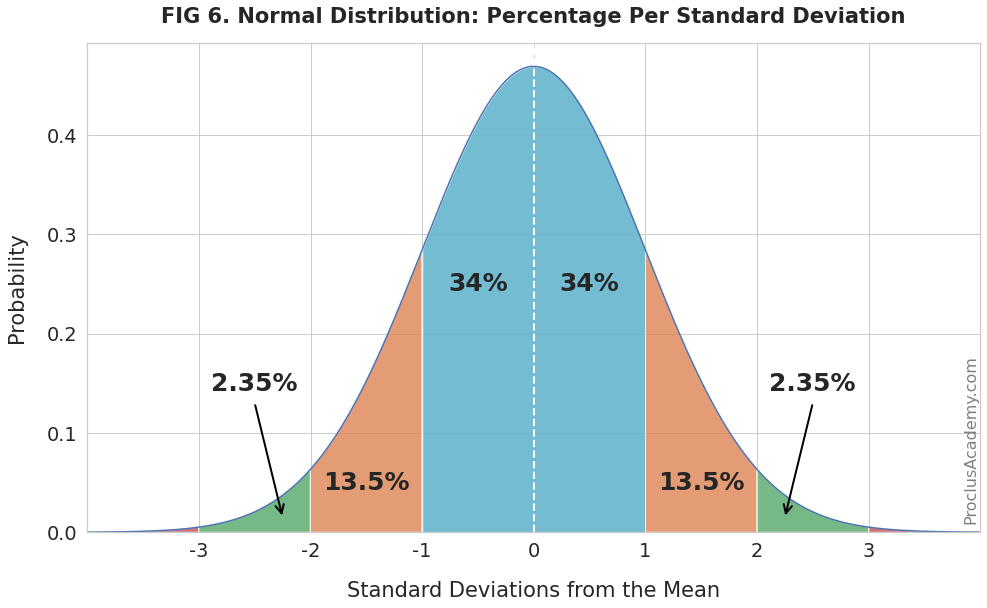
Memorize the percents of the mean ± Standard deviations on a normal model
Important Calculator functions
Probability that a specified variable falls within a certain range:
Normalcdf: (Min, max, mean, standard deviation)
Finding an exact point along the curve:
Normalpdf: (Given point, mean, standard deviation)
Finding a point given its percentile:
InvNorm: (Percentile in decimal form, mean, standard deviation)