Logistic Growth and Life History Strategies
1/59
There's no tags or description
Looks like no tags are added yet.
Name | Mastery | Learn | Test | Matching | Spaced | Call with Kai |
|---|
No analytics yet
Send a link to your students to track their progress
60 Terms
Logistic Growth Equation
Models the effects of density and invokes carrying capacity.
Pearl and Reed (1920)
Introduced the logistic growth equation.
dN/dt
Represents the change in population size over time.
rmax
Intrinsic growth rate; maximum possible growth rate during early growth.
K
Carrying capacity of the environment; the maximum number of individuals of the same species that the environment can support.
N
Population size.
Cockroach Population Example
A dormitory can sustain a population of 3000 roaches (K=3000).
Maximum Reproductive Rate (rmax)
For a typical dorm roach population, rmax is 1.55.
Calculation of r
When N = 2000, r is calculated as r(2000) = (1.55)(2000)((3000-2000)/3000).
Final Calculation of r
r = (1.55)(1000/3000) = (1.55)(0.33) = 0.52.
Life History Traits
Major components of individual fitness.
Ecological Conditions
Conditions that favor particular life history strategies.
Life Table
Contains assumptions and can answer questions about population dynamics.
Age-specific Survival Rates
Estimated from population cohort data.
Age-specific Reproductive Output
Estimated from life table data; requires specific information to estimate.
Population Growth Indication
Life tables indicate whether a population is growing.
Life History Traits
Phenotypes that affect the life history strategy of an individual.
Life History Strategy
Age-specific schedule of survival and reproduction determined by the distribution of energy across survival, growth, and reproduction at different ages.
Offspring number
A measure of how many offspring an organism produces.
Size and age at sexual maturity
The physical size and age at which an organism can reproduce.
Dwarf superpunch males
Males that sexually mature at birth.
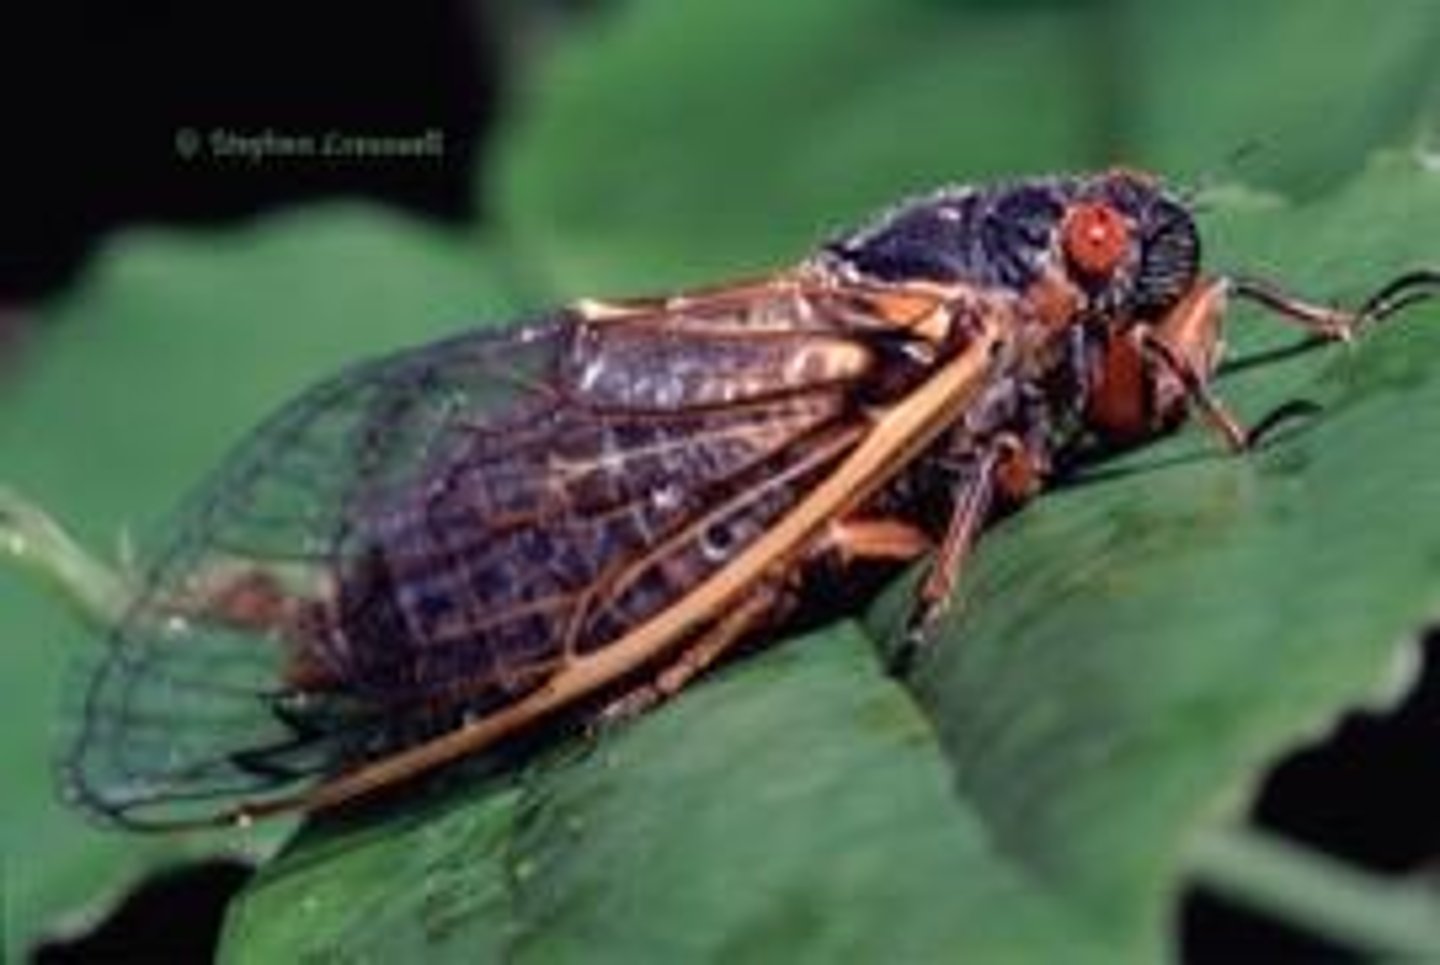
Magicicada
A species that produces 300 million eggs and has 1 offspring every 5 years for 17 years.
Life span
The duration of time an organism lives.
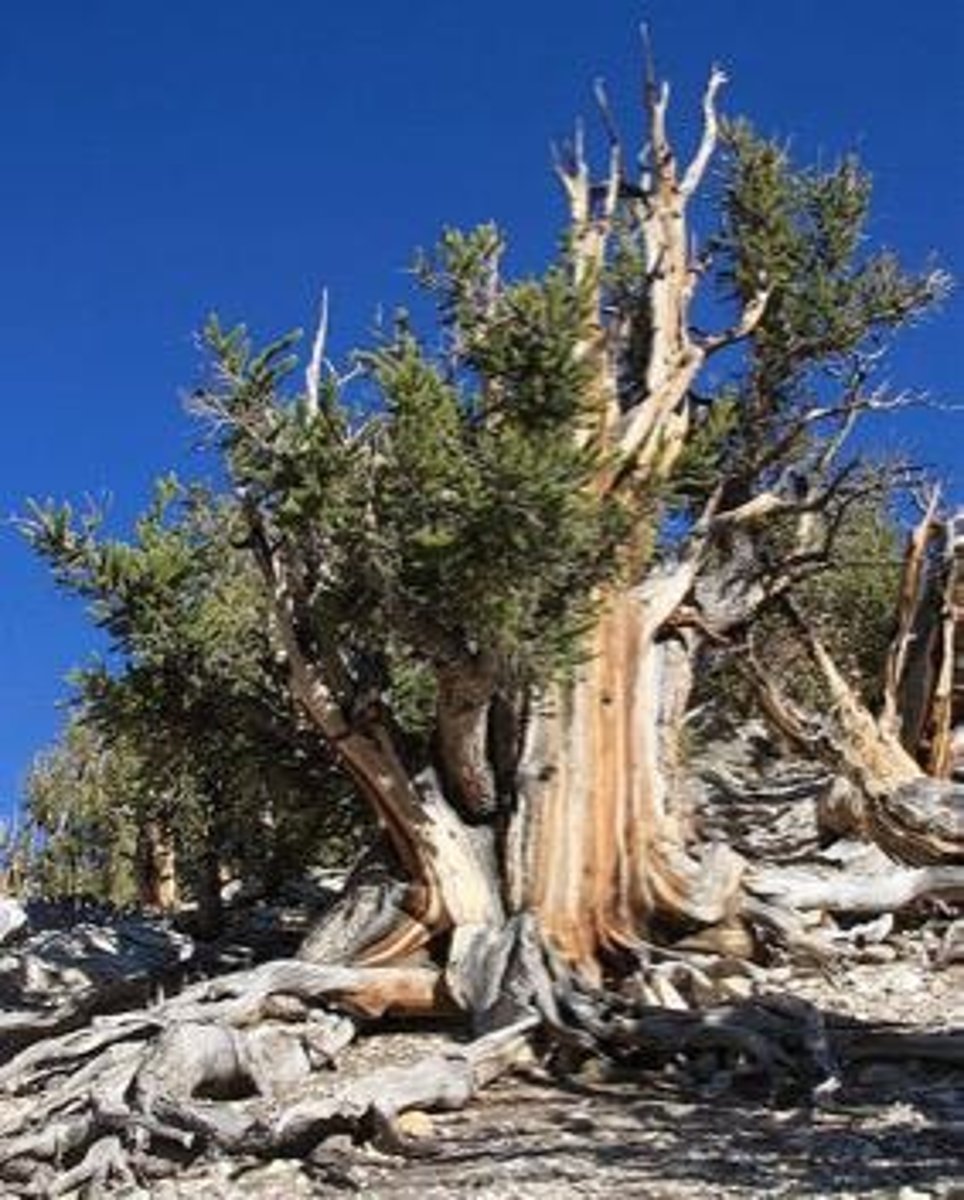
Bristlecone pine
A species known for its long life span.
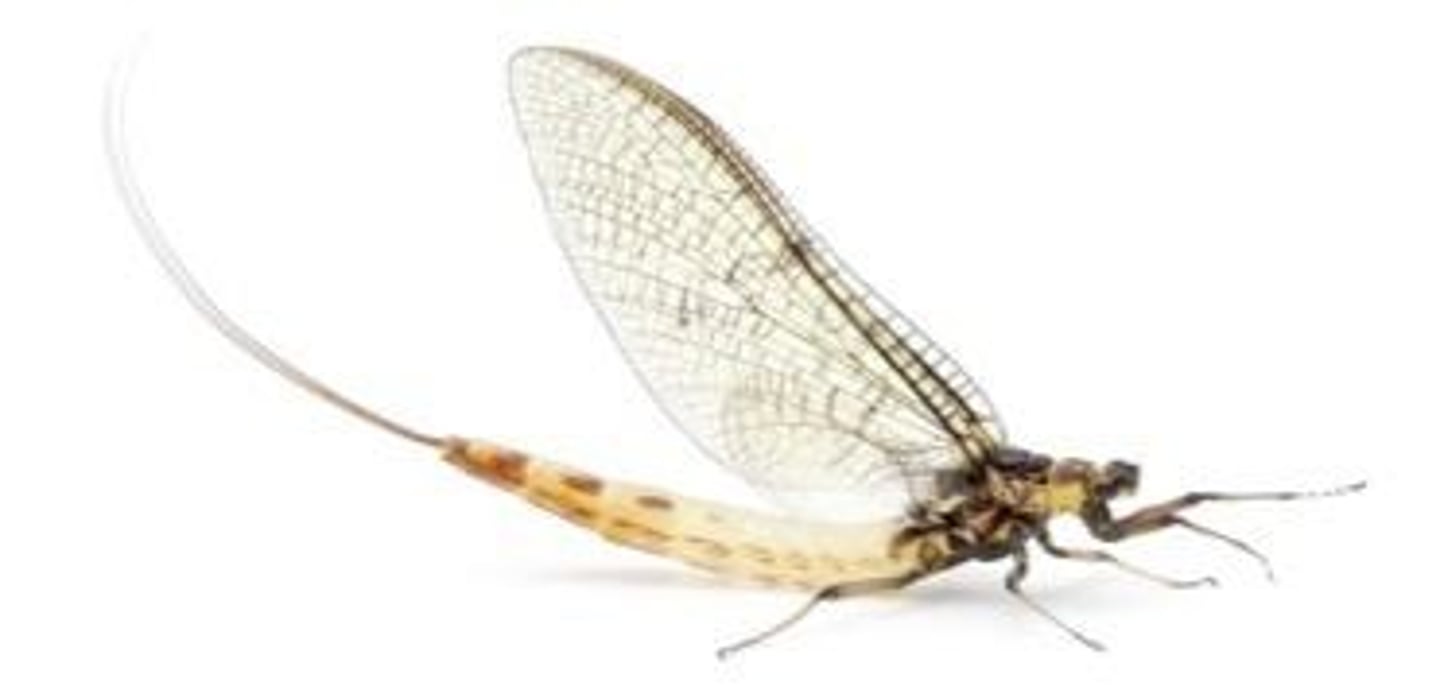
Mayfly
An organism with a life span of 1 day.
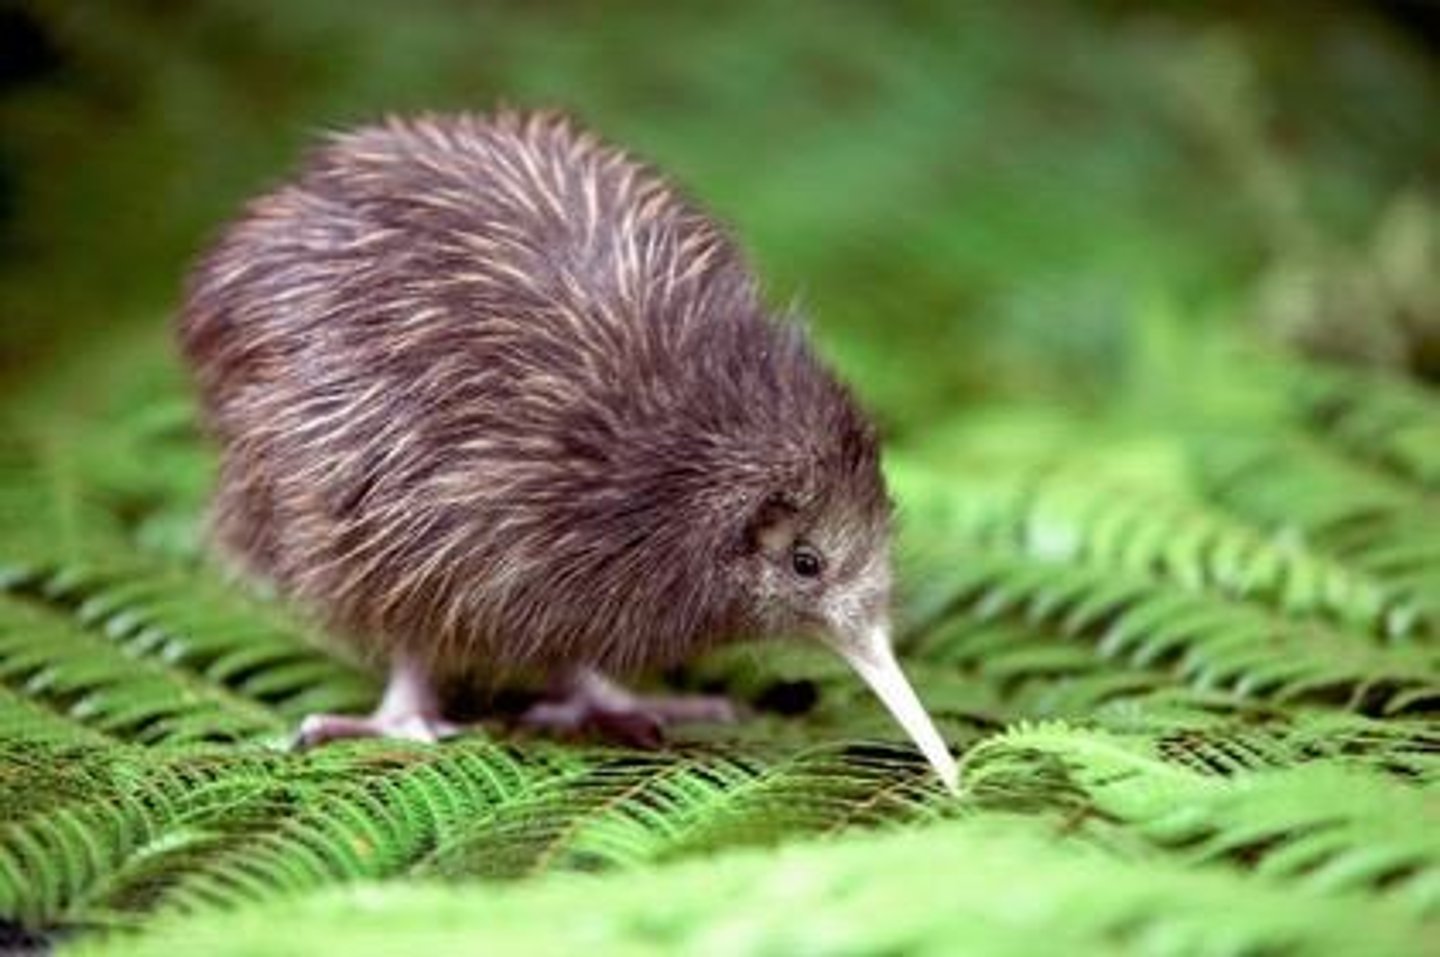
Kiwi (bird)
Lays eggs that weigh half of the mother's weight.
Darwinian Demon
An organism that reproduces at birth, produces an infinite number of offspring, and lives forever.
Trade-offs among traits
Limited energy and competing demands that produce compromises among life history traits.
Optimal Life History Strategy
A strategy that varies with ecological characteristics such as abiotic conditions, community composition, and resource availability.
Life-history continuum
A spectrum ranging from low fecundity and high survivorship to high fecundity and low survivorship.
High adult mortality rates
Selection favors high levels of energy allocation to reproduction, early age at sexual maturity, many small offspring.
High juvenile mortality rates
Selection favors delayed allocation to reproduction, later age at sexual maturity, fewer large offspring.
Trinidadian guppies (Poecilia reticulata)
A species used to study the effects of predation on life history traits.
High adult predation
Occurs below waterfalls where large predators eat large guppies, resulting in high adult mortality.
High juvenile predation
Occurs above waterfalls where small predators eat small guppies, resulting in low adult mortality.
Life Tables
Tools that summarize age-specific survival and reproduction for a given population.
Mortality risk
The likelihood of death faced by individuals at different ages.
Reproductive allotment
The allocation of energy towards reproduction in relation to survival and growth.
Population growth rate
The rate at which the number of individuals in a population increases.
Estimated future population size
A prediction of how many individuals will be in a population at a future date.
Cohort Life Table
A life table that follows a cohort of individuals over time.
Static Life Table
A life table that provides estimates of age structure and vital rates as a snapshot in time.
Fecundity
The potential reproductive capacity of an individual or population.
Survivorship
The proportion of individuals surviving at each age interval.
Mortality rate (qx)
The rate at which individuals in a specific age group die.
Proportion surviving (lx)
The proportion of the original cohort surviving to age 'x'.
Number alive (nx)
The number of individuals alive at the beginning of age 'x'.
Number dying (dx)
The number of individuals dying in the interval from year 'x' to 'x + 1'.
Life Table Construction
The process of creating a life table using raw data on survival and reproduction.
Assumptions of Life Table models
Assumptions made when constructing life tables, such as an all-female population.
Cohort tagging
The process of tagging a cohort of individuals to track their survival over time.
Census population yearly
The annual counting of tagged individuals to determine survivors.
Age interval
The specific age range used to gather data in life table construction.
Cohort of individuals
A group of individuals of the same age that are studied over time.
Age-specific survival
The survival rate of individuals at specific ages.
Investment in reproduction
The allocation of resources by individuals towards reproduction at different ages.
Smith 1988
A reference to a study or publication related to life tables.
Observed years
The actual years during which data is collected for life table analysis.
Probability of survival (lx)
The likelihood that an individual will survive from birth to age 'x'.
Cohort surviving at start of age interval (nx)
The number of individuals from the original cohort that are alive at the beginning of a specific age interval.