HuG UNIT#1
1/85
There's no tags or description
Looks like no tags are added yet.
Name | Mastery | Learn | Test | Matching | Spaced |
|---|
No study sessions yet.
86 Terms
Confirmation Bias
Tendency to search for information that confirms one’s prior beliefs
Signal Boosting
Sharing online content with one’s followers to raise awareness
Distortion
Every map is a distortion because it is a globe put on a flat surface
shape
size
direction
distance
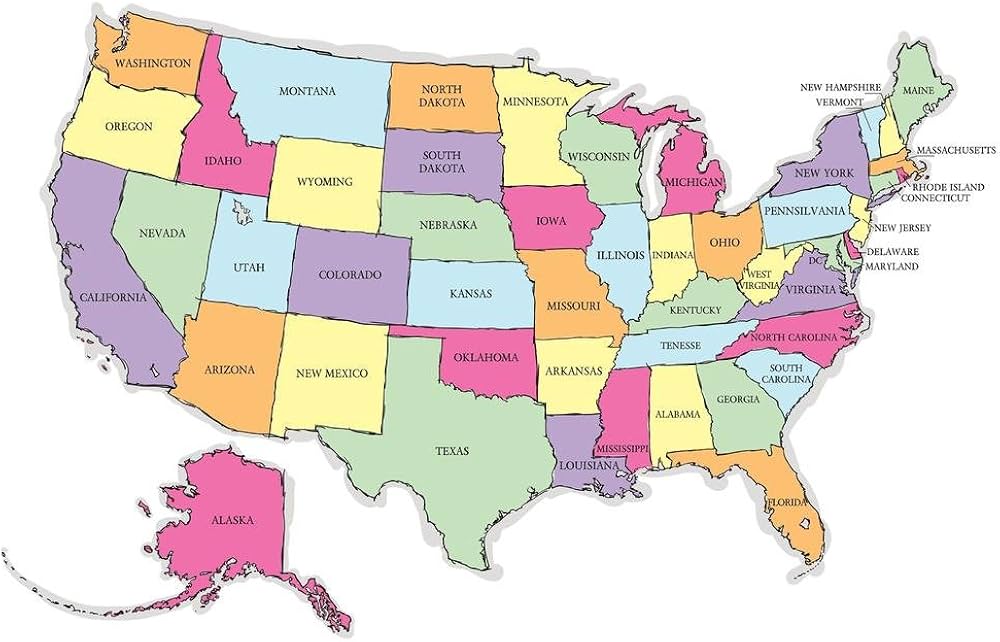
Map
Representation of a place
Cartography
Practice of making maps
Reference Maps
Graphic representation of the environment
Needs 1/5 of these
A point of view (birds eye view)
Reduced Scale
Generalized Representation
Symbolized representation
Globe projection on flat surface
Longitude
Connects North and South Poles
bases of telling times and time zones
lines are called meridians
measured to max of 180 from the prime meridian
Latitude
lines that are circles around the globe parallel to the equator
measured in degrees, minutes and seconds
latitude measured to max of 90 degrees North or South of the Equator
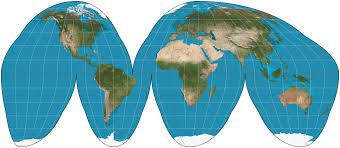
Interrupted Projections
Leave empty space in between less populated areas on a map like oceans
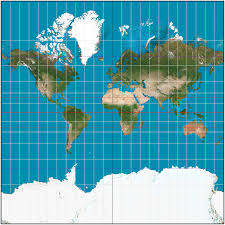
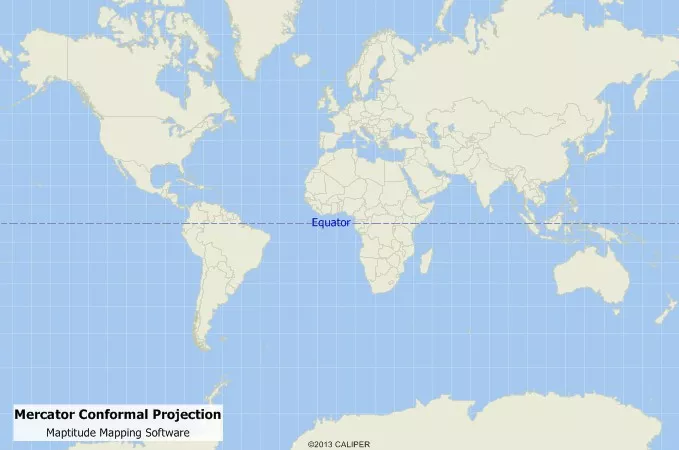
Mercator
A cylindrical projection
1569 by Gerardus Mercator, Parallel lines of longitude and latitude
True to direction
Accurate Shape
Sizing is extremely incorrect
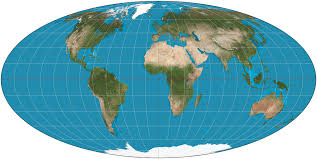
Mollweide
Equal area map
good with size

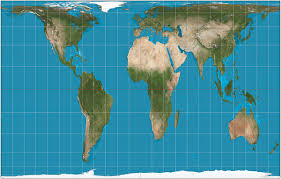
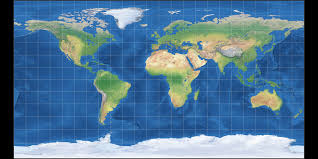
Gall Peters Projection
Correct in size but not in shape
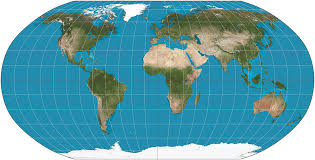
Robinson
Comprise of size and shape
1988
Absolute Location
Precise location using coordinates, latitude and longitude, measured by GPS
Quantitative
Relative Location
In relation to other locations
qualitative
Conformal Maps
Good with direction and accuracy of angles
mercator
used for GPS
Equal Area Maps
General size bad shape
Gall Peters
Compromise Maps
in between both
not perfect but pretty
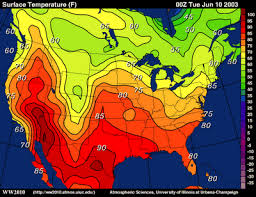
Thematic Maps
Maps that tell data
population density
weather
how something is
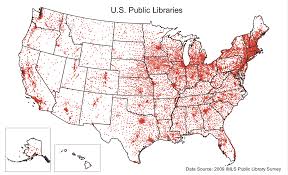
Dot Distribution Maps
Shows data distributed in dots
limits with dense areas
only tells one thing
shows exact area
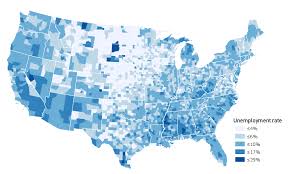
Choropleth Maps
Color coded ranges of data
doesn’t show distribution within colored area (generalization of an area)
good for Nationwide data
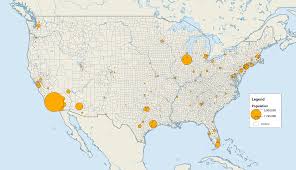
Graduated symbol Maps
Different size of symbol to represent scale of the phenomena
hard to tell in dense populations (one area overpowers another limiting accuracy)
shows exact area
Isoline Maps
Goes across accepted lines of separation to show trends
change in color shows differences
hard to tell borders
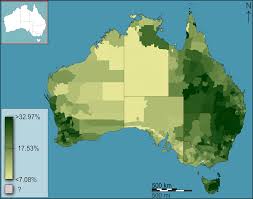
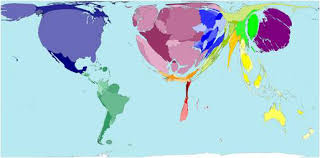
Cartogram Maps
Map that changes size of areas based on relative intensity of phenomena
less common
hard to tell changes in size
kinda really ugly
Scale
small scale = big picture
large scale = small picture
can be used in political ways
GPS
Global positioning system
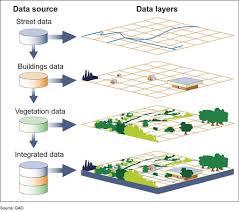
GIS
Geographic information system
layers of geographic data
Remote Sensing
Real time satellite data
Sense of Place
characteristics that give a place a specific identity
geography, topography, plant life, vernacular architecture
Mental Maps
representation of part of earth’s surface based on individual knowledge
Spatial Patterns
relationships in the data
distance
direction
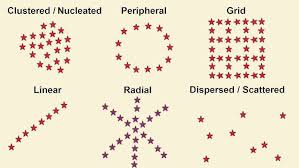
Clustered
grouped together/clumped
Dispersed
scattered
ESPN
Economic, Social, Political, Environments
Cultural Landscape
Built by humans or any part of a landscape that has cultural meaning
Vernacular Architecture
architecture built according to local needs, materials, and traditions
Sequent Occupance
multiple cultures leave their mark on a place over time
Toponyms
place names
Nature-Culture Dualism
Man is separate from nature
culture is a product of man removing himself from the Natural State
Culture Ecology
People always have a relationship with nature, and generally speaking it is strong
Environmental Determinism
Darwinism : natural factors control the development of human physiological and mental qualities
rigid
rejected in 1940-1950
Environmental Possiblism
critique of determinism
nature doesnt always determine the outcome
nature provides people with conditions
people use creativity to adapt to the environment
Human Modified the Earth
1940-1950
how we transform natural landscapes
turn natural into cultural landscapes
Earth as Dynamic
balance should be considered a natural system
Formal/uniform region
Shares common traits that are measurable \
language, soil, climate
admininstrative regions
Formal regions
uniform membership functions
Every place in the region is fully and equally a part of that region
states, counties, districts
Functional/Nodal Regions
Centered around a specific activity
radio, utility, delivery services
node/point of origin from which the network is centered
Perceptual Region/Vernacular Region
Informal, designed by peoples beliefs
tendency to generalize
vague boundaries and non-uniform membership
Population Concentration
2/3 of the worlds people are clustered in 4 regions
East Asia
South Asia
Southeast Asia
Europe
fertile soill and temperate climate
near oceans and rivers
Arithmetic Density
number of people per unit of land
Physiological Density
number of people per unit of arable land
carrying capacity
maximum population size of a biological species that can be sustained by that specific environment given the resources
agricultural density
number of farmworkers per unit of arable land
relative efficiency of agriculture
sparsely populated regions
humans avoid clustering in certain physical environments
dry lands, wet lands, cold lands, and high lands
only a few places sin the world don’t have permanent settlements
Ecumene
permamnent human settlements
Replacement rate
in order to manintain the same population
TFR 2.1
Crude birth rate
Annual number of births per 100 people
Crude death rate
annual number of deaths per 1000 people
total fertility rate
Average number of children a woman is expected to have during ages (15-45)
Anti-Natalism
no births
Pro-Natalism
make babies
Life Expectancy
Average length of time from birth that a person is expected to live given death rates
Blue Zones
places where people live exceptionally long
Infant mortality rate
deaths of infants of under one year of age per 1000 births
Rate of natural increase
% of annual growth of population excluding migration
CBR - CDR/10
Doubling time
how long it woukd take for the percentage to double at the currnet RNI
RNI/70
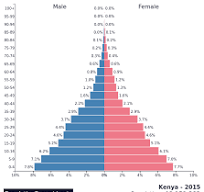
Population pyramids
Age and sex structure of region at a specific time
Tree
young people
expansive
high birth rate and high death rate
ex:Mali, Somalia, and the world
Cup
fallen birth rate
older people
constrictive
becomes a kite
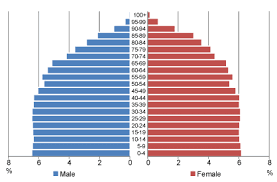
Box
steady and stationary
age dependency
ex: USA, Ireland and Argentina
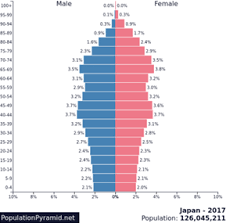
Kite
aging
cup becomes a kite
Examples: Italy and Japan
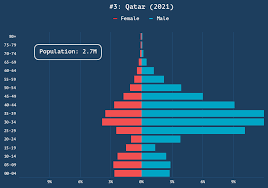
Irregular
war, famine, disease, GUEST WORKERS
ex: Qatar, Philippines, Nepal, Baharan
disproportion of gender or other factors
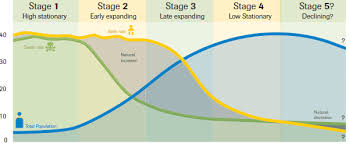
Demographic Transition Model
make sense of historical developments in population
relationship between death rates and birth rates
how economic developments have shaped population
Stage 1: low growth
high birth rates and death rates (fluctuated)
no population growth
Stage 2: increase
high birth rates
low death rates
low infant mortality rates
after WWII
Stage 3: Explosition
birth rates falls
death rates fall
population peak
Ex: India
Stage 4: Decline birth and death rates
decline of birth rates
decline of death rates
Stage 5: Recent birth rates below death rates
recent!
birth rates below death rates
ex: JPN
Thomas Malthus
English economists
“essay on the principle of population” 1798
built on Adam Smith
“Overpopulation”
England 1st to stage 2 DTM
theory : more people than food: population grows faster than agriculture
Mathusian trap
underestimation of industrial innovations
Neo Malthusians
20th century revitalization
population pressures → downfall
earth resources can only support so many
leads to war and famine
Ehrlich theory
Population bomb!
destruction of environment due to increased population → poor get poorer
decreasing birthrates → only way to save us
Boserup
built on marx’s idea of criticizing mathus
idea that overpopulation is due to underemployment and capitalism
past agricultural improvements are brought by population pressures
new ways to use land and labor
population growth → stimulate development
Cornucopia
Julian Simon
man creates resources from ingenuity
ingenuity is the ultimate resource
Epidemiological Trantision model
theory that explains changes to mortality in nation connected to DTM
Stage 1: Pestilence and famine
infectuous and parasitic diseases, crop failures, animal attack
endemic: local
Epidemic: spreads through region
Pandemic: across regions
Stage 2: Receding Pandemics
improved sanitation, better food and security, medicine
pandemics are still a slight issue
increased life expectancy
Stage 3: Degenerative Diseases
Fewer infection related deaths
rise in death from aging
high life expectancy
Stage 4: Delayed Degenerative and Lifestyle diseases
Life expectancy at the highest
better diets and medical advancements
increase obesity rates
Stage 5: Reemergence of infectious disease
resistance of anti-biotics
dieases mutations
lowering life expectancy and rising urbanization