Microeconomics Test 1 Flashcards
0.0(0)
Studied by 1 person Call Kai
 Learn
Learn Practice Test
 Spaced Repetition
 Match
Match Flashcards
 Knowt Play
Card Sorting
1/70

Earn XP
Description and Tags
Last updated 5:36 PM on 9/26/22
Name | Mastery | Learn | Test | Matching | Spaced | Call with Kai | Chat |
|---|
No analytics yet
Send a link to your students to track their progress
71 Terms
1
New cards
economics
the study of how individuals and societies allocate their limited resources to satisfy their practically unlimited wants
2
New cards
economy
system that coordinates society’s productive activities
3
New cards
scarcity
limited and desirable; choices are necessary because resources are scarce
4
New cards
resources
land (nature resources), labor, and capital (things that produce other things)
5
New cards
microeconomics
the study of individual units that make up the economy, focus on individuals, businesses, and industries
6
New cards
macroeconomics
the study of overall aspects and workings of an economy, focus on big picture
7
New cards
incentives
factors that motivate you to act or exert effort (positive, negative, direct, indirect)
8
New cards
trade-offs
with scarce resources, people have to choose some things over others
9
New cards
opportunity cost
the next-best alternative that must be sacrificed to get something else
10
New cards
marginal thinking
evaluating whether the benefit of one or more unit of something is greater than or equal to the cost
11
New cards
trade creates value
the voluntary exchange of goods/services between 2 or more parties allows specialization and exchange of goods
12
New cards
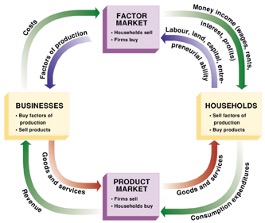
circular flow diagram
shows how goods, services, and resources flow through the economy
13
New cards
model
simplified versions of reality to understand complex situations in the world; good models are simple, flexible, and accurate in making predictions
14
New cards
positive statement
can be tested (T/F); describes what is
15
New cards
normative statement
an opinion cannot be tested or validated; describes what ought to be
16
New cards
ceteris paribus
“other things being equal”, central assumption in model building
17
New cards
endogenous
variables that are inside a model
18
New cards
exogenous
variables that are outside a model (cannot be accounted for in a model)
19
New cards
production possibilities frontier (PPF)
model that illustrates the combinations of outputs a society can produce of all of its resources are being used efficiently
20
New cards
Efficient
resources are fully utilized, potential output is maximized (on PPF)
21
New cards
inefficient
wasting resources (under PPF)
22
New cards
feasible
possible (on or under PPF)
23
New cards
not feasible
not possible (above PPF)
24
New cards
opportunity cost
slope on PPF (for x-axis use slope, for y-axis use reciprocal of slope)
25
New cards
law of increasing opportunity cost
the opportunity cost of producing a good rises as society produces more of it
26
New cards
bowed out versus straight line
straight line means constant opportunity cost of both goods; bowed outward means resources are not all equally productive in all activities
27
New cards
shifts in PPF
occurs because of new resources or technology
28
New cards
specialization
the limiting of one’s work to a particular area
29
New cards
absolute advantage
ability to produce more of a good or service than a competitor (who can produce more?)
30
New cards
comparative advantage
the ability to produce a good or service for a lower opportunity cost than a competitor (who has lower opportunity cost?)
31
New cards
gains from trade
each person can consume more than they otherwise could have
32
New cards
short run
the period in which me make decisions that reflect our immediate or short-term wants, needs, or limitations (consumers can only partially adjust behavior)
33
New cards
long run
the period in which we make decisions that reflect our needs, wants, and limitations over a long-term horizon (consumers have time to fully adjust to market conditions)
34
New cards
consumer goods
goods produced for current consumption (ex: food)
35
New cards
capital goods
goods that help produce other valuable goods (ex: factories)
36
New cards
investment in capital instead of consumer goods
allow an economy to expand its PPF in the future
37
New cards
supply and demand model
model of how a competitive market behaves
38
New cards
market economy
resources are allocated among households and firms with little to no government interference
39
New cards
command economy
resources and production are controlled by a central government
40
New cards
invisible hand
guides resources to their highest valued resources
41
New cards
3 characteristics of a competitive market
many buyers and sellers, goods sold are similar, no one individual has any influence over the prices
42
New cards
demand
behavior of buyers
43
New cards
quantity demanded
the amount of a good buyers are willing and able to purchase at the current price
44
New cards
demand schedule
table of relationship between price and quantity
45
New cards
demand curve
graph of relationship between price and quantity
46
New cards
law of demand
inverse relationship between price and quantity demanded
47
New cards
market demand
horizontal sum of all individual quantities demanded by each buyer in the market at each price
48
New cards
what shifts demand curve?
Change in non-price factors (income, related goods, tastes and preferences, price expectations, number of buyers in the market, taxes and subsidies)
49
New cards
What causes movement along the demand curve?
Change in price
50
New cards
normal goods
consumers buy more of a normal good as income rises, holding all other factors constant
51
New cards
inferior goods
demand declines as income rises
52
New cards
substitutes
two goods that are used in place of each other (when the price of a substitute good rises, the quantity demanded of that good falls, and the demand of the related good goes up)
53
New cards
complements
two goods that are used together (when the price of a complementary good rises, the quantity demanded of that good falls, and the demand for the related good decreases
54
New cards
supply
behavior of sellers
55
New cards
quantity supplied
the amount of the good of service that producers are willing and able to sell at the current price
56
New cards
supply schedule
table of relationship between price and quantity supplied
57
New cards
supply curve
graph of relationship between price and quantity supplied
58
New cards
law of supply
all else equal, there is a direct relationship between price and quantity supplied
59
New cards
market supply
horizontal sum of all individual quantities supplied by each seller in the market at each price
60
New cards
what shifts the supply curve?
Change in non-price factors (input costs, technology developments, taxes and subsidies, number of firms, price expectations)
61
New cards
what causes movement along the supply curve?
Change in price
62
New cards
input
resources used in the production process
63
New cards
equilibrium
when quantity supplied equals quantity demanded at a certain price
64
New cards
equilibrium price
the price at which the quantity supplied is equal to the quantity demanded (market-clearing price)
65
New cards
equilibrium quantity
the amount at which the quantity supplied is equal to the quantity demanded
66
New cards
surplus (excess supply)
market condition when the quantity supplied of a good is greater than the quantity demanded
67
New cards
shortage (excess demand)
market condition when the quantity supplied of a good is less than the quantity demanded
68
New cards
Be able to calculate the surplus and shortage from a graph or table
Compare Qd to Qs; when Qd>Qs = shortage; when Qs>Qd = surplus
69
New cards
What happens to the equilibrium price and quantity when demand curve shifts?
positive correlation (P↑Q↑, P↓Q↓)
70
New cards
What happens to the equilibrium price and quantity when supply curve shifts?
inverse correlation (P↓Q↑, P↓Q↓)
71
New cards
What happens to the equilibrium price and quantity when both supply and demand shift simultaneously? (how to)
draw each effect on supply and demand individually; compare both prices and quantities, the one that is consistent is the guaranteed shift, while the one that is different is ambiguous/indeterminate