Biostats
1/133
There's no tags or description
Looks like no tags are added yet.
Name | Mastery | Learn | Test | Matching | Spaced | Call with Kai |
|---|
No analytics yet
Send a link to your students to track their progress
134 Terms
What are the 4 steps of hypothesis testing?
1. Make hypothesis
2. Set criteria for decision
3. Gather data and conduct statistics
4. Make decisions (accept or reject the null)
What is a null hypothesis?
No difference; all samples from the same population and that the observed difference is due to chance (random sampling variation). Our goal is to REJECT the null
What is an alternate hypothesis?
At least one sample from different population; difference not due to chance
Do we prove Ha?
No (it's difficult); our goal is to disprove H0
What is our alpha?
a = .05
If alpha =.05, how sure are we that were correct?
95% sure; 5% chance of error
What is probability?
Chance; the likelihood that an event will occur
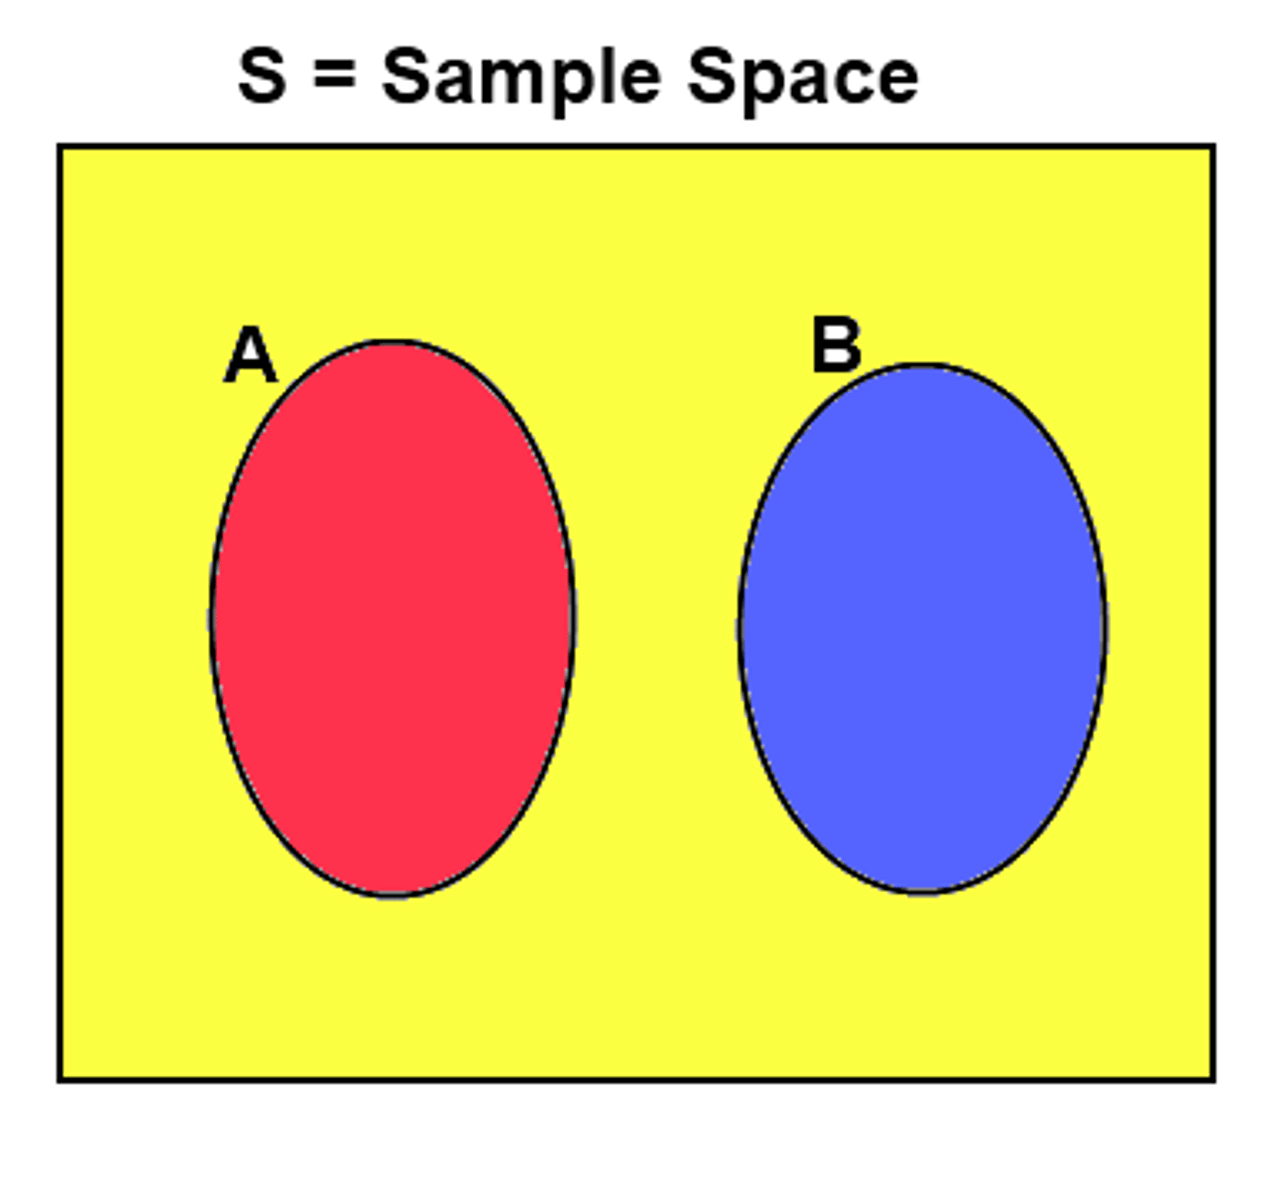
What does it mean that something is mutually exclusive?
Two events, X and Y, are mutually exclusive if occurrence of one precludes occurrence of other. Either/or but not both
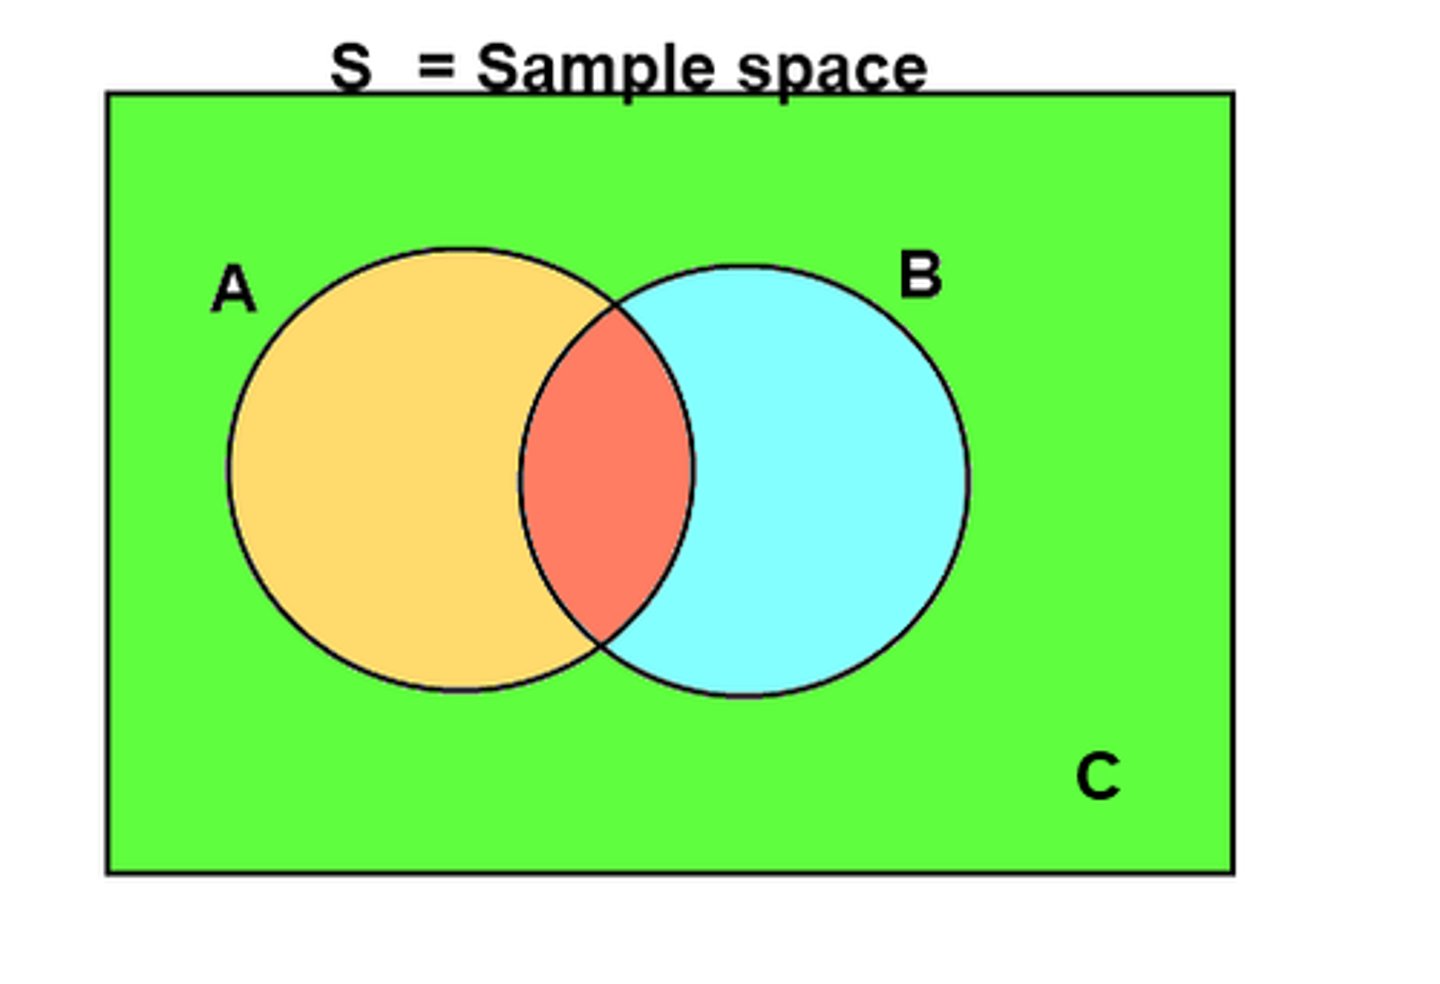
What does it mean that something has independent probabilities?
Two events, X and Y, are independent if occurrence of one has no effect on occurrence of other
What is the probability of rolling either a 2 or a 5?
1/3
What it the additive rule?
OR - If X and Y are mutually exclusive, what is the probability of getting X or Y? ADD the probability of X + probability of Y
What is the probability of rolling 6 on first roll and 5 on second roll?
1/36
What is the multiplicative rule?
AND If X and Y are independent, what is the probability of getting X and Y? Probability of X times probability of Y
What happens to probability when we use the or rule?
Probability would increase, because we only want 1 of the 2 events to occur, we're increasing our odds
What happens to probability when we use the and rule?
Probability decreases, because it is harder to get both events
one test normal: 95% chance. 9 test normal? abnormal? error one test?
What is probability one test is normal (95%). Independent we multiply so 0.95*0.95 = 0.90.
Probability 9 tests are normal (0.95)^9 = 63.0% normal. More tests = more error. 5% error on one test and 9 tests is 45%.
37% chance on test is abnormal: complement rule states: 𝑃 ( At least one abnormal ) = 1 − 𝑃 ( All normal ) P(At least one abnormal)=1−P(All normal)
What is a sample?
Selection of study subjects who will be measured on some parameter to provide information about population
Why do we sample?
Because it costs a lot of time and money to poll everyone in a population
What is selection bias? is it unethical?
Asking the people that you want to because it's convenient to you, you can't do this - you need to give all eligible participants a chance to be selected; not unethical

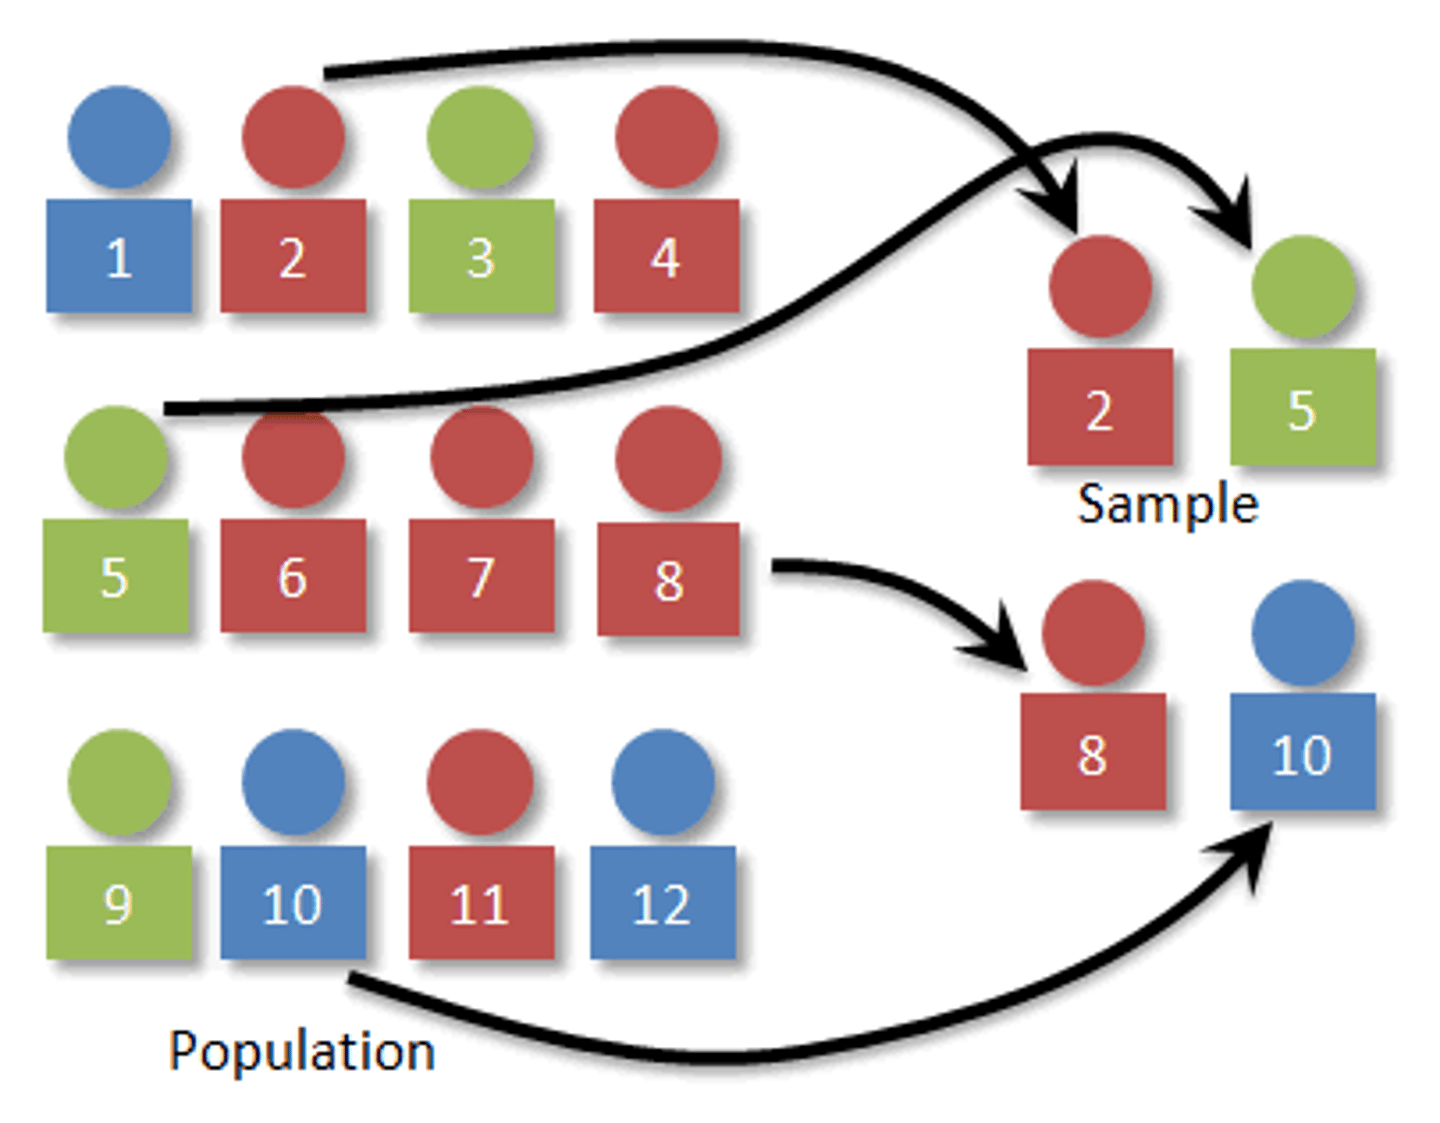
What is simple random sampling?
Each individual has an equal chance of being selected (ex. drawing names out of a hat)
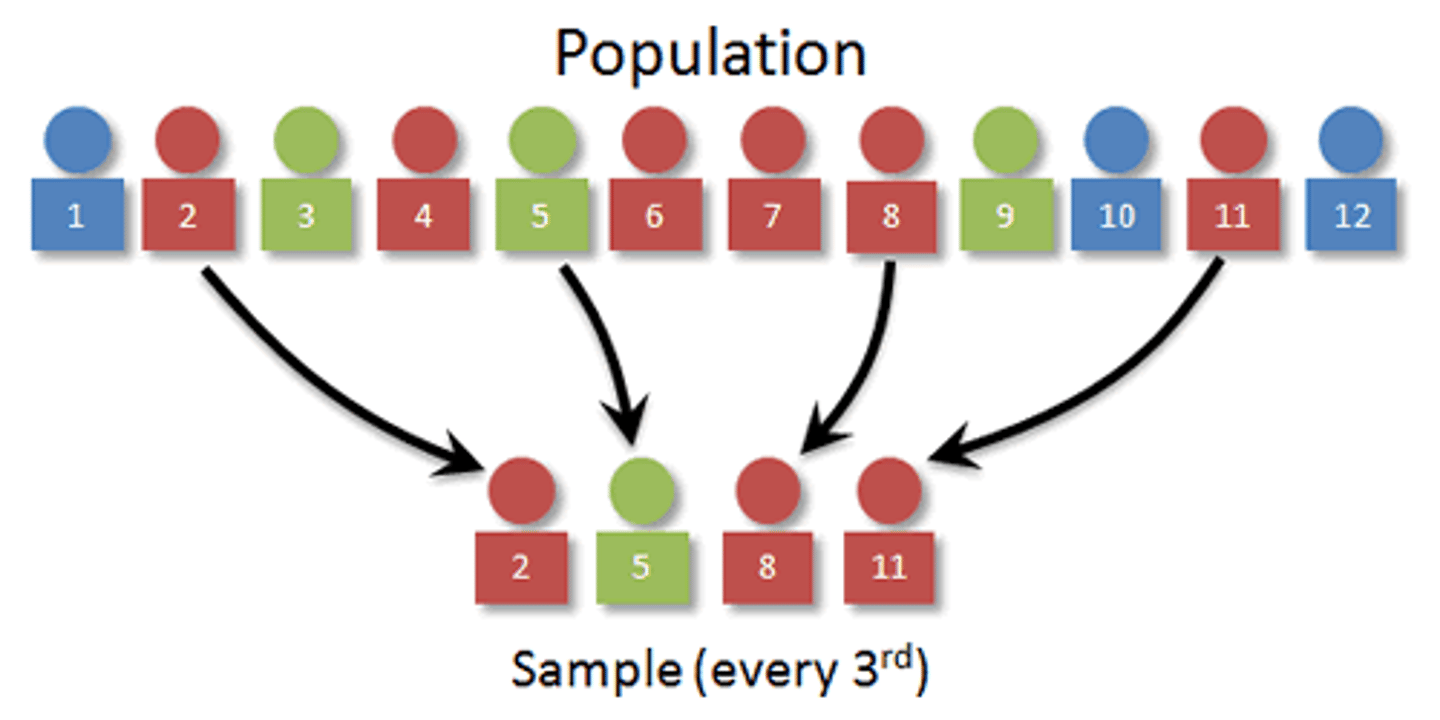
What is systematic sampling?
Select at regular intervals through ordered list. Pick random number (k), select every kth person
What is stratified sampling? (KNOW THIS ONE)
Separate population into strata based on a characteristic. Randomly select proportion of participants from each stratum
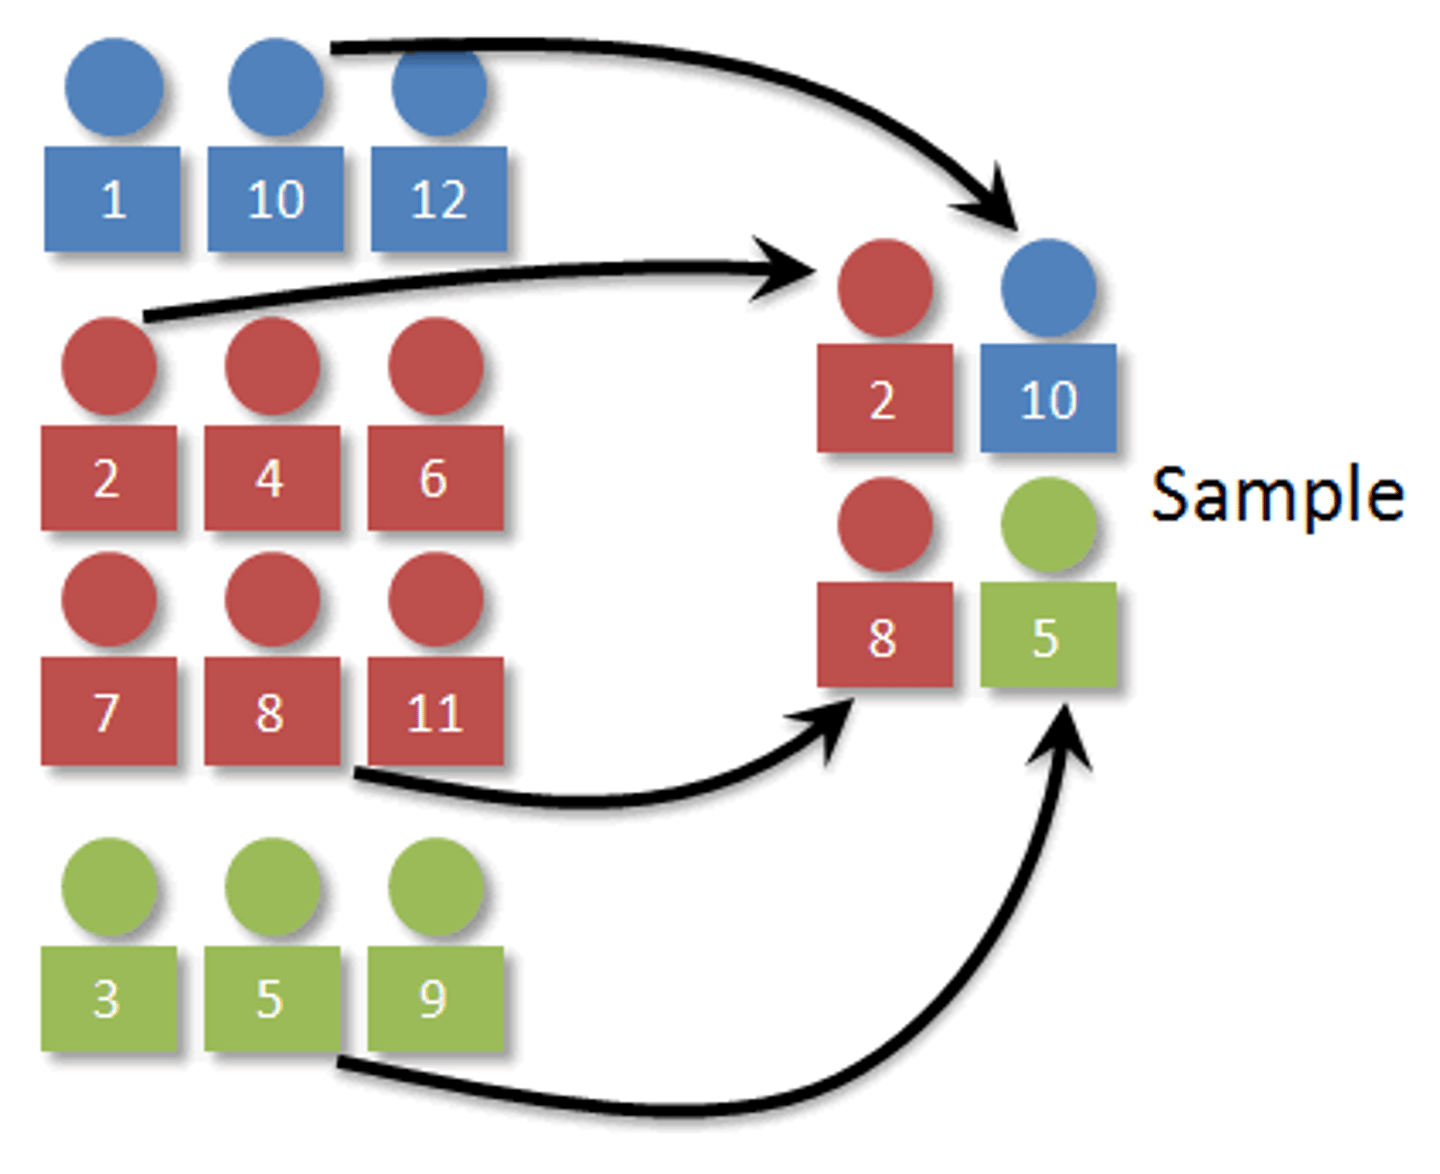
What sampling technique are we talking about if we say a representative proportion is used?
Stratified sampling
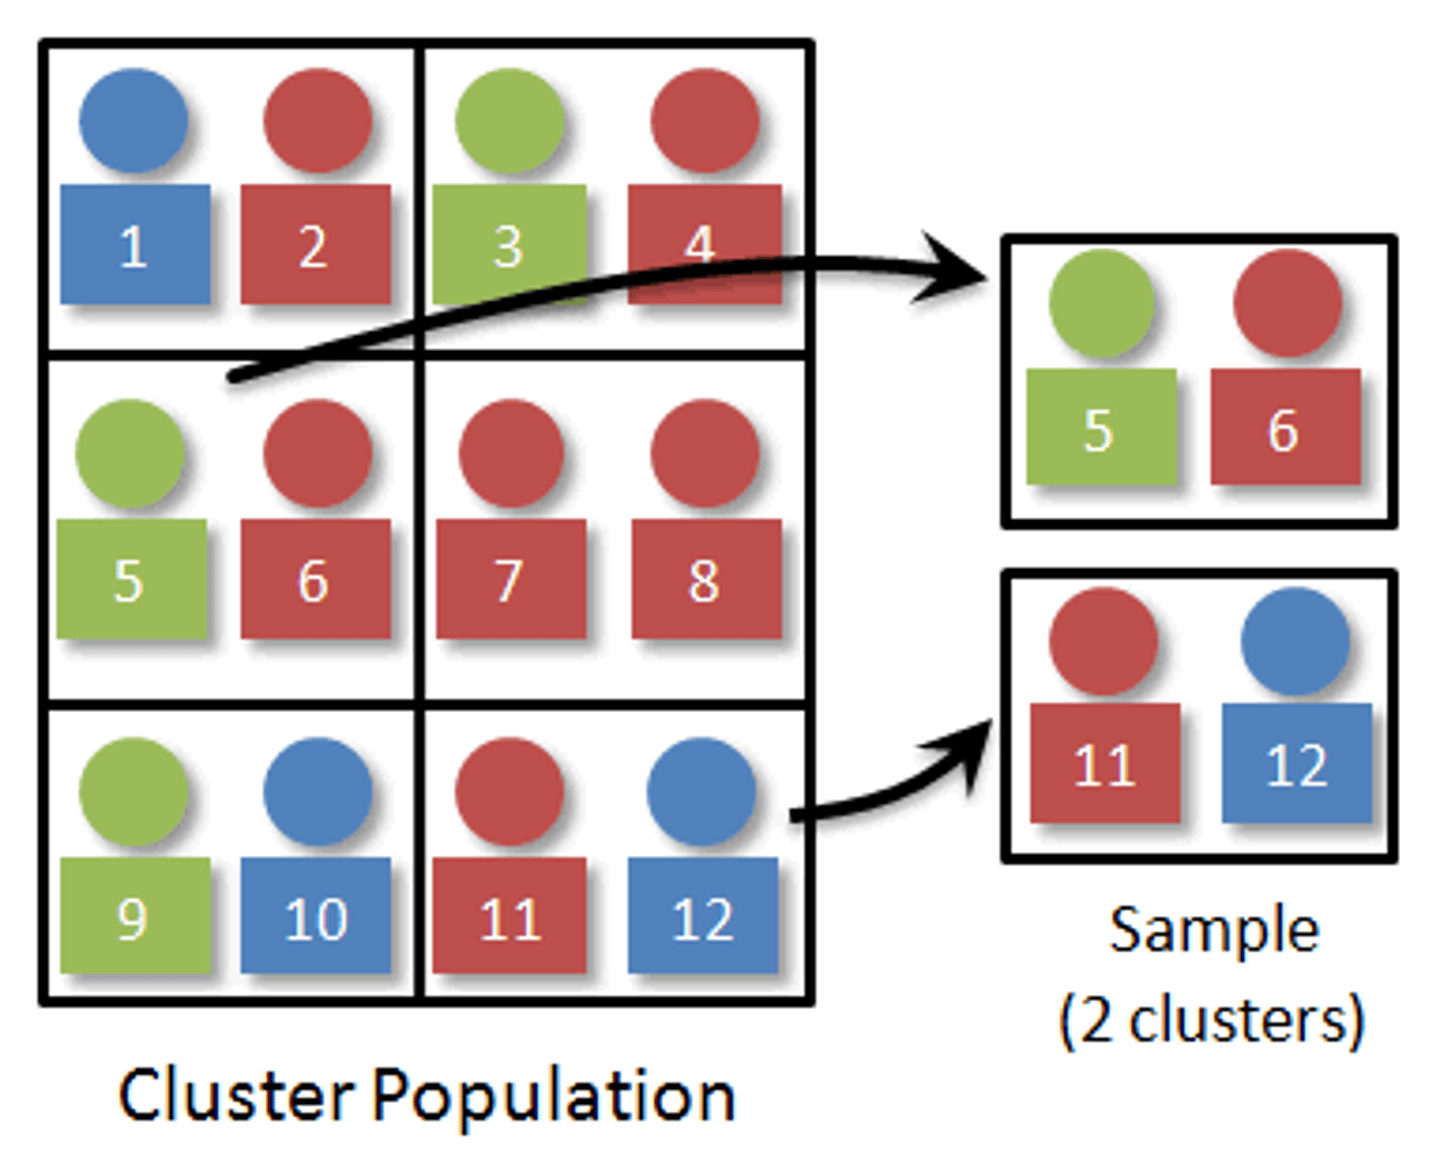
What is cluster sampling?
Population is already in strata, and we randomly select groups of strata. People are broken into already established groups (fresh, soph, junior, senior) and you pick a group (or 2) and sample everyone in that group
What is convenience sampling?
This is not science. It's cold calling and doesn't typically represent population.

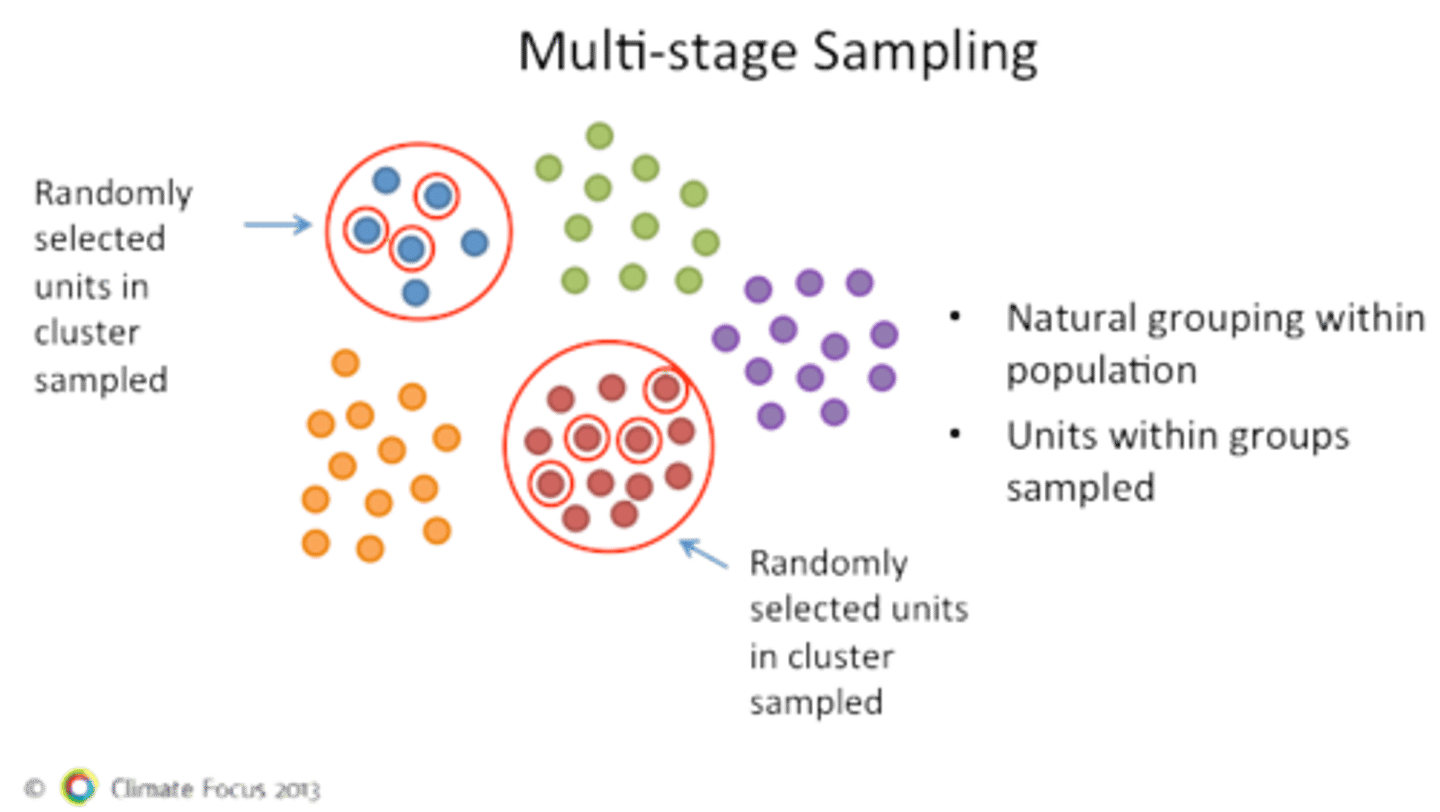
What is multistage sampling?
Combines more than 1 sampling. Surveys are sent out to randomly selected participants (Hey are you a dr.?); then from that answer you ask a second more detailed sample (Here's a survey about healthcare)
What variables are based on how data are measured?
Qualitative and quantitative
What variables are based on study design?
Dependent and independent
What are qualitative (categorical) variables?
groups, cohorts; Categorical data has a frequency. 50 ppl and 10 failed (20%). 20% is a frequency which is a categorical variable.
What are nominal categorical variables?
Multiple categories with no difference in quality. Ex. ethnicity, hair color, eye color. Different answers, but blue eyes is no better than green eyes
What are dichotomous (binary) categorical variables?
Only two labels for variable. Ex. gender, disease status, smoker/nonsmoker
What are ordinal categorical variables?
Ranked variables. Ex. age group, stage of cancer, pain rating
What are quantitative (continuous) variables?
Measured quantities
What are interval quantitative variables?
Any quantitative value. Ex. height, weight, temp
What are ratio quantitative variables?
Has meaning (ex. blood pressure) or meaningful zero (temperature)
What are independent variables?
Input, manipulated
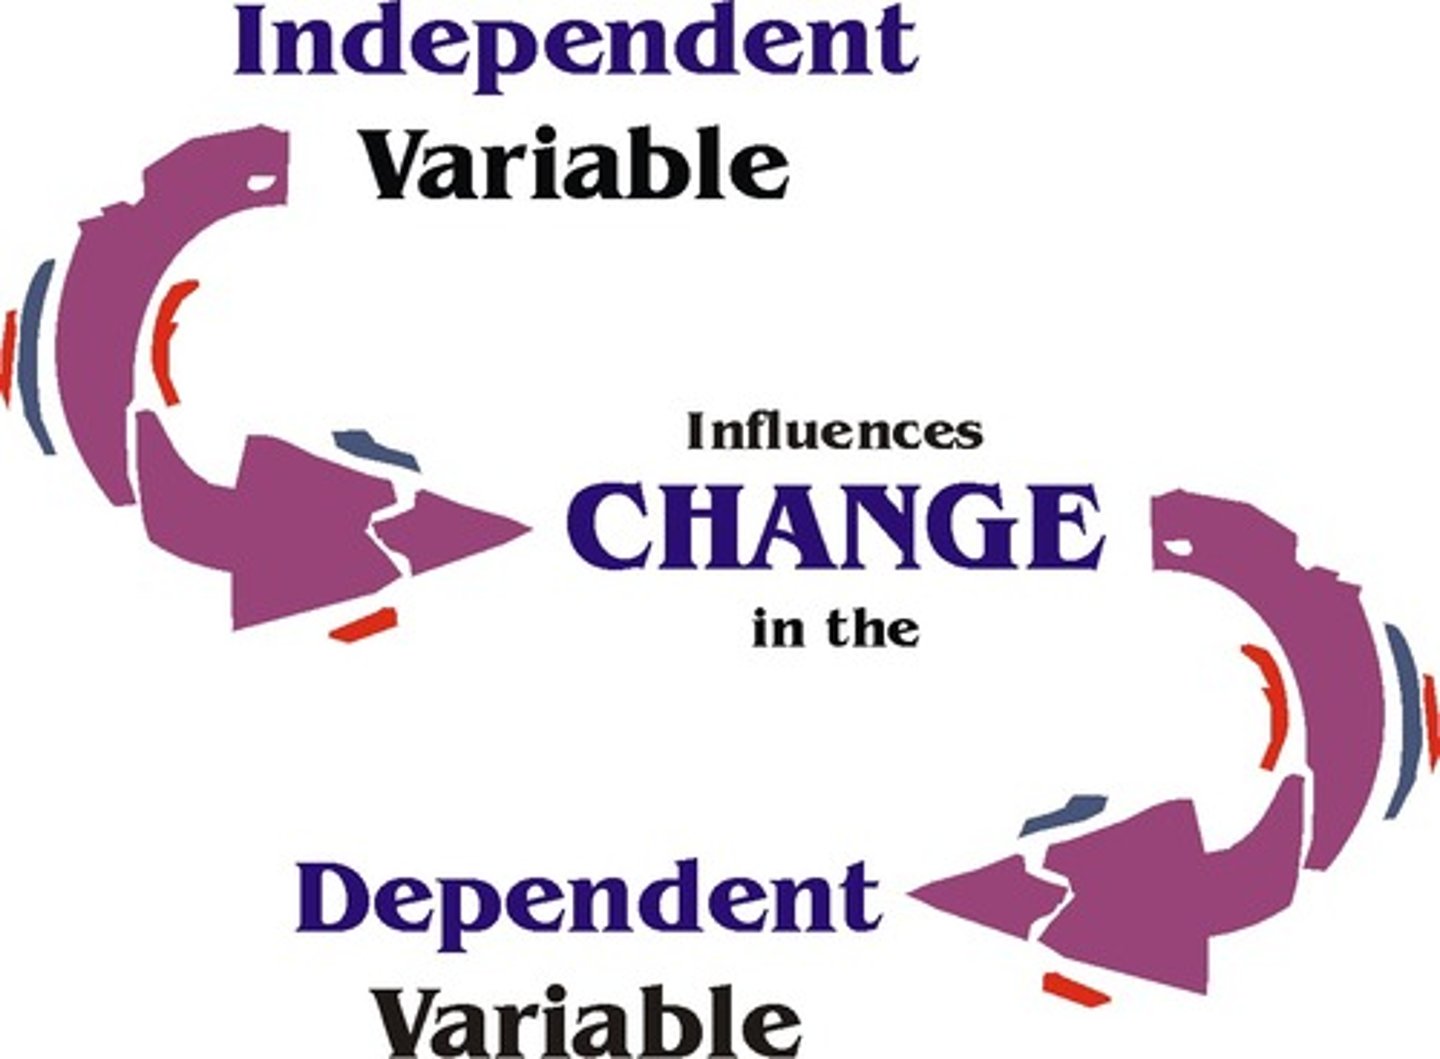
What are dependent variables?
Outcome, response, predicted
What is sample size?
number of samples in each group
What kind of sample size has more statistical power?
Larger sample sizes (but this doesn't mean that small n is powerless)
What type of experiments are forced to have a small n?
Rare diseases, expensive experimental designs
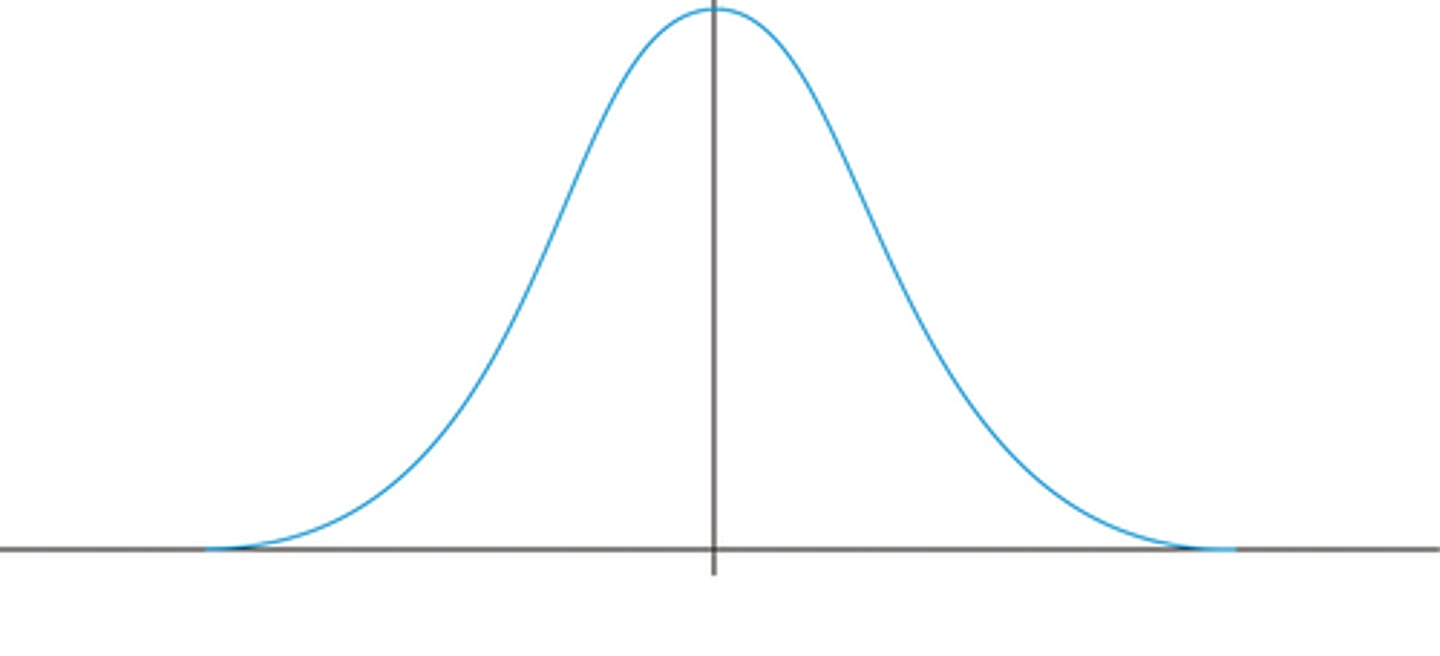
What does it mean if mean and median are equal or approximately equal?
Normal distribution
What does it mean if mean and median aren't equal?
Skewed data set
What is variance?
Spread of data; if there is 0 variance, the values are identical and you can't run statistics
What are the measures of central tendency?
mean, median, mode
What is range?
Highest minus lowest value
What is interquartile range?
75th percentile - 25th percentile
What is standard deviation?
the square root of the variance; standard deviation is NOT dependent on sample size
What is standard error of the mean?
the standard deviation of a sampling distribution; IS dependent on sample size
How do you calculate standard error of the mean?
standard deviation / square root of sample size
What is a unimodal distribution?
when 1 score occurs in greatest frequency (has 1 peak)
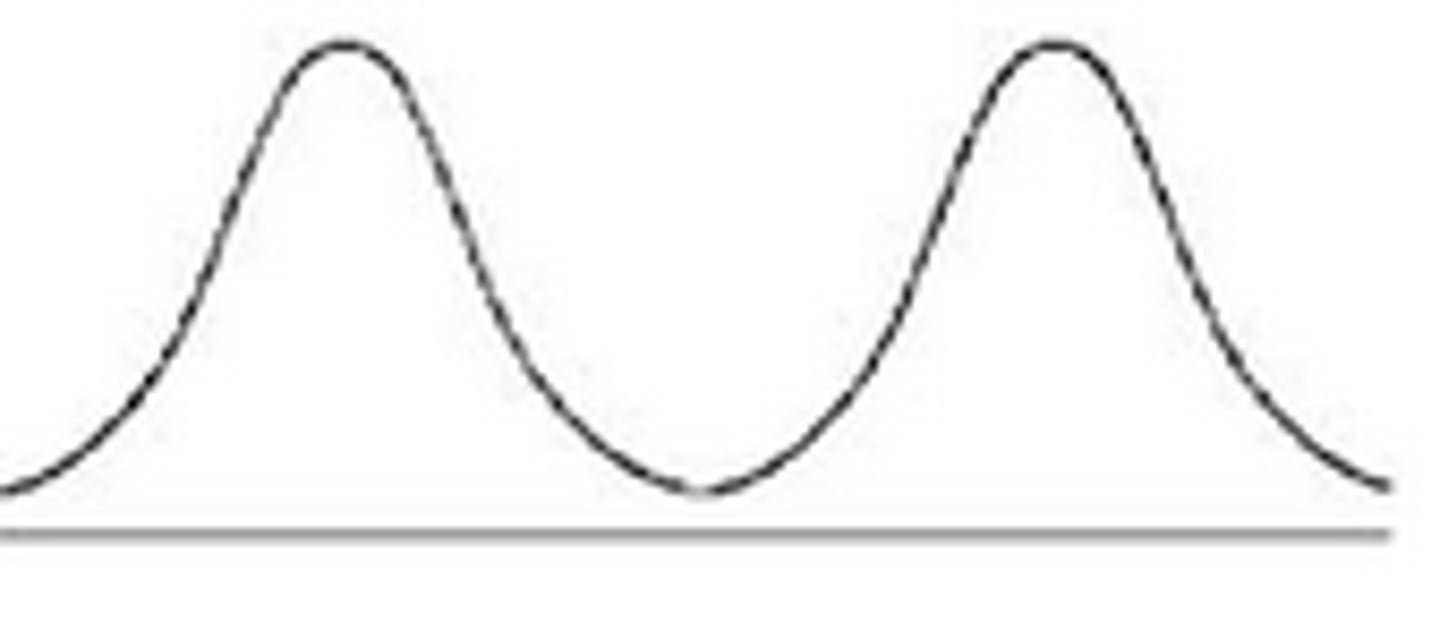
What is a bimodal distribution?
when 2 scores both occur with the greatest frequency
What is a left-skewed distribution?
aka negative skew, the tail points to the left so most values on right

What is a right-skewed distribution?
aka positive skew, the tail points to the right so most values on left

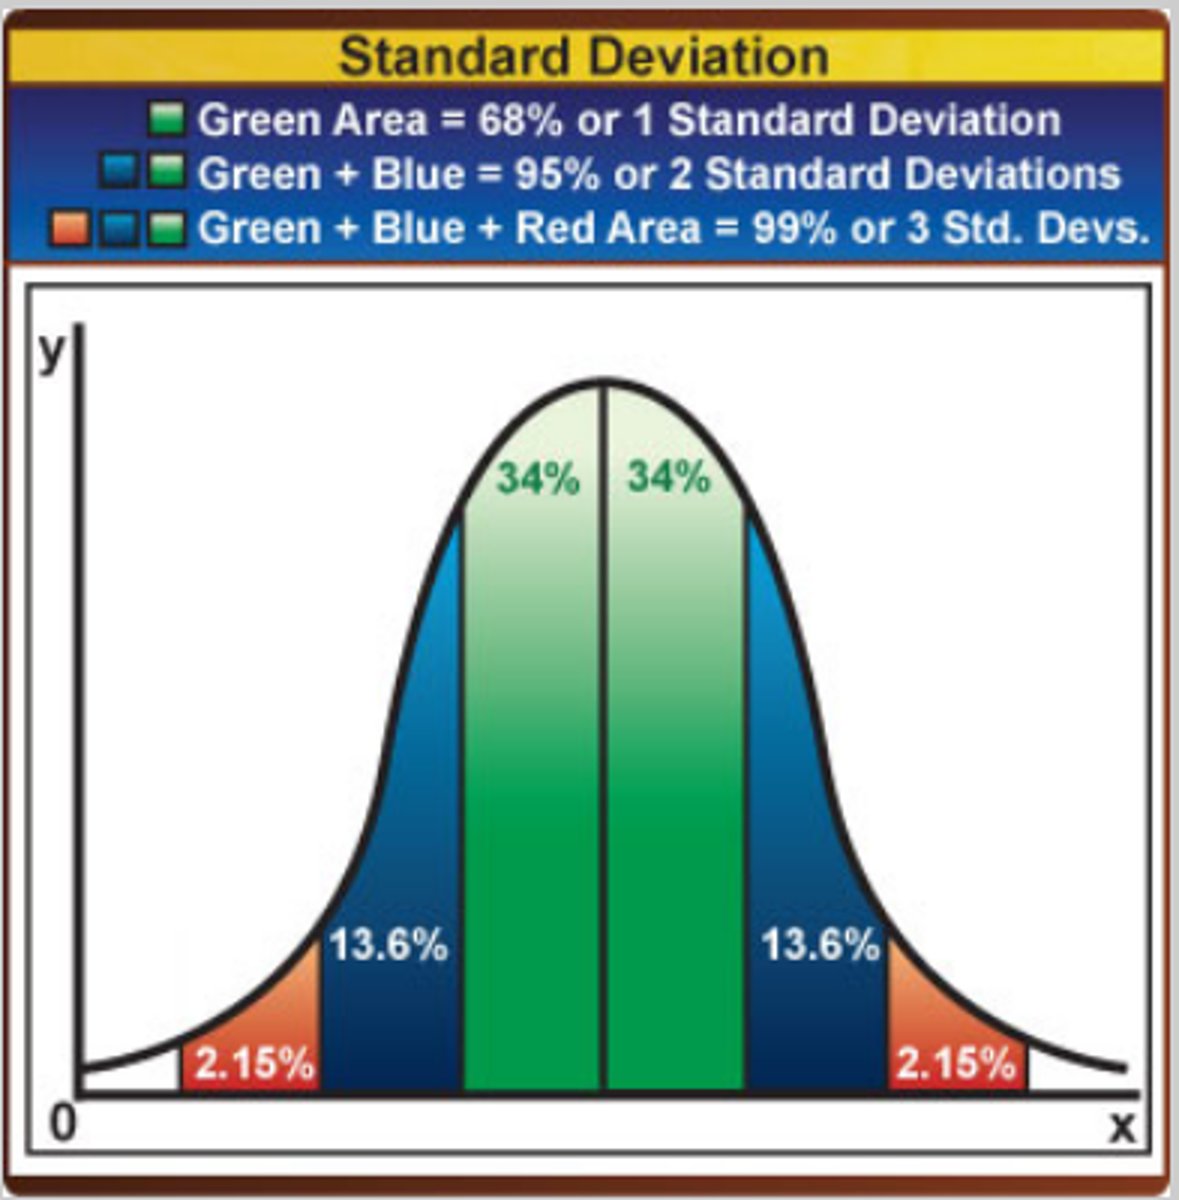
If a statistic includes 95% of the data, how many standard deviations are included? What does it mean?
4 - +2 above the mean, -2 below the mean; NORMAL POP DISTRIBUTION
Know how to find standard deviation by looking at a bell curve
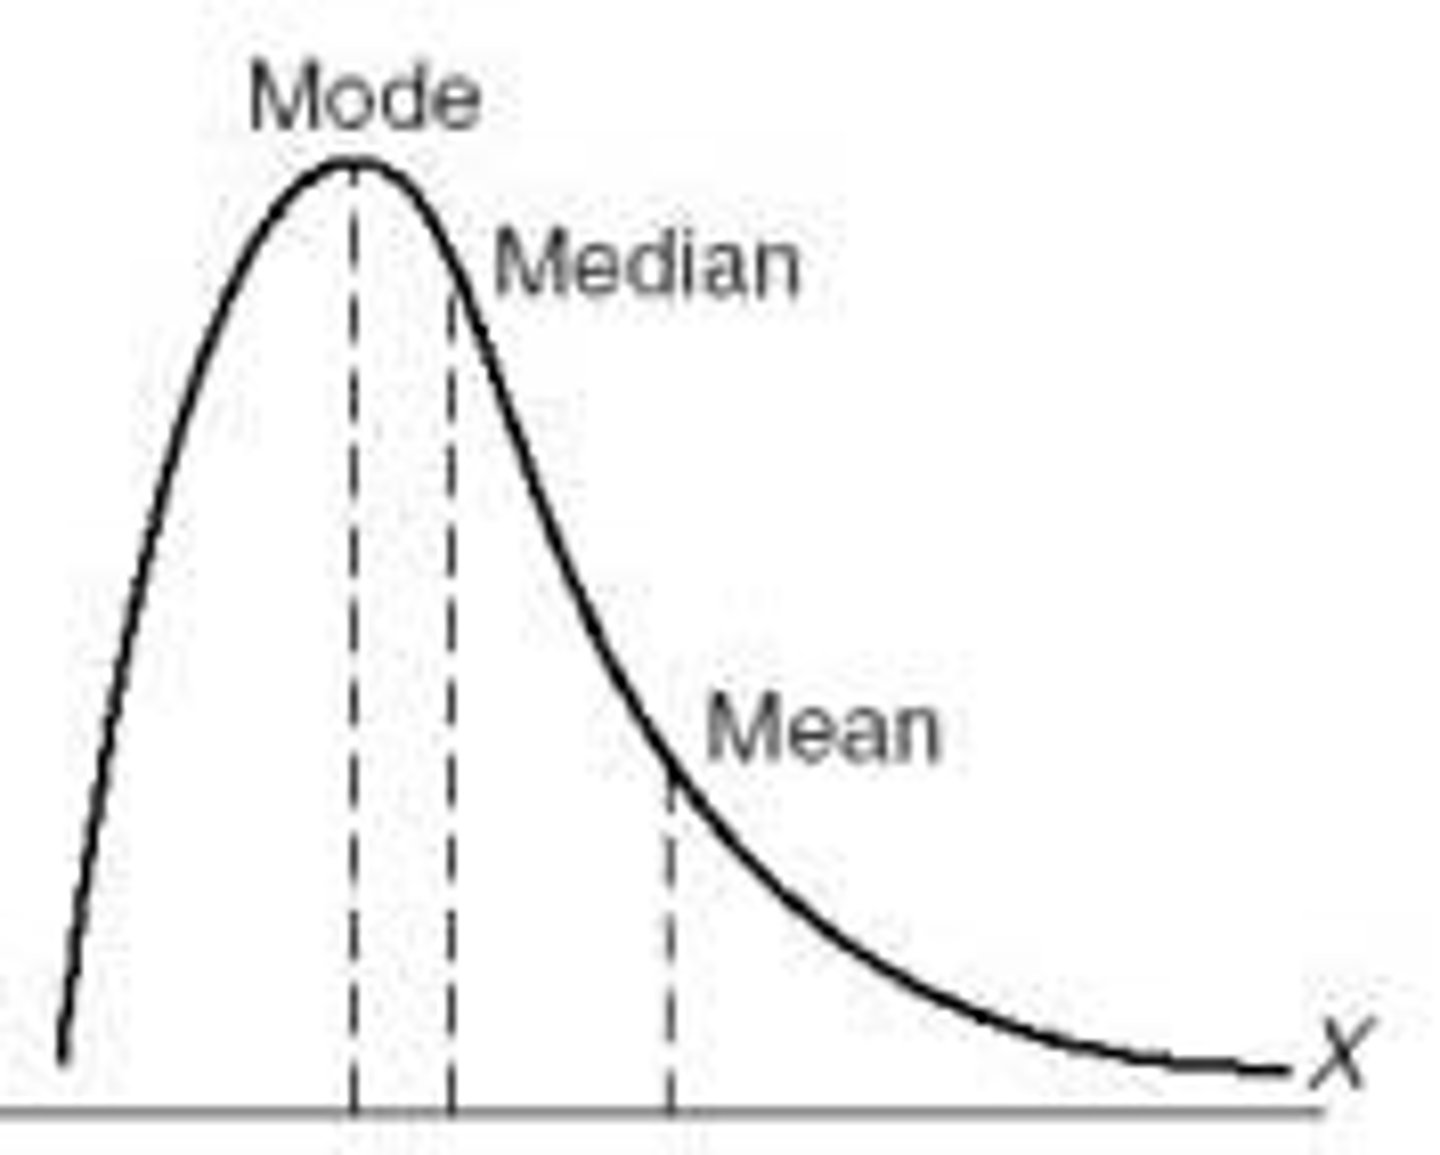
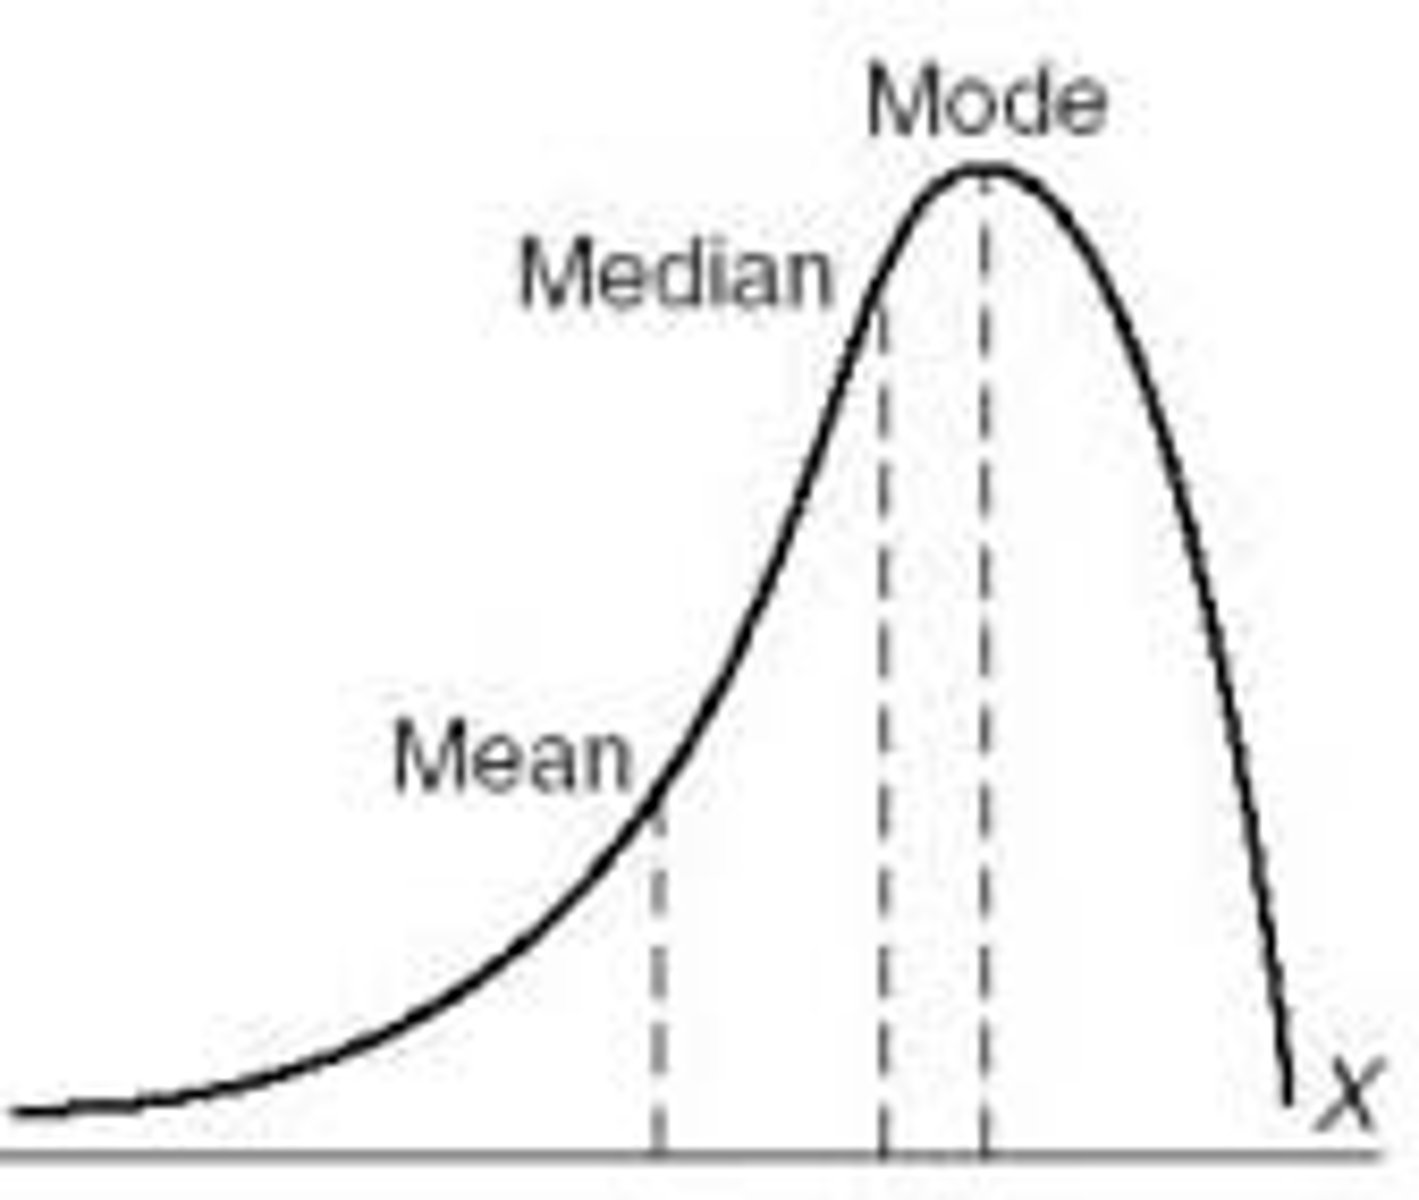
What does it mean if a curve has a positive skew?
Tail is right, more values on left. The mean is being pulled in a positive direction
What does it mean if a curve has a negative skew?
Tail is left, more values on right. The mean is being pulled in a negative direction
What happens to the mean, median, mode in a positive skew? (KNOW THIS)
Mode < Median < Mean
What happens to the mean, median, mode in a negative skew? (KNOW THIS)
Mean < Median < Mode
What is a Type I error?
Probability of rejecting H0 when it is true
How do we calculate Type I error?
Same as significance level (your chosen alpha); telling someone they have HIV when they really don't
If alpha is .2, what is the chance of Type I error?
20% chance
What is worse, Type I or Type II error?
Type II - it's like telling someone they don't have HIV when they do, someone could die
What is Type II error?
Probability of accepting H0 when it is false. Telling someone they don't have HIV when they really do
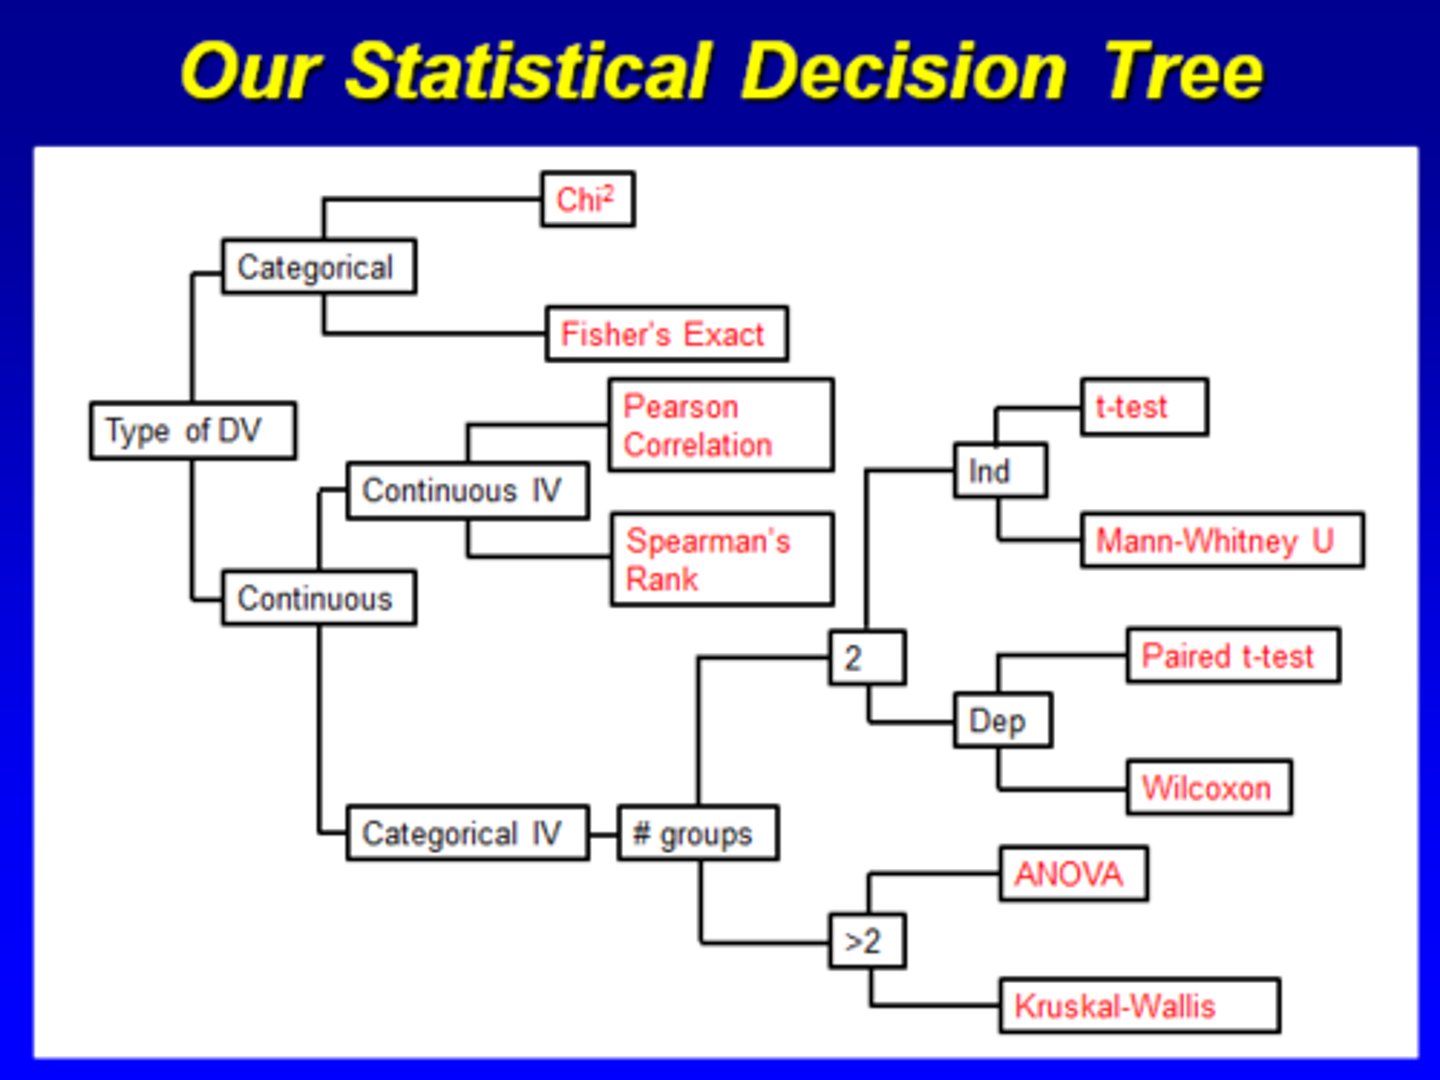
Be able to draw the statistical decision tree
When do we use a contingency table?
To analyze frequency distributions (proportions!)
When both variables are categorical what test do you use?
Chi Squared
When both variables are categorical, but you have a cell less than 5, what test do you use?
Fisher's Exact
What does C2 test for?
Goodness of fit and independence
What does it mean if your categorical IV is dependent?
You're your own control. Usually associated with before/after studies. You're comparing a change in yourself over time
What test would you use if your dependent variable is continuous, your independent variable is independent?
T-Test
For 2 groups, assumes data is normally distributed, variances equal
What test would you use if your dependent variable is continuous, your independent variable is dependent?
Paired T-Test
For matched samples, comparing change in individuals over time
What test would you use if your dependent variable is continuous, but you have more than 2 groups?
ANOVA (Analysis of Variance)
Same assumptions as T-test, but it's for more than 2 groups
What test would you use if your dependent variable is continuous, you have more than 2 groups, but your data isn't normally distributed?
Kruskal-Wallis test
Compares medians for more than 2 groups; nonparametric tests compare median of groups
What test would you use if your dependent variable is continuous, your independent variable is dependent, and your data isn't normally distributed?
Wilcoxon Rank Sum test
No assumptions about underlying distribution of data. Compares paired data; nonparametric tests compare median of groups
What test would you use if your dependent variable is continuous, your independent variable is independent, and your data isn't normally distributed?
Mann-Whitney U Test
Compares medians of 2 groups; nonparametric tests compare median of groups
When would you use a correlation?
When both the dependent and independent variable are continuous
What do correlations establish?
predictions
Does correlation imply causation?
NO
What test would you use if you have a continuous dependent variable and continuous independent variable?
Pearson Correlation
What test would you use if you have a continuous dependent variable and continuous independent variable, and skewed data?
Spearman's Rank
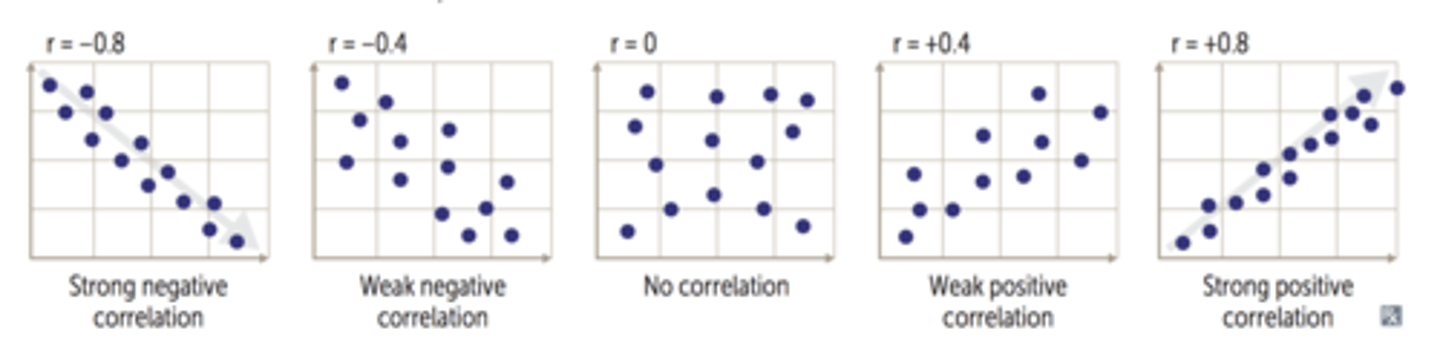
How do you measure degrees of correlation?
measured by r
Pearson Correlation Coefficient measures linear relationship between two variables (+1/-1/0)
How is Spearman's rank measured?
Rho
Measures extent to which, as one variable increases, other variable tends to increase. Does not require linear relationship
What is a regression analysis?
Measures impact of one variable on other. R2 = amount of variation in dependent variable explained by independent variable
What are the different values for correlation coefficient?
-1 to +1, 0 is no correlation
How do you draw a contingency table?
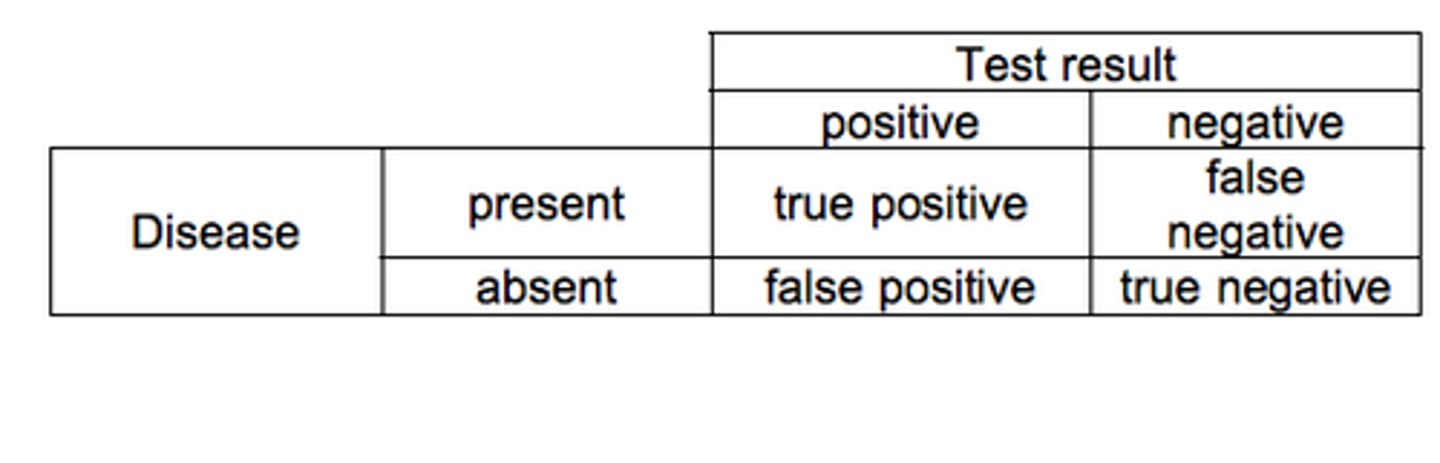
What is sensitivity?
Proportion of patients with disease where screening test is positive
How do you calculate sensitivity?
= TP/ (TP+FN)
What does a high sensitivity mean?
Higher sensitivity, better test in finding diseased patients
Where on a contingency table do you look to calculate sensitivity and specificity?
COLUMNS
Sensitivity - LEFT COLUMN
Specificity - RIGHT COLUMN
What is specificity?
Proportion of patients without disease where screening test is negative
How do you calculate specificity?
= TN/ (FP + TN)
What does it mean if you have high specificity?
Healthy patients are not diagnosed as diseased
What is positive predictive value?
Proportion of positive test results where patients are diseased
How do you calculate PPV?
PPV = TP / (TP + FP)
What is negative predictive value?
Proportion of negative test results where patients are not diseased
How do you calculate NPV?
NPV = TN / (FN + TN)
What do you use on a contingency table to calculate PPV and NPV?
ROWS
PPV - top row
NPV - bottom row