FBLA - Data Science & AI
1/98
There's no tags or description
Looks like no tags are added yet.
Name | Mastery | Learn | Test | Matching | Spaced | Call with Kai |
|---|
No study sessions yet.
99 Terms
Data Science
The field that uses data, stats, and computation to extract insights and support decisions.
Data Conversion
Changing data from one numerical system or format to another (binary ↔ decimal ↔ hex)
Dependence Methods
Statistical techniques showing how variables rely/depend
on each other.
Interdependence Methods
Techniques examining relationships without a dependent variable. (Inter = Without)
Machine Learning Algorithm
A procedure computers use to learn patterns from data.
Learning Function
The rule a machine learning model uses to update itself based on errors.
Training Dataset
Data used to teach a model
Validation Dataset
Data used to fine-tune a model during training.
Test Dataset
Data used to measure final model performance.
Deep Learning
Machine learning using layered neural networks to learn complex patterns.
Structured Data
Data organized in rows and columns (like spreadsheets and SQL tables).
Unstructured Data
Data without a fixed format, such as text, images, audio, or video.
Numeric Data
Data measured or counted using numbers.
Categorical Data
Data grouped by labels or categories.
Binary System
Base-2 number system using 0 and 1.
Decimal System
Base-10 number system using digits 0-9.
Hexadecimal System
Base-16 system using 0-9 and A-F, often used in computing.
Data Sources
Places where data originates/comes from (the source)
(ex. sensors, surveys, transactions, social media).
Data Wrangling
Cleaning and organizing raw data so it can be analyzed. (Wrangling = cleaning/organizing)
Data Transformation
Converting/transforming data into a more useful or usable structure.
Data Science Process
Ask questions → collect → clean → analyze → model → interpret → communicate.
defining the problem, collecting and cleaning data, exploring and analyzing it to find patterns, modeling and evaluating solutions, and finally communicating the results
Probability
The chance an event happens; found by favorable outcomes ÷ total outcomes.
Sample Space
All possible outcomes in a scenario.
Random Variable
A variable whose value depends on random events.
Mean
Average of a dataset; add values and divide by number of values.
Median
Middle value when data is sorted; if even count, average the two middle numbers.
Mode
Value that appears most frequently.
Range
Largest value minus smallest value.
Variance
Measures spread of data from the mean; standard deviation squared.
Standard Deviation
Shows how spread out data is from the mean; square root of variance.
Expected Value
Long-term average outcome of a random variable.
Correlation
How strongly two variables move together (positive, negative, or none).
Regression
Predicting outcomes using relationships in data (line of best fit).
Outlier
Data point far from others that can distort results.
Gaussian (Normal) Distribution
Bell-shaped curve where values cluster around the mean.
Covariance
Shows whether two variables increase or decrease together.
Discrete Variable
A variable with countable values (like # of students).
Continuous Variable
A variable with infinite possible values within a range (height, time).
Data Visualization
Displaying data visually to reveal trends or patterns.
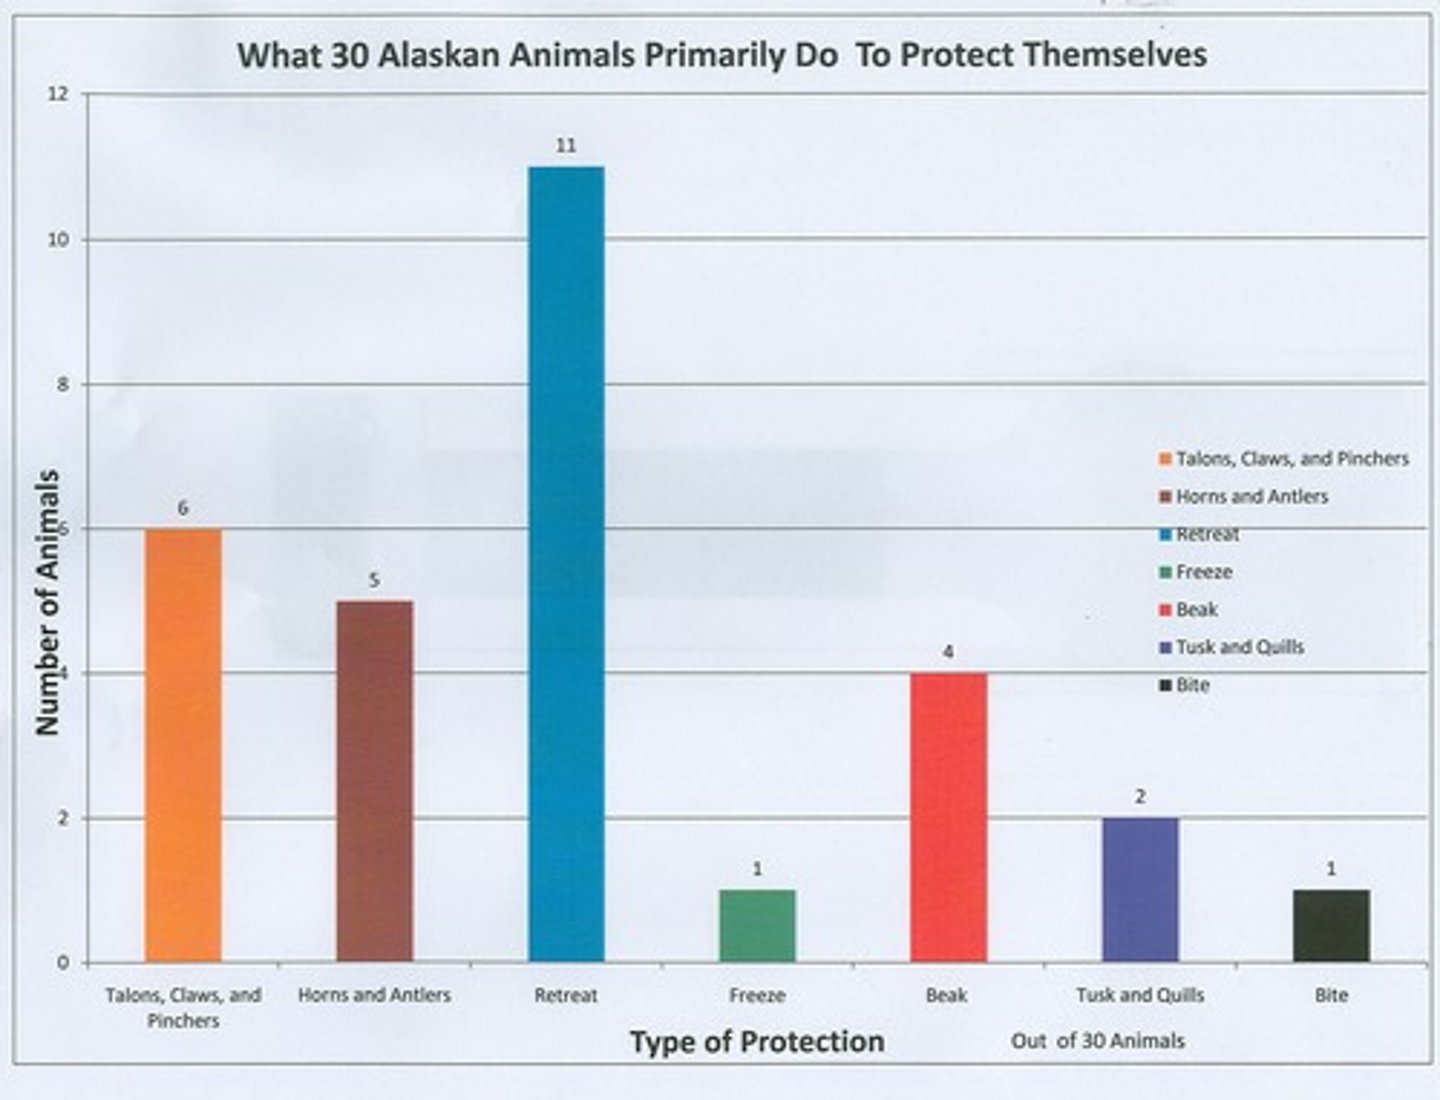
Bar Graph
Used to compare categories.
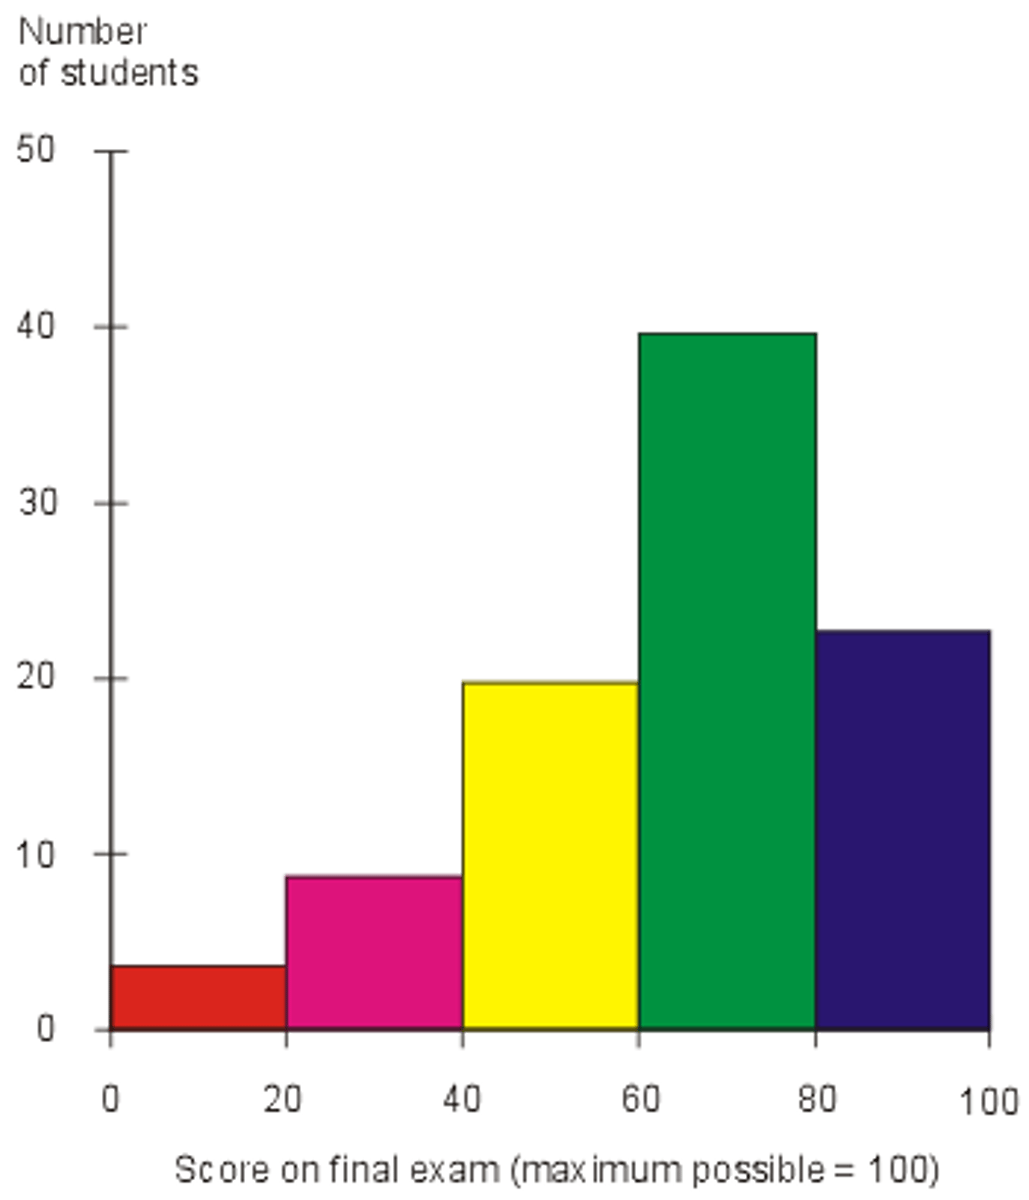
Histogram
Shows distribution of numerical data.
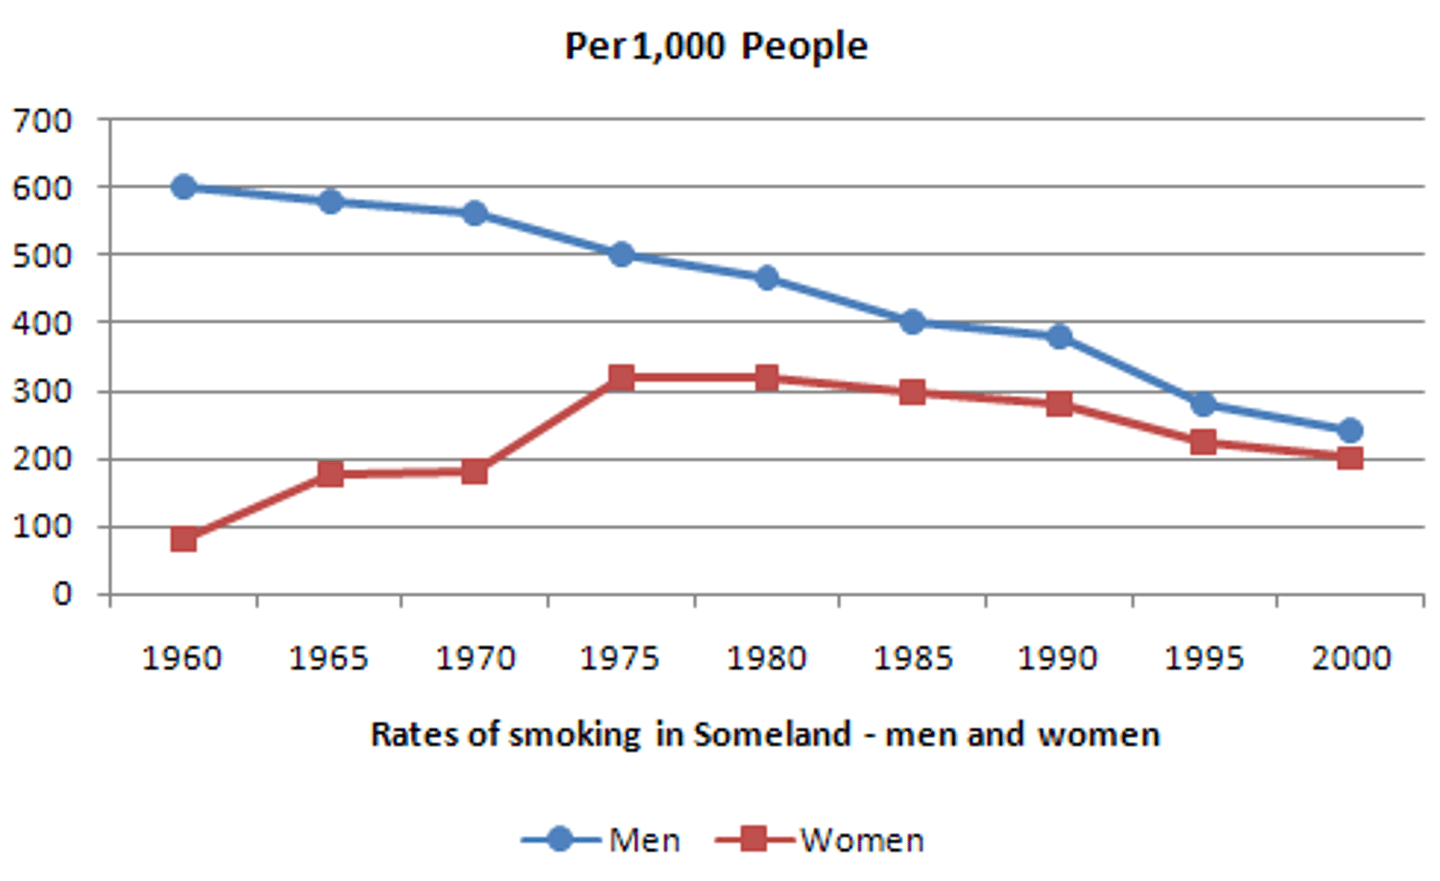
Line Graph
Tracks trends or changes over time.
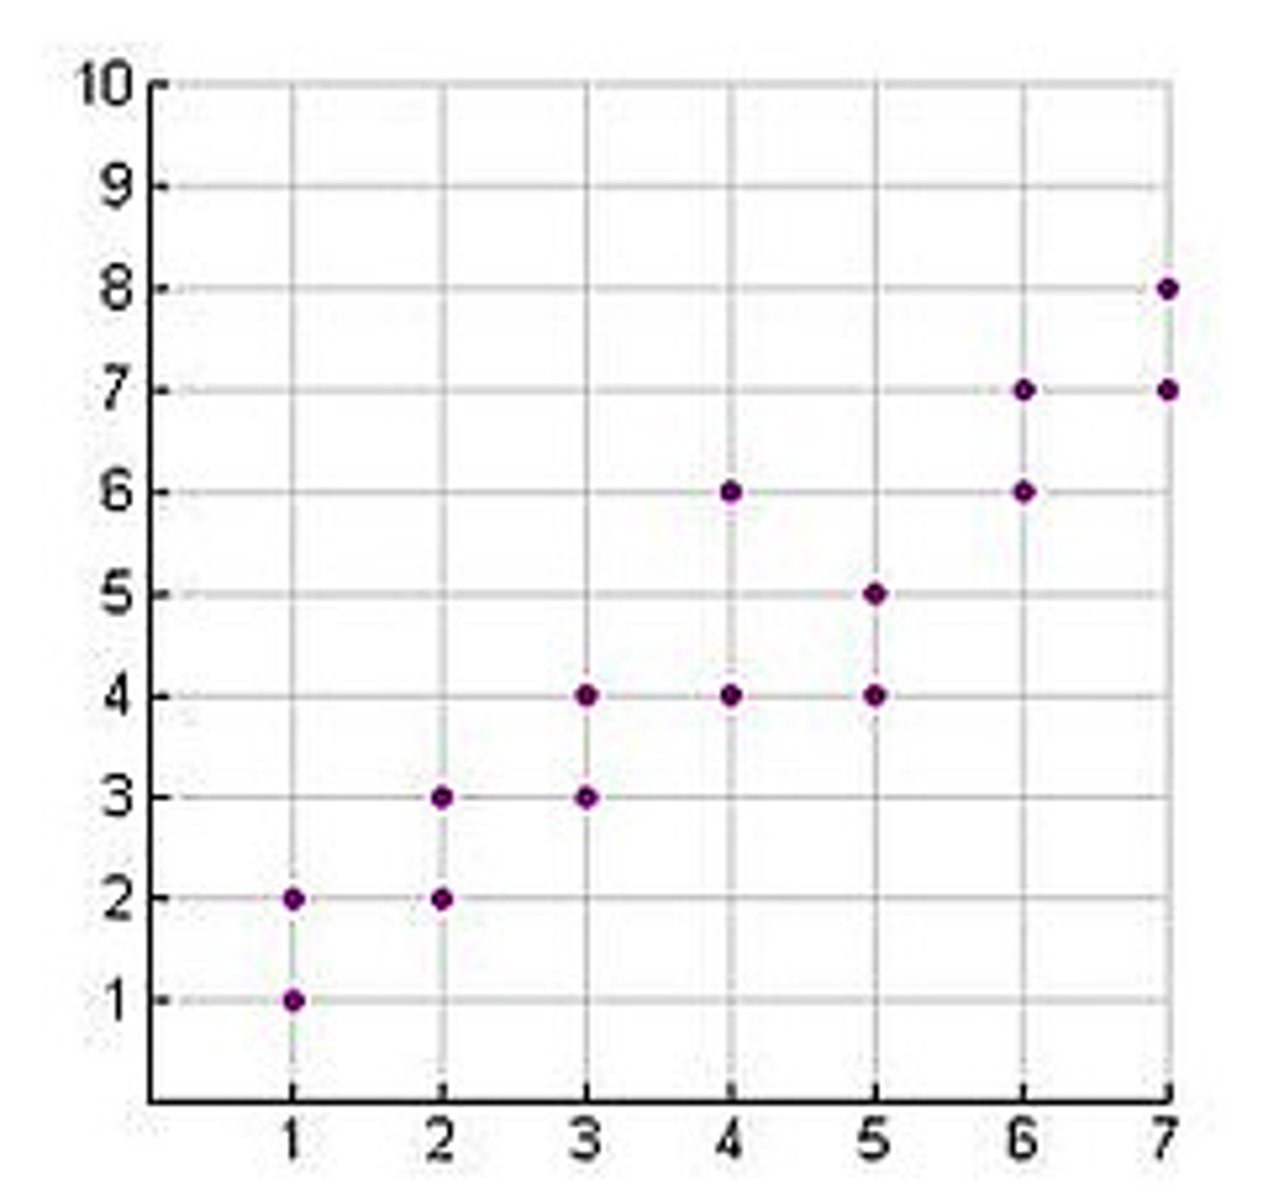
Scatter Plot
Shows relationships or correlations between two numeric variables.
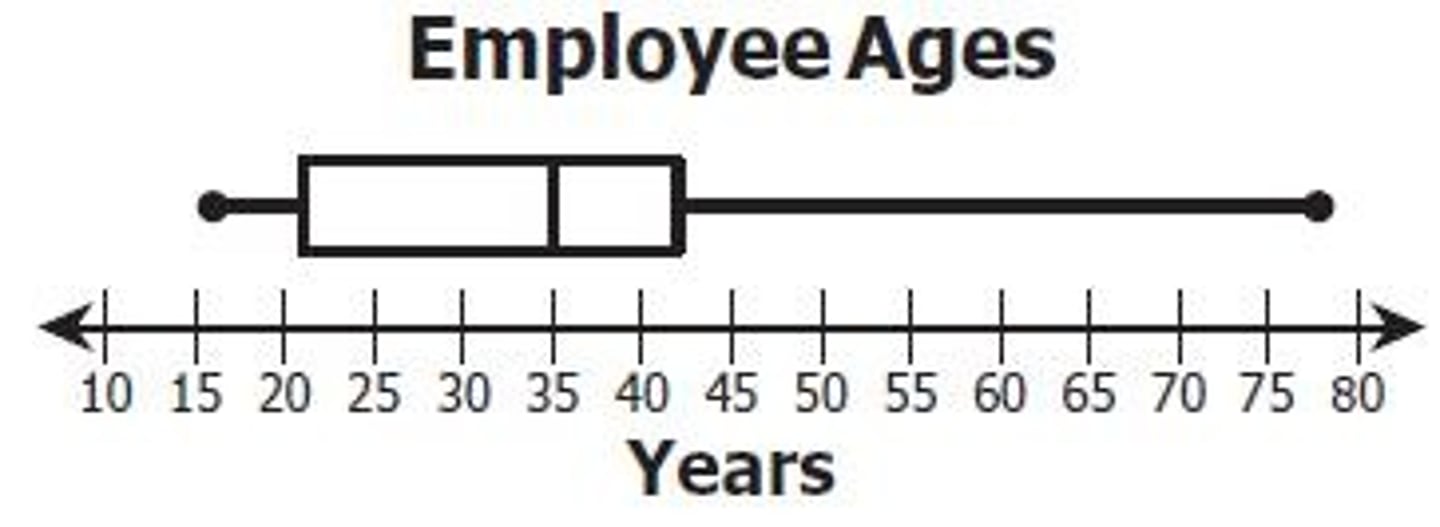
Box Plot
Shows spread, quartiles, and outliers in large datasets.
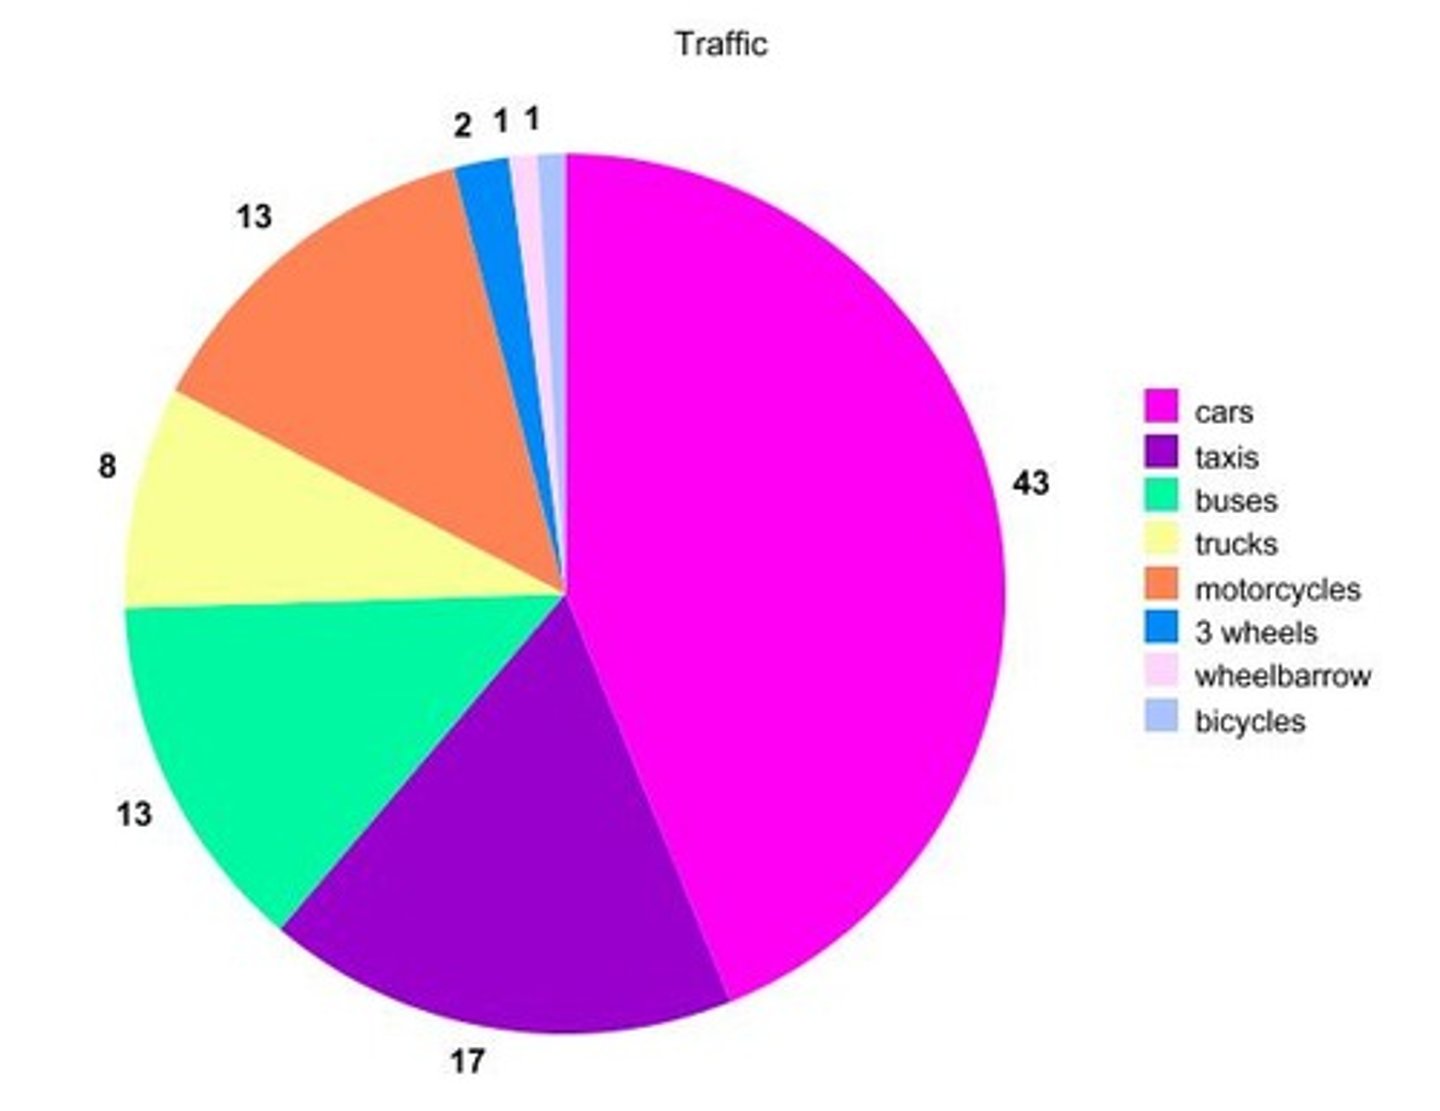
Pie Chart
Shows parts of a whole as percentages.
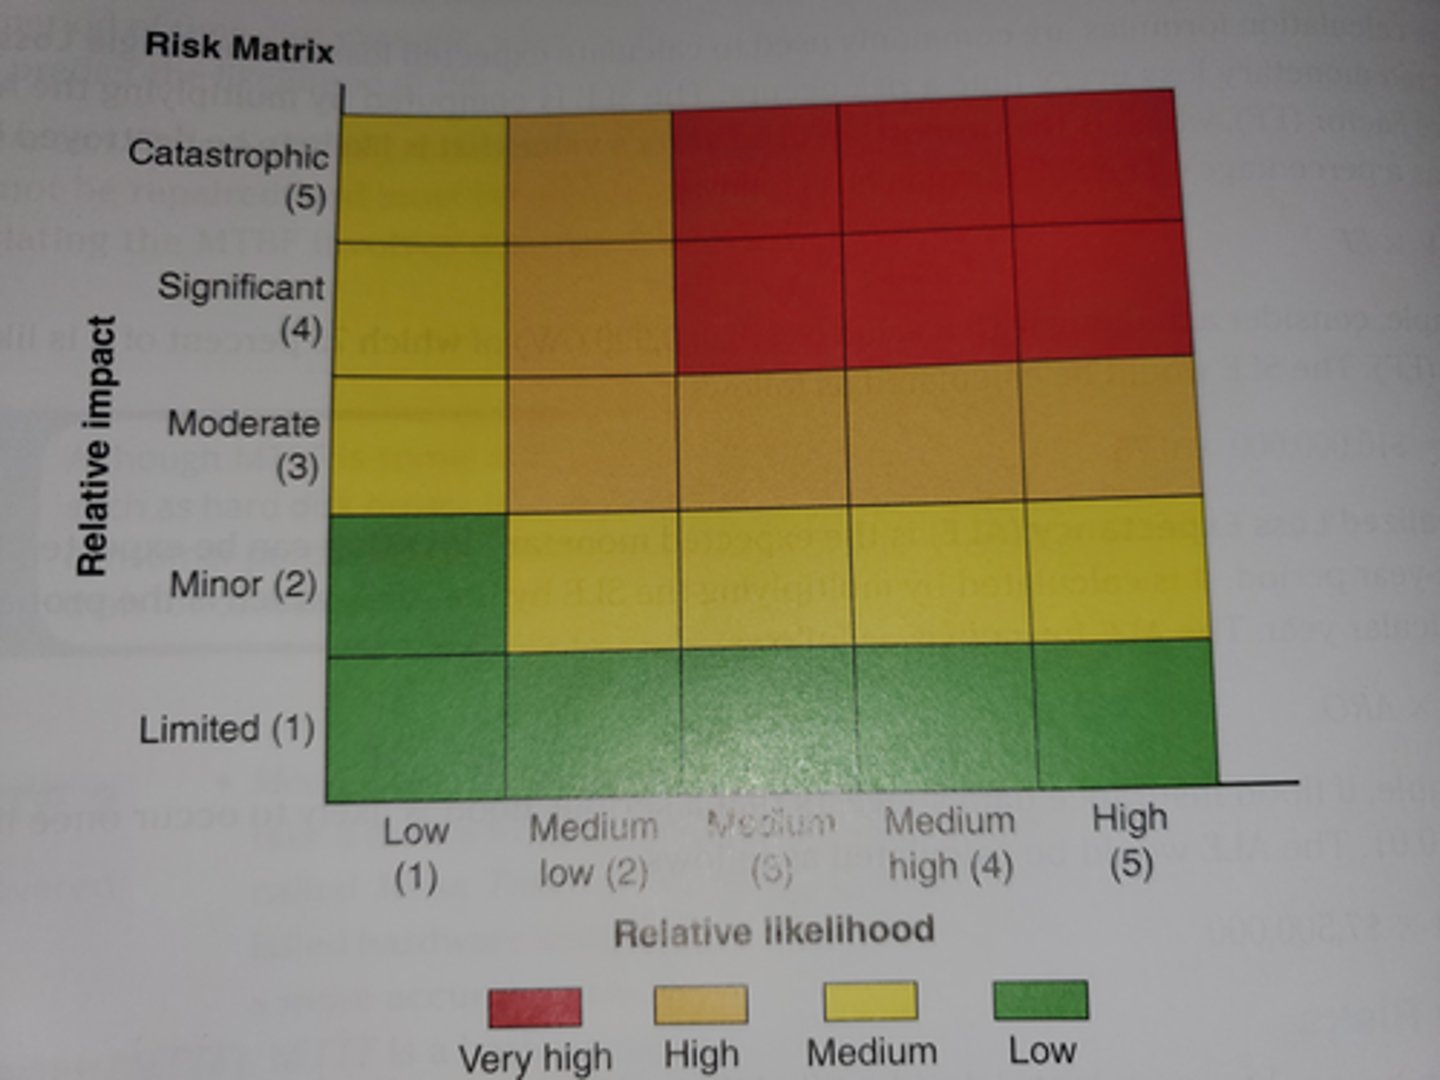
Heatmap
Shows intensity or correlations using color patterns.
Multivariate Data
Data involving more than two variables.
Linear Regression
Predicts a numeric value using a best-fit line.
Multiple Linear Regression
Predicts outcomes using several variables.
Logistic Regression
Predicts categories (yes/no, pass/fail).
(logical statement, like true/false)
Data Cleaning
Fixing errors, removing duplicates, and handling missing values.
Data Quality Issues
Problems like incomplete data, errors, duplicates, or noise.
K-Means
Clustering algorithm that groups data by similarity.
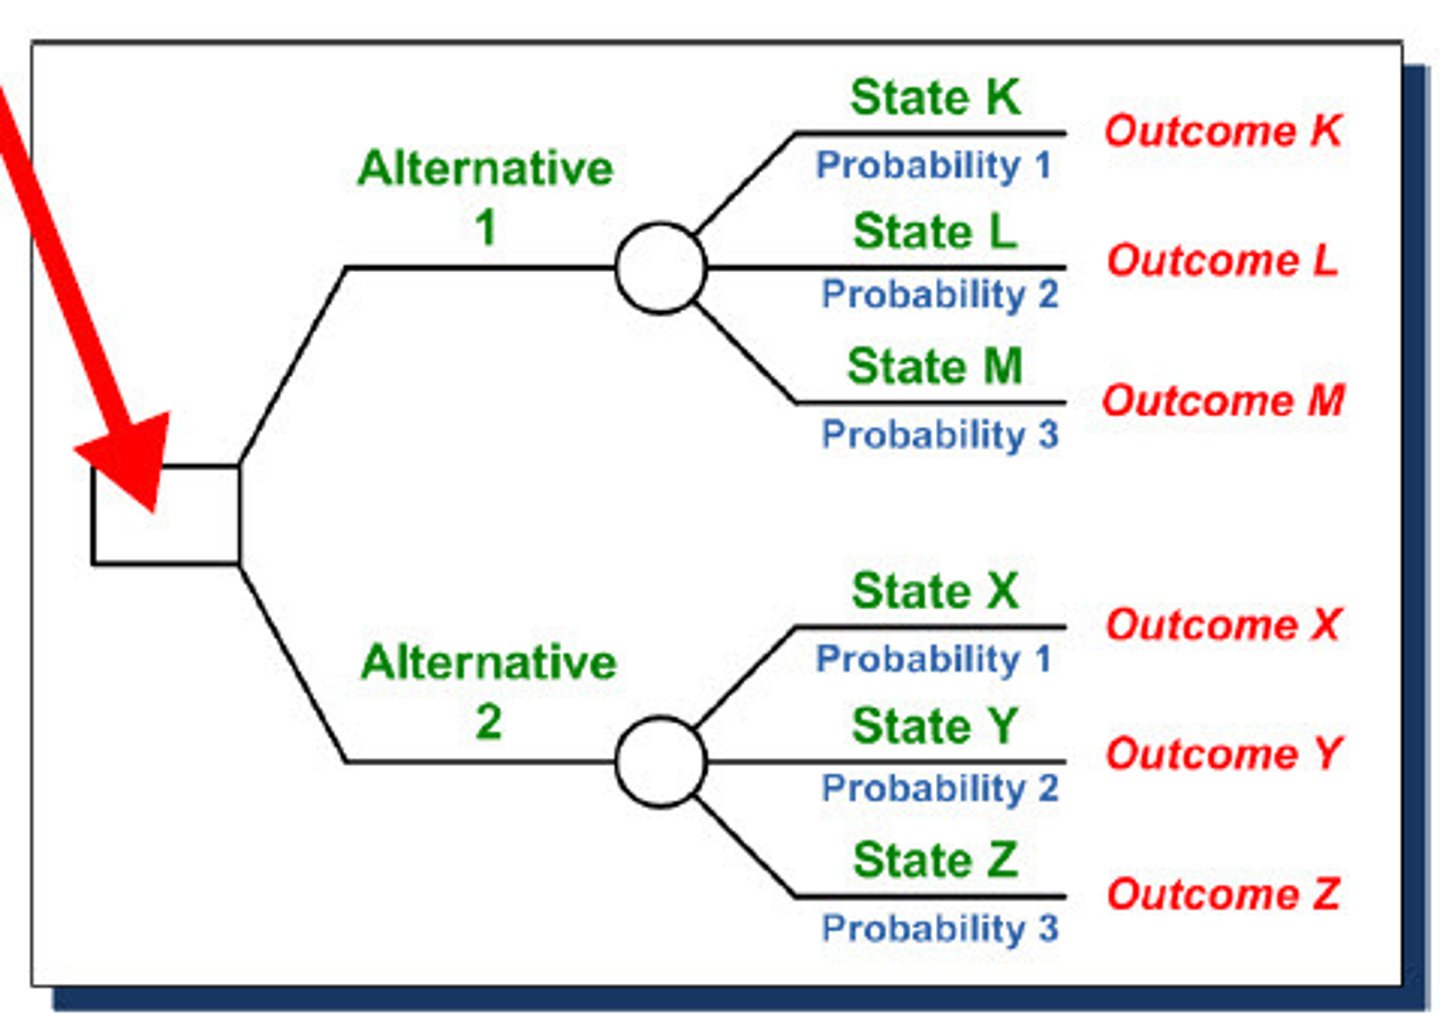
Decision Tree
Model that predicts outcomes by splitting data into branches.
Python
Main programming language for AI and data science due to simplicity and powerful libraries.
NumPy
Library for fast math and array operations.
Pandas
Library for cleaning, analyzing, and organizing data in dataframes.
Matplotlib
Library for visualizing data with graphs.
(mat = math = data) (plot = graph)
Seaborn
Python visualization library built on top of Matplotlib for cleaner graphs.
TensorFlow
Framework for building and training neural networks.
PyTorch
Deep learning framework popular for research and model development.
SQL
Language for storing, querying, and managing data in databases.
Jupyter Notebook
Environment to write code, visualize results, and explain analysis.
Relational Database
Database using tables linked by relationships (keys).
Google Cloud
Platform for running AI models, storing data, and deploying applications.
IBM Cloud
Cloud platform offering AI tools, storage, and data processing services.
R
Programming language used for statistics and data visualization.
Artificial Intelligence
Systems that mimic human intelligence to perform tasks like decision-making and pattern recognition.
Generative AI
AI that creates content such as text, images, and code.
Limitations of Generative AI
Can hallucinate, make false claims, and repeat bias.
Uses of Generative AI
Chatbots, creative tools, support in healthcare, summarization, coding help.
Computer Vision
AI that interprets visual data from images or videos.
Natural Language Processing (NLP)
AI that understands and generates human language.
Speech Recognition
Converts spoken words into text.
Robotics
AI used in machines that interact with the physical world.

Large Language Models (LLMs)
Neural networks trained on massive text datasets for reasoning and generating responses.
(Ex. Chatgpt)
LLM Capabilities
Summarization, question answering, reasoning, code generation.
Perception
AI converting raw data (images, audio, text) into useful information.
Knowledge Representation
How AI stores facts and relationships internally.
Reasoning
AI using stored knowledge to make decisions and predictions.
Inference
AI reaching conclusions without being explicitly told.
Knowledge Graph
Web of connected facts showing relationships between things.
Symbolic Reasoning
Solving problems using rules and logic.
Predicate Logic
Logical statements used to express facts and relationships.
Bayesian Network
Graph showing probabilistic relationships between variables.
Directed Acyclic Graph (DAG)
Graph used in Bayesian networks that has no loops.
Data Privacy
Protecting personal data from misuse.

Data Security
Safeguarding data from unauthorized access or attacks.
Ethical AI
Designing AI that is fair, transparent, and does not harm people.
Algorithmic Bias
When AI produces unfair outcomes due to biased data.
Transparency
Explaining how an AI system makes decisions.

Accountability
Identifying who is responsible for AI outcomes.
Consent
Users must agree before their data is used.
AI Surveillance
AI systems that monitor people, raising privacy concerns.
Security Risks of LLMs
Data leaks, unauthorized training, privacy issues.
LLM Credibility Issues
Hallucinations, misinformation, false confidence.
AI Dilemmas
Ethical problems caused by AI decisions (e.g., self-driving choices).
Logic-Based Reasoning
Uses defined rules to reach conclusions.
Probability-Based Reasoning
Uses likelihood and uncertainty instead of strict rules.