Bus' Stats' - Quantitative Measurement Concepts
1/24
There's no tags or description
Looks like no tags are added yet.
Name | Mastery | Learn | Test | Matching | Spaced | Call with Kai |
|---|
No analytics yet
Send a link to your students to track their progress
25 Terms
Ordinal
Categorical Data w/ no inherent oder or ranking
Colors
Gender
Country
Blood Types
Nominal
Categorical Date WITH a natural, meaningful order or ranking
Education Level
Movie Ratings in Stars
Low/Middle/High
μ
meanpopulation
x̄
meansample
σ²
Variancepopulation
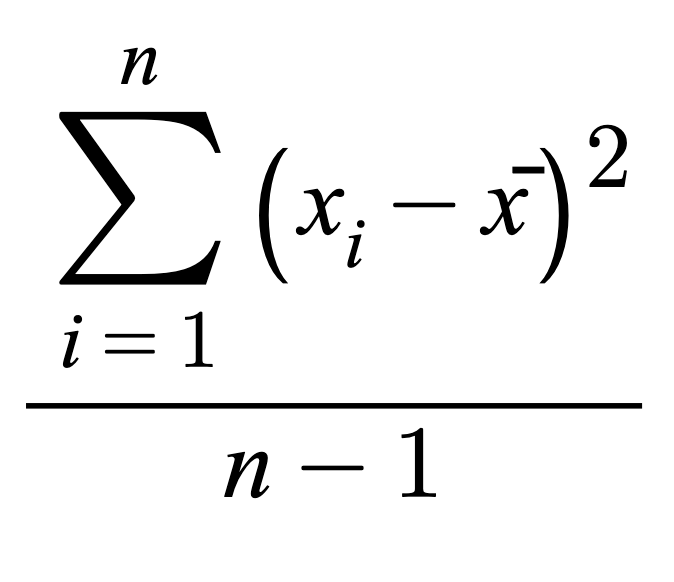
s2
Variancesample
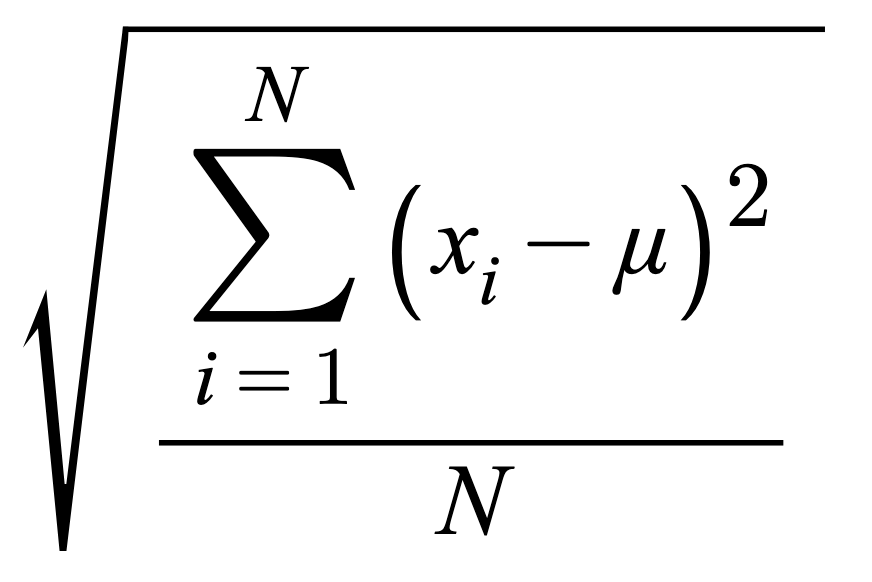
σ
Standard Deviation population
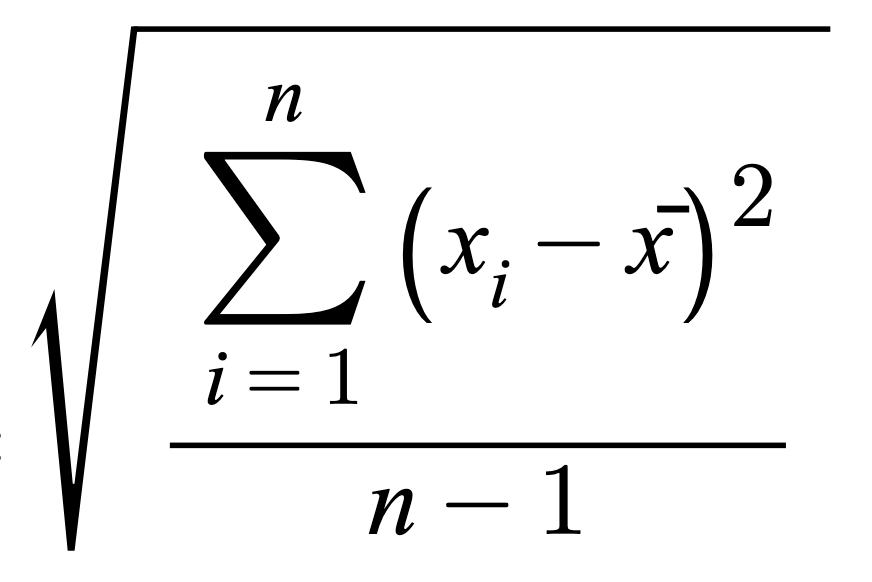
s
Standard Deviation sample
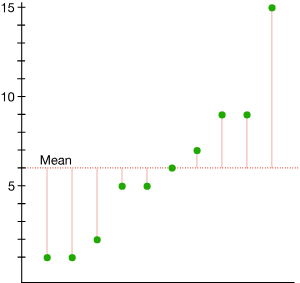
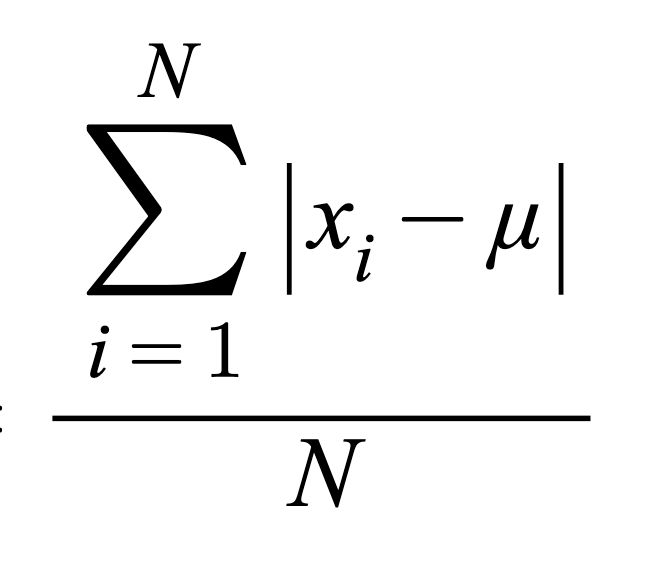
MAD (Def.)
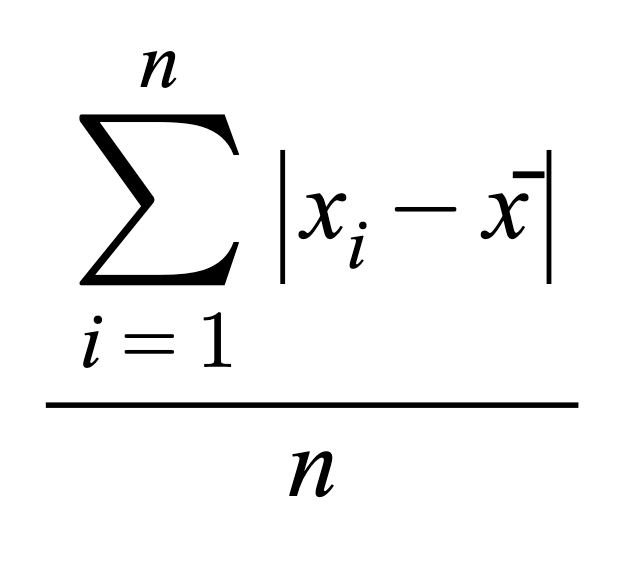
Mean Absolute Deviation: The average of the sum of all absolute differences between each data point and the overall dataset’s mean
MADpopulation
MADsample
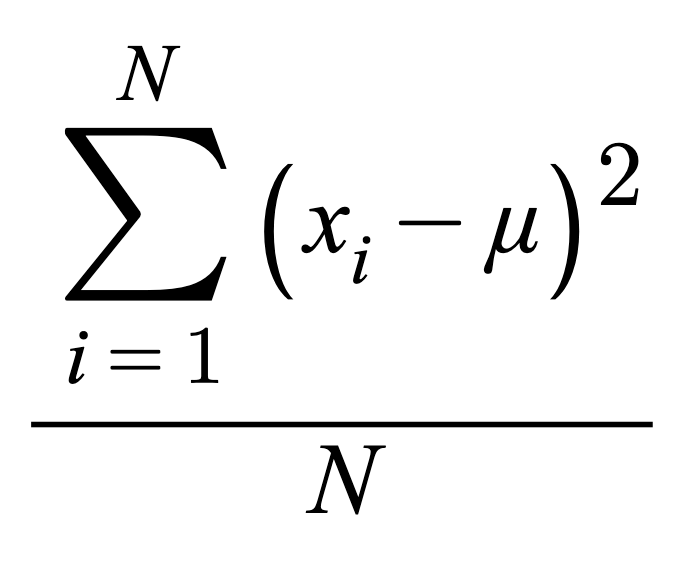
Variance (Def.)
A squared unit of measurement that is designed to be sensitive to outliers in datasets and used to measure volatility (usually risk) of a dataset through averaging the overall squared differences between each of the individual data points and the mean of the dataset. The less the value, the less the volatility; vice versa. The variance value (volatility) of one dataset is useful for comparing dispersion within that dataset or with other datasets ONLY when the other datasets share similar means and units. Variance values are the stepping stones to calculating the Standard Deviation of a dataset, which represents the ABSOLUTE volatility of a dataset, and is more tangible and intuitive for conceptualizing the volatility of real-life datasets.
Variancepopulation
Variancesample
[ σ ] Standard Deviation population
[ s ] Standard Deviation sample
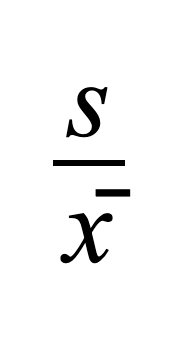
Coefficient of Variation (Def.)
A dimensionless/unitless measurement used to assess volatility relative to a dataset (risk per unit of return), which is utilized to compare volatilities between different datasets regardless of differences in means and units within those datasets.
Coefficient of Variation population

Coefficient of Variation sample
Interval Data
Numerical Data with Equal Intervals between values but NO ABSOLUTE ZERO POINT
Temperature
Calendar dates
Cannot multiply meaningfully
Ratio Data
Numerical Date w/ Equal Intervals AND a ABSOLUTE ZERO POINT (complete absence)
Height / Weight
Age
Income / Expenses
Distance / Time
Number of Items
Random Variables
A variable who’s value is determined by the outcome of a random phenomenon
Discrete RV
Finite set of distinct values / integers
Students in a class
Dice outcomes
1, 2, 3, 4, 5, …
Continuous RV
Any value within an interval or range of real numbers
Height
Temperature
Weight