Chapter 4: Cost-volume relationship, contribution margin, CMR, break-even point
1/15
There's no tags or description
Looks like no tags are added yet.
Name | Mastery | Learn | Test | Matching | Spaced | Call with Kai |
|---|
No analytics yet
Send a link to your students to track their progress
16 Terms
What are the 5 elements of the cost-volume profit relationship?
Prices of products
Volume/activity level
Per unit variable costs
Total fixed costs
Mix of products sold
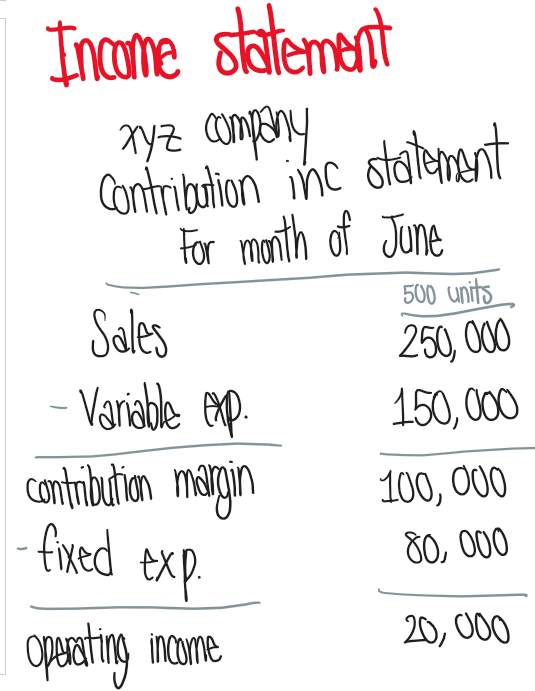
What are the basic components of an income statement?
Sales
- variable expenses
= contribution margin
- fixed expenses
= operating income
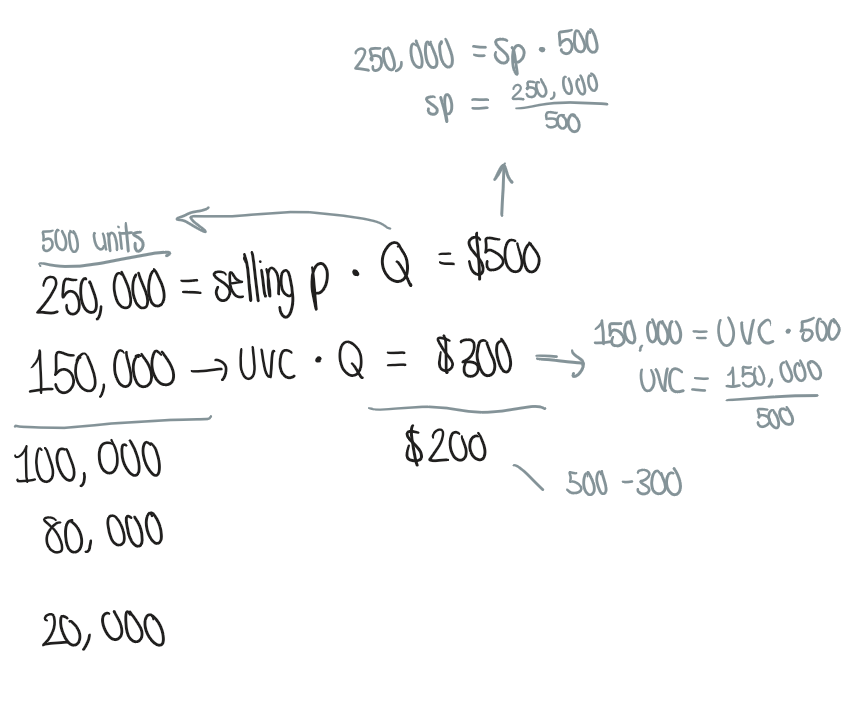
How do you find the per-unit prices of sales, variable expenses, and contribution margin?
Divide the sales & variable expenses by the units produced
subtract the variable expenses from sales to find the contribution margin per unit
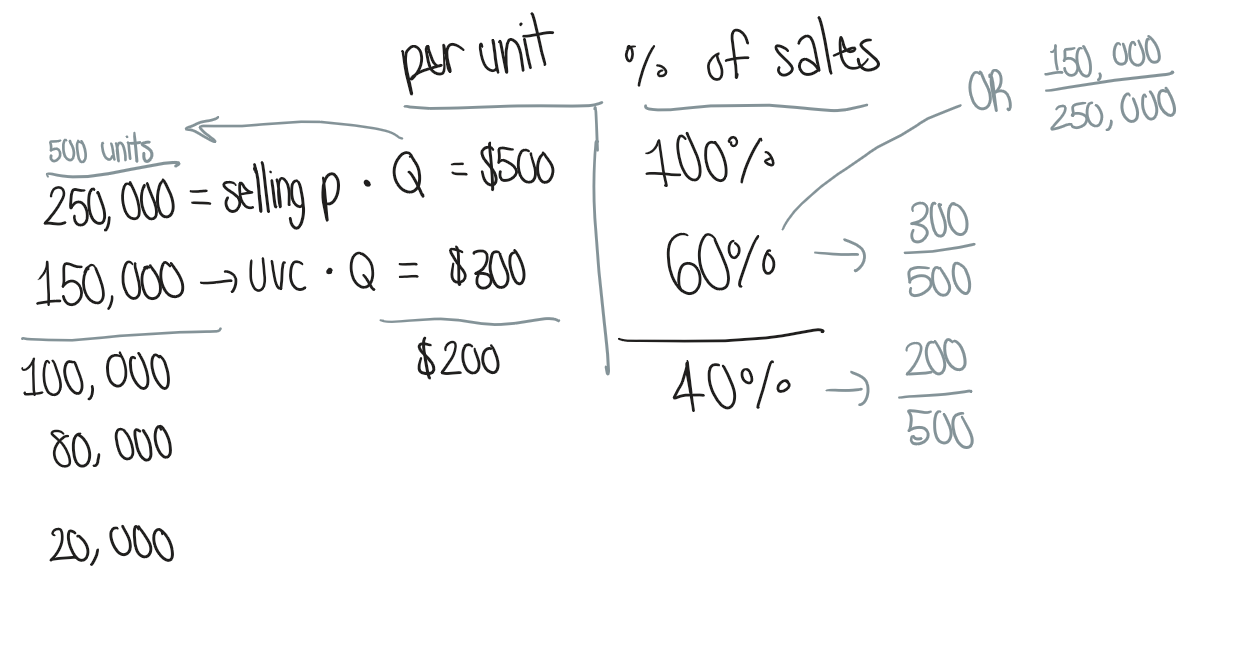
How do you find the percentage contributions of sales, variable expenses, and contribution margin?
Sales = 100%
Variable expenses = unit variable cost / unit sales
Contribution margin = unit CM / unit sales
this means, 40% contributes to covering fixed costs
If the activity level changes, these ratios are still the same!
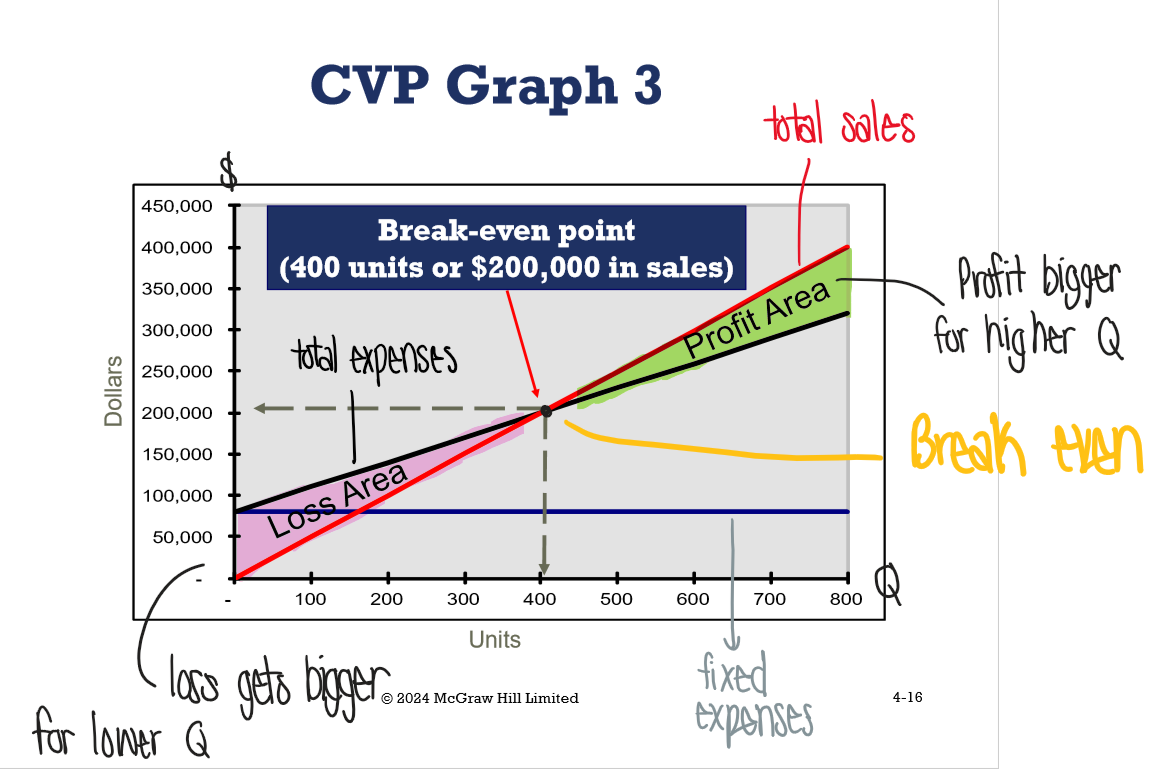
What is the cost-volume profit graph?
If you sell above the break even quantity (intersection), you make a profit
If you sell below, you make a loss
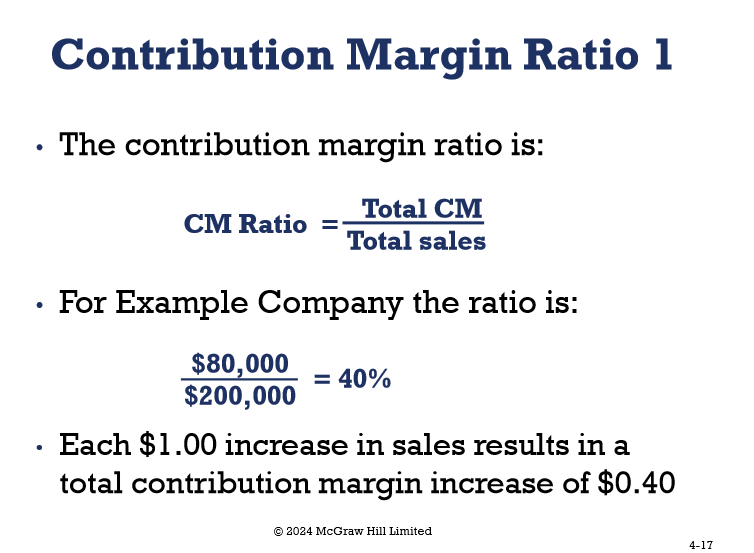
What is the contribution margin ratio formula?
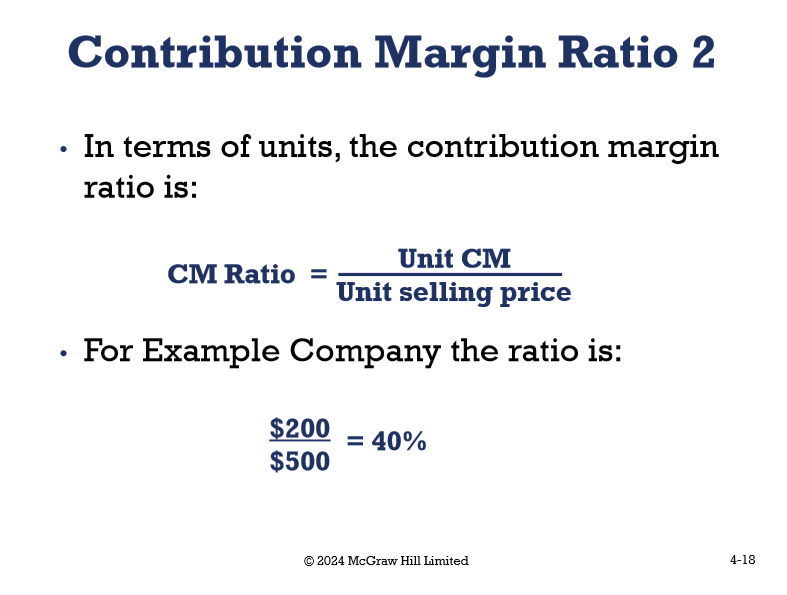
How do you find the contribution margin ratio using units?
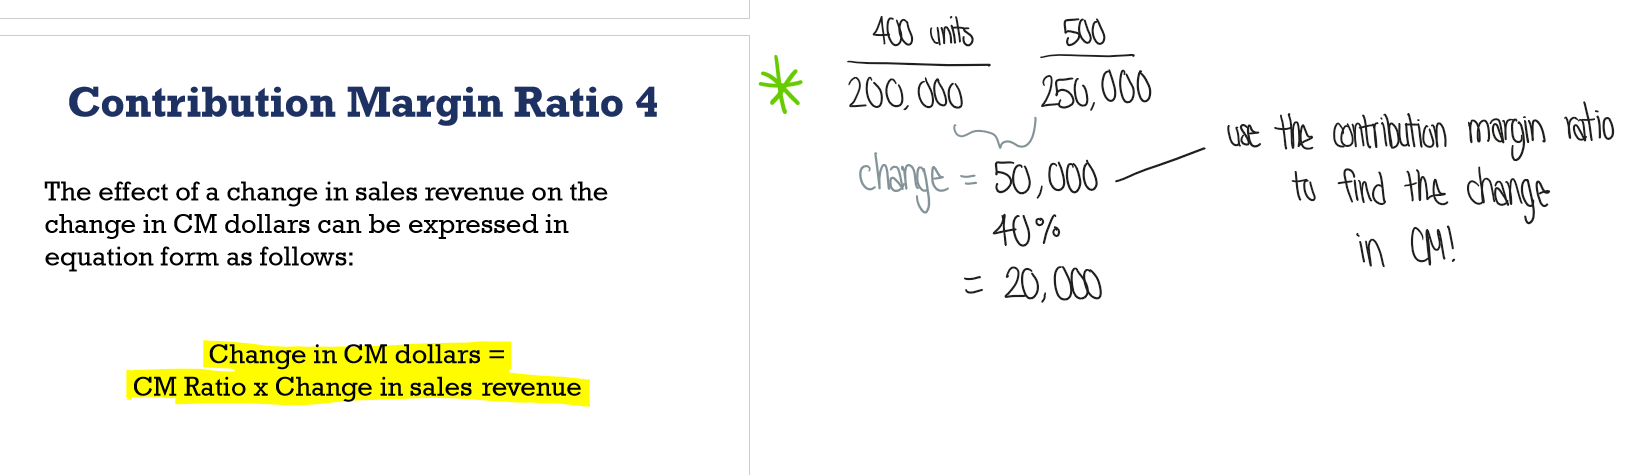
How can you use the contribution margin ratio to find the change in contribution margin dollars?
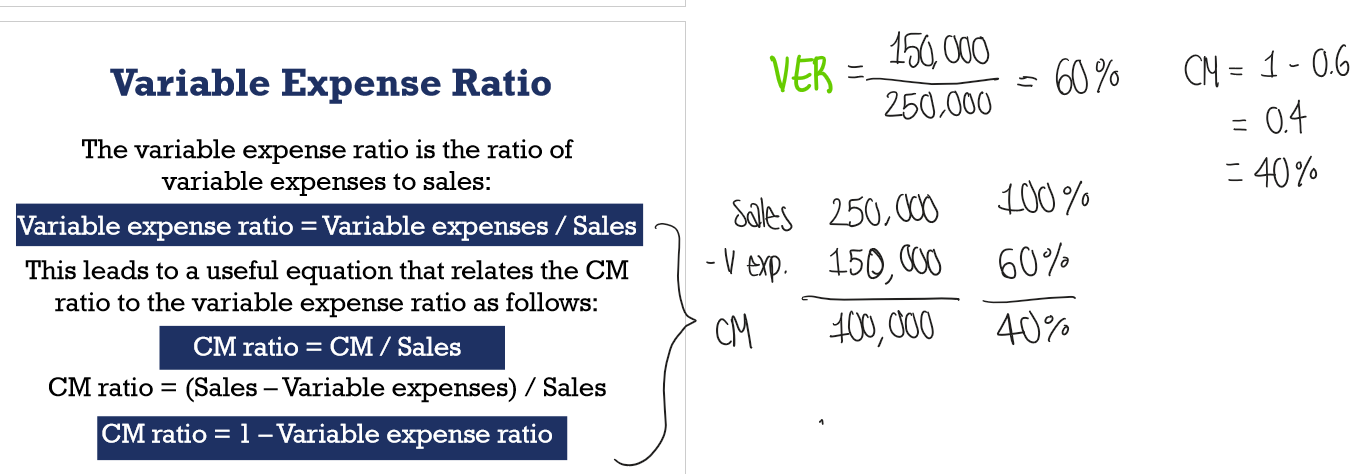
What is the variable expense ratio?
The ratio of variable expenses to sales
What is the break even point in units?
Fixed expenses / unit CM

What is the break even point in sales dollars?
Fixed expenses / CM ratio
CM ratio = CM / Sales
can also get it by multiplying the unit break even point by the selling price

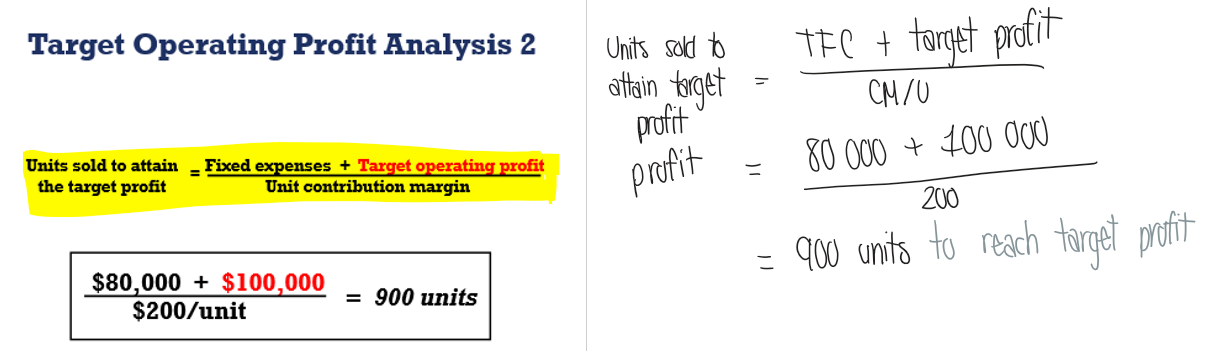
How do you find the units needed to attain the target profit?
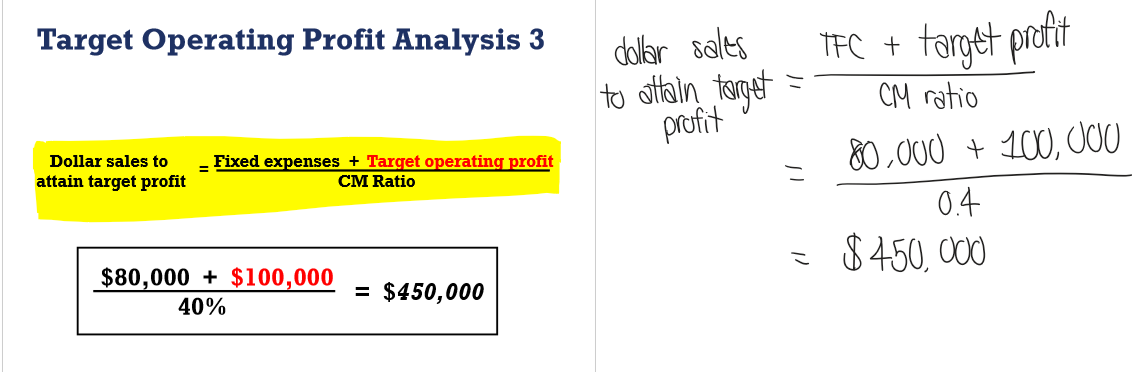
How do you find the sales needed to attain target profit?
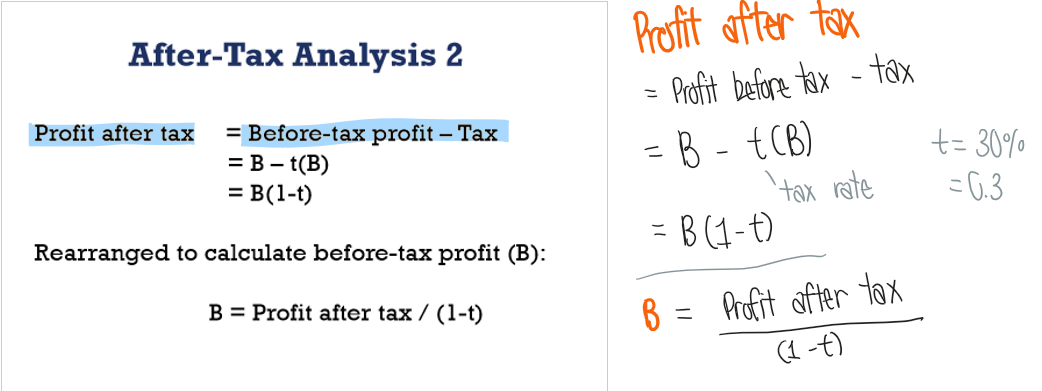
How do you find the profit after tax & the profit before tax?
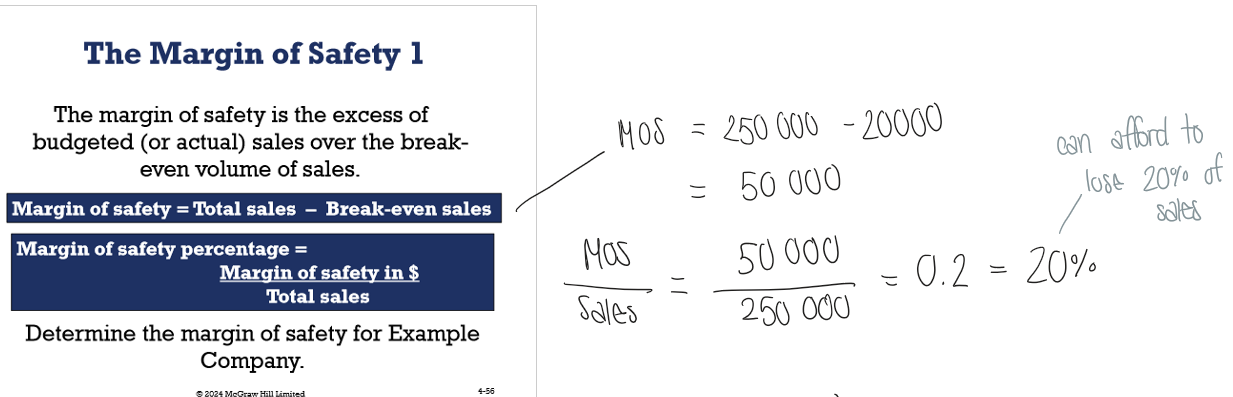
What is the margin of safety?
The excess of sales over the break-even volume of sales
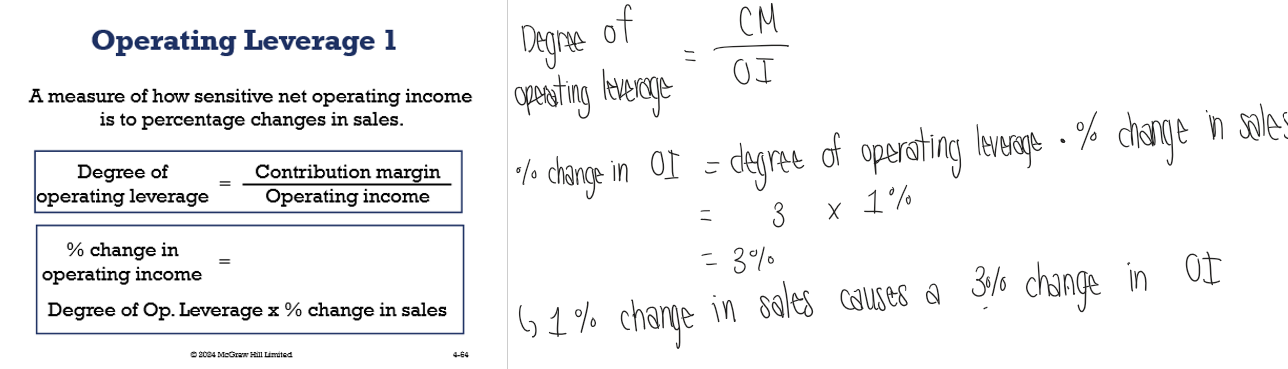
What is operating leverage?
Measures how sensitive net operating income is to percentage change in sales