F255 Ratios
1/52
There's no tags or description
Looks like no tags are added yet.
Name | Mastery | Learn | Test | Matching | Spaced |
|---|
No study sessions yet.
53 Terms
Fixed Charge Coverage
(EBITDA + Lease Obligations) / (Interest Expense + Lease Obligations)
Days Sales Outstanding
(Accounts Receivables / Total Credit Sales) *365
Total Debt Ratio
Total Debt / Total Assets
Business Risk
The fundamental risk of a business, without regard to financial risk
-Equity holders of an unlevered firm only face business risk
Financial Risk
Risk created by debt in the capital structure
-Equity holders of an levered firm faces both business risk and financial risk
Levered Beta =
Unlevered Beta * [1+(Debt/Equity)(1-Tax Rate)]
Unlevered Beta =
Levered Beta / [1+(Debt/Equity)(1-Tax Rate)]
Order of Asset Class
Secured Debt
Senior Unsecured Debt
Subordinated Debt
Preferred Equity
Common Equity
Systematic Risk
Risk that affects the whole market. It's unavoidable, no matter how diversified your portfolio is. Because it can't be eliminated, investors demand a return (a risk premium) for bearing this kind of risk. Investors are compensated.
Unsystematic Risk
Company-specific or industry-specific risk. This risk can be diversified away by holding a well-diversified portfolio. Since it's avoidable, investors are not compensated for it.
Operating Leverage
The degree to which a company’s costs are fixed vs variable
-Companies with high fixed cost and low variable have high operating leverage
-Firms with high operating leverage have higher betas than firms with lower operating leverage
Cost of Debt
If the firm has existing straight bonds outstanding, calculate the yield to maturity (not the coupons rate)
Cost of Preferred Stock =
Fixed Dividend / Price of Preferred Stock
Market value of debt =
% of par value the bond is trading at * book value of debt
As you add debt…
COE always increases
Perpetuity growth method
FCFs of the terminal year * (1+ perpetual growth rate) / (WACC - growth rate)
Exit Multiples Method
Uses key financial ratios for comparable companies applied at the CFs at the end of the forecast horizon.
Annuity
A constant cash flow at pre-specified periods over a pre-specified period of time
Time Value of Money
1. Preference for immediate consumption
2. Risk that $1 affords less consumption in one year than it does today (inflation)
3. Risk of loss if $1 is invested in a risky asset
Perpetuity
constant stream of identical CFs with no end
Growing Perpetuity: growing at constant rate and continuing forever
As time goes to infinity, CF1/(R-G)
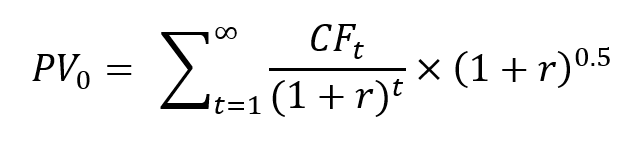
Mid-year discounting
Cash flows happen continuously, so you can use mid-year discounting. We over-discount cash flows that occur at the beginning of the year, but under-discount cash flows that occur at the end of the year.
Fiduciary responsibility of firm
max the current value of shares outstanding
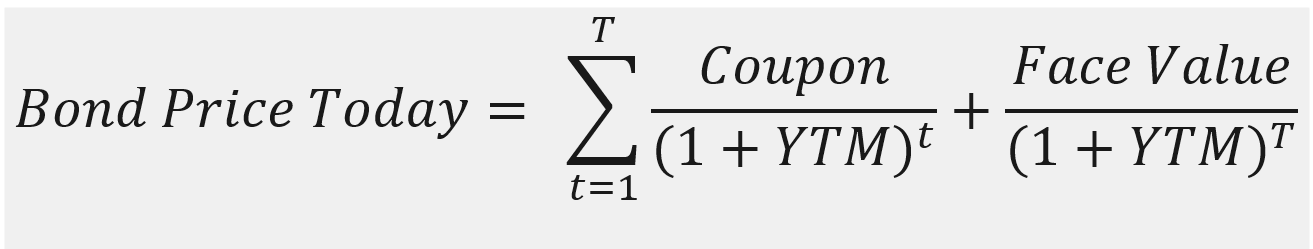
Value of the firm =
FCFt / (1+WACC)^t + cash
Value of firm = Debt + Preferred Stock + Equity so…
Equity = Value of Firm – Debt – Preferred Stock
You want to maximize the value of the firm to maximize equity.
4 Major Decisions:
· Capital Budgeting: how to allocate capital, assets to hold, how to operate them
· Working Capital Management: to whom to grant trade credit (e.g. discount to customers if they pay early), to take trade credit, terms of trade offered and accepted
· Capital Structure: what financial securities to issue to finance assets
· Payout Policy: should firm pay dividends and what form (special dividend, regular dividend, open market share repurchase, tender offer share repurchase?)
If the cash flows start at time t, the shortcut formulas will return the value as of time t-1, and you will still need to discount that result to time 0 by dividing by
(1+r)t-1
Growing Annuity
CF1/r-g * (1-(1+g/1+r)^t)
Sibley Ratio
(EBITDA - CAPEX - Lease Obligations) / (Lease Obligations + Net Interest Expense)
A/P =
(Purchases / 365) *DPO
A/R
(Annual Credit Sales / 365) *DSO
Purchases
The total dollar value of inventory you bought from suppliers during a period, at cost (not selling price).
End Inventory + COGS - Beg Inventory