Instrumental Analysis
 Call Kai
 Learn
Learn Practice Test
 Spaced Repetition
 Match
Match Flashcards
 Knowt Play
1/168

There's no tags or description
Looks like no tags are added yet.
Name | Mastery | Learn | Test | Matching | Spaced | Call with Kai | Chat |
|---|
No analytics yet
Send a link to your students to track their progress
169 Terms
Electromagnetic Radiation Spectrum
spectroscopy allows us to examine how a material interacts with EMR
use that interaction to obtain info about its composition & molecular structure
use UV, Vis, and IR mainly
PROPERTIES:
molecules and their energy levels are one main aspect of spectroscopy
EMR — light — form of energy inducing transitions between different energy levels
its behavior is described as a WAVE and PARTICLE

Particle Model
EMR is seen as a beam of energetic particles (photons)
each photon has a defined energy, which depends on the frequency of radiation → energy of photon proportional to the frequency of radiation

Wave Model
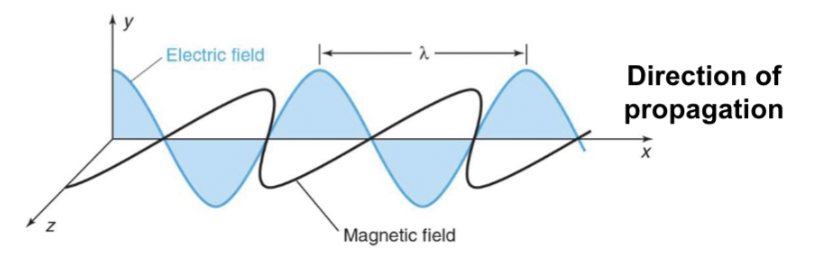
EMR is represented as oscillating electric (E) and magnetic (M) fields
both fields oscillate in-phase along a linear path and are oriented at perpendicular angles to each other (plane polarized)
Frequency
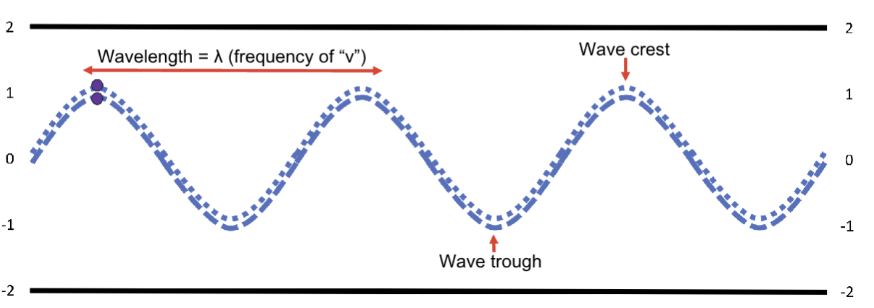
number of oscillations of the field per unit time
Wavelength
linear distance between any two equivalent points on successive waves

Wavenumber
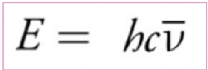
In vibrational spectroscopy (IR spectroscopy), often use the reciprocal of wavelength in centimeters as measure of frequency of radiation (v with line over it)
conveys info about the lambda (wavelength)
directly proportional to wavelength, and thus the eqtn
Absorption
EMR from source is absorbed by sample
increases the energy of molecule
EMR only interacted with molecules at specific energies
Promotes molecule from its ground state to higher-energy excited state

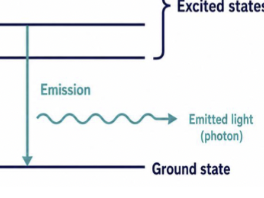
Emission
EMR emanates from sample
Decreases energy of molecule
Continuum Source
emits radiation over a range of wavelength; provides an output that is both intense and stable
ex) Deuterium (D2) Arc lamp for UV-Vis spectrophotometer > continuum source from 185-400 nm
Line Source
emits radiation at selected wavelengths; is both intense and stable
ex) laser for Raman spectrometer → line source is visible region of EMR (532 nm)
Wavelength Selection
most spectroscopic analysis require radiation consisting of a limited narrow, continuous group of wavelengths
ideally, output of wavelength selector would be radiation of single wavelength or frequency
no real wavelength selector approaches this idea, instead a wavelength band is produced
trade-off
Wavelength selector passes a narrow band of radiation characterized by a nominal wavelength, effective bandwidth, and maximum throughput of radiation

Effective Bandwidth
width of radiation at half of its maximum throughput
higher spectral resolution and ability to distinguish closely spaced spectral features
IDEAL wavelength selector has narrow effective bandwidth
High Throughput
more photons passing through the wavelength selector to reach detector and giving stronger signal (generally improves S/N)
IDEAL wavelength selector has high throughput of radiation
Why are effective bandwidth and high throughput partly contridictary?
In a monochromator, effective bandwidth is strongly influenced by entrance and exit slit widths
opening slits allow more radiation to pass through the instrument, increasing signal
wider slits also transmit a broader range of wavelengtth
Wider slits → greater throughput → stronger signal BUT poorer resolution
Narrowing slits restricts wavelength range and improves spectral resolution
also reduces number of photons reaching detector
Narrower slits → narrower bandwidth → better resolution BUT weaker signal
Most modern instruments use monochromators or interferometers
Instrument settings must be selected according to the purpose of the analysis…
1) If detecting or quantifying low-concentration analyte, greater throughput may be more important
wider slits or broader spectral bandwidth can produce stronger signal and better S/N
However, closely spaced peaks may become broader, overlap, or appear as single feature
2) If distinguishing closely spaced spectral bands or IDing subtle differences between materials
narrower bandwidth may be necessary
improves resolution but produces a weaker signal that may need:
longer acquisition times
multiple scans. and signal averaging → FTIR and Raman
a more intense radiation source
a more sensitive detector
Practical Compromise
most appropriate wavelength selector not necessarily one with narrowest possible bandwidth
instead, should be providing sufficient spectral resolution while still transmitting enough radiation to obtain acceptable S/N
Analyst needs to balance spectral resolution & radiation throughput and S/N
Signal
portion of measured response associated with analyte of interest
useful signal should be distinguishable from surrounding baseline and reproducible across repeated measurements
Noise
random fluctuations in measured response that are not related to the analyte
noise can make the baseline appear irregular and can obscure weak spectral features
Chemical Noise
arises from various uncontrollable variables affecting chem of sample being analysed
Thermal Noise
type of chemical noise
Random electrical fluctuations associated with temp
ex) depending on humidity, can see it on FTIR in TX
Environmental Noise
type of chemical noise; vibrations, temp changes, electrical interference, stray light, and fluctuations in the lab environment
Instrumental Noise
noise associated with each component of an instrument (source, detector, etc)
Background
broader contribution that may come from substrate, solvent, atmosphere, fluorescence, or instrument
Interference
signal from another substance that overlaps with or changed the analyte response
Signal-to-Noise Ration (S/N)
compares magnitude of analytical signal with variation in background noise
indicates how clearly analytical signal can be distinguished from baseline variation
Ideal S/N ratio = 3-1

How to enhance S/N in practice
increasing acquisition time
averaging multiple scans (aka co-adding scans)
increasing source of laser intensity, when safe for the sample
increasing slit width or spectral bandwidth
minimizing stray light and environmental interference
using appropriate background or blank correction → run controls first
Limitations of Enhancing S/N
Increasing acquisition time or source intensity can cause:
detector saturation
sample heating or photodegredation
longer analysis times
reduced spectral resolution if wider slits are used
Broadening Effect
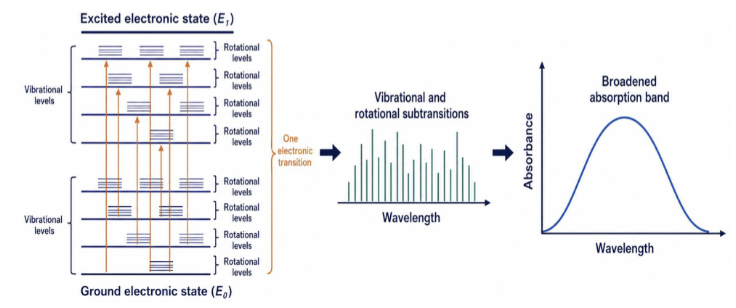
In UV-Vis Absorption Spectrophotometry, between electronic states there are vibrational/rotational levels
depending on polarity, influences the transitions (some will disappear)
absorbance band corresponds to single electronic transition, which can be broadened by vibrational and rotational transitions
Transitions in visible region
electronic transitions in the visible region produce colors that can be observed by the human eye
the observed color is complementary to the wavelength of light absorbed
ex) colloidal gold absorbs green light (~520 nm), giving the solution a red (ruby-red) appearance

UV-Vis Spectrophotometer General Set-Up
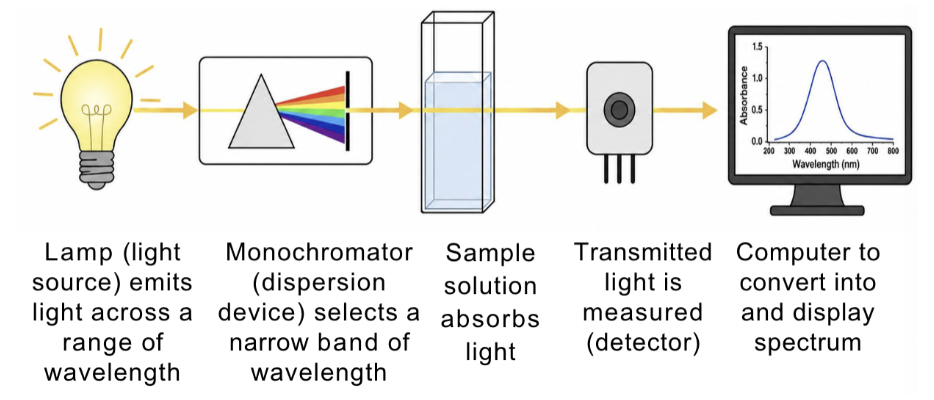
Single-Beam UV-Vis Spectrophotometer
uses one light path through the instrument
measures the blank first to establish a reference
measures the samp separately after the blank
requires stable lamp output because the blank and samp are measured at different times
generally, less expensive than double beam spectrophotometers
Double Beam UV-Vis Spectrophotometer
compares the sample and reference signals simultaneously or in rapid sequence
automatically compensated for changes in lamp intensity and instrumental drift
constantly changing which sample the light goes to

Light Source IDEAL REQUIREMENTS (UV-Vis)
1) Brightness across wide wavelength range
demands both high degree of brightness and uniform brightness across the measurement wavelength range (uniform brightness distribution)
necessary to obtain photometric values with high S/N
generally, results in reduction of long service life
but if v bright source = shorter service life
2) Stable over time
3) Long-Service Life
many light sources meet some of those requirements, but no light source mets them all
difficult to achieve both “high degree of brightness” and “uniform brightness distribution” across wide wavelength range using single light source
some spectrometers allow switching between light sources with diff emission wavelength ranges (allows to always use source with the highest intensity)
ex) switch between tungsten-halogen lamp for visible range and a deuterium lamp for UV range according to the wavelength setting
Deuterium Arc Lamps (UV-Vis)
consists of a sealed bulb containing deuterium gas
discharge light source with several hundred Pa D2 sealed in bulb
good intensity continuum in UV region and useful intensity in visible region (185-400 nm)
over time, intensity of light decreases steadily
short half-life of D2 means lamp needs to be replaced relatively frequently to maintain sufficient and stable light intensity

Tungsten-Halogen Lamps (UV-Vis)
tungsten filament housed in quartz bulb filled with inert gas and small amt of halogen (iodine or bromide)
when electric current heats filament, it emits radiation over limited UV spectral range and over entire visible spectral range
very low noise and minimal signal drift = GOOD
stable over time

Xenon Lamps (UV-Vis)
consists of quartz bulb filled with pressurized xenon gas and fitted with 2 electrodes
application of high voltage forms electrical arc between electrodes and excites xenon atoms, producing intense EMR
broad spectral coverage from the UV through the visible region to near-IR (185-2500 nm)
strong UV output
exhibits similar spectral distribution to sunlight (no secondary light source is required = GOOD)
won’t be as intense of light because covers broad span
expensive and shorter lifespan = BAD
produces substantial heat and require high-voltage power supplies = BAD

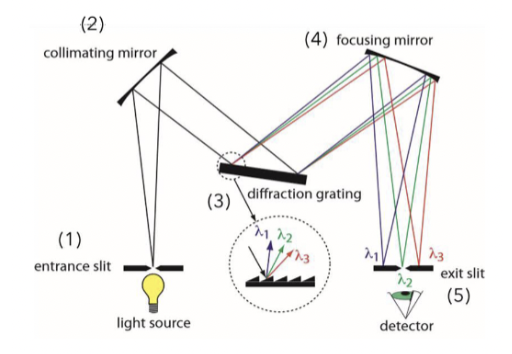
Monochromators
all light sources produce a broad-spectrum white light (contains various wavelength that can be separated)
white light entering this is extracted to a selected wavelength band
ideally, output from monochromator is light of a single wavelength (ex. green is 540 nm)
The smaller the wavelength band, the better the resolution (but signal will be lower)
Monochromators consist of:
an entrance slit
a dispersion device to spread light into different wavelengths (like a rainbow) (prism or diffraction grating) and allow selection of band of wavelengths
an exit slit where light of wavelengths passes through and onto sample
Beer’s Law
the longer the path length of the sample, the greater the sensitivity of analysis
selection of cuvettes
Absorbance is directly proportional to the path length of the sample
light beam encounters more absorbing molecules, resulting in higher absorbance value and greater sensitivity in detecting the substance
concentration represents the number of absorbing molecules within a given volume
as concentration increases, more molecules are available to absorb the incident radiation
Detector (UV-Vis)
photomultiplier tube and silicon photodiode sensitive in the UV and Vis region → not talking about the ones in the infrared range
Photomultiplier Tube (UV-Vis)
(200-900 nm)
photoelectrons are discharged when light strikes photoelectric surface (cathode)
cause successive emission of secondary electrons from dynodes arranged in multiple stages (8-10 dynodes)
reaches the anode
high voltage (-HV) is applied from outside the tube to accelerate electrons
Advantage: produces large output for low level of light intensity and offers high sensistivity

Dynode
multiuplies the number of electrons → get a much larger output of light that we started out with (especially with lamps with less intense light)
Silicon Photodiode
(190-1100 nm)
1) light reaches detector → after passing through the sample, remaining UV or Visible light strikes silicon photodiode
2) Photon transfers energy to an electron → photon has enough energy
3) A “hole” is left behind → when electron leaves its OG position, it creates an empty spaced called a hole; hole behaves like a mobile positive charge
4) the detector separates charges → electric field drives electron and hole in opposite directions
their movement produces an electrical current (photocurrent that becomes your absorbance spectrum)

p-type region
silicon with added boron or aluminum
contains an excess of positively charged “holes”
negative terminal is connected
n-type region
silicon with added phosphorus or antimony
contains an excess of electrons
positive terminal is connected
Chromophores
atoms or groups of atoms within a molecule that absorb UV-Vis radiation
commonly contain pi-bonds, conjugated double bonds, aromatic rings, or nonbonding electrons = make absorption spectrum
wavelength of maximum absorption
ex) Ethylenic E-band at 208 nm
substances with same chromophore produce similar UV-Vis spectra under identical conditions
similar UV spectra may associate substances sharing it with the same class (drugs) → ex) phenethlylamines

Wavelength of Maximum Absorption (λmax)
can assist in characterizing a chromophore or comparing related compounds
Auxochromes
functional group containing 1+ lone pairs of electrons
can influence both wavelength and intensity of UV absorption of nearby chromophore
when directly conjugated with chromophore’s pi-electron system, shift absorption to longer wavelength and increase intensity
Basic (e- donating), amino (-NH2), hydroxyl (-OH), and methoxy (-OCH3) groups
acidic (e- withdrawing), sulfonic acid (-SO3H), and carboxyl (-COOH) groups
ex) Amphetamine → auxochrome is -NH2 (amino) group on sat chain, separated from pi-system by methylene (-CH2-) group, does not act as strong shifting auxochrome
Factors Affecting Absorption
presence or absence of chromophore
Solvent properties that affect band shape, lambda max, absorption intensity
polarity
pH
Bathochromic Shift
UV-Vis shifting of lambda-max to longer wavelength
ex) morphine dissolved under acidic conditions- absorption band lambda max = 285 nm
when solution is made basic, absorption band is broader and lambda-max shifts to 296 nm

Hyposchromic Shifts
UV-Vis shifting of gamma-max to shorter wavelengths
ex) pentobarbital dissolved in strong base (pH13): absorption band lambda-max = 254 nm
when pH decreased to ~9 with boric acid, absorption lambda-max shifts to 239 nm

Hyperchromic Shift
increase in the intensity of a UV-Vis band
Hypochromic Shift
decrease in the intensity of a UV-Vis band
Solvent Selection in UV-Vis - Wavelength
solvent itself may absorb UV radiation and interfere with analyte spectrum; measurements close to or below the solvent wavelength become unreliable
because too close to absorption of solvent
If solvent absorbs strongly:
less radiation reaches the detector
noise increases
analyte bands may become distorted or obscured
blank subtraction may become unreliable
solvent blank can correct for moderate solvent absorption

Solvent Selection in UV-Vis - pH and Solubility
acidic solvents dissolve basic drugs, while basic solvents dissolve acidic drugs
basic solvents improve their solubility by converting them into their ionized forms
ex) Ibuprofin (monocarboxylic acid)
top = in NaOH (improve solubility)
bottom = in H2SO4 (acid in acid = no absorption or dissolving)

Transmittance
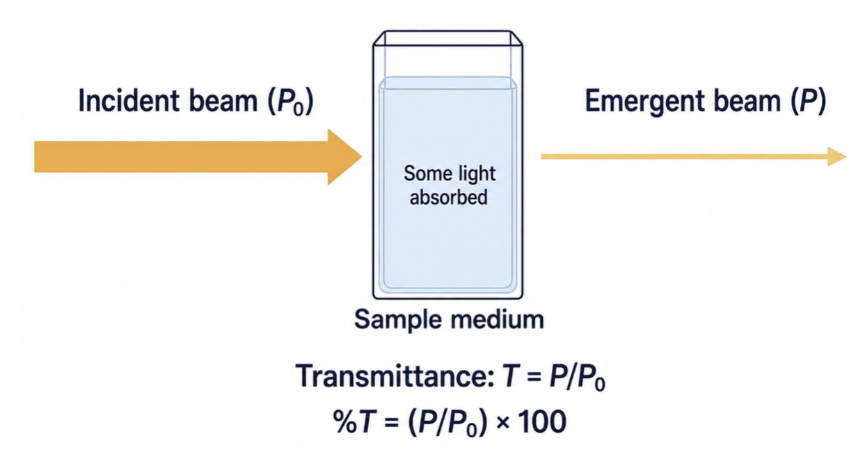
Absorbance

Lambert’s Law
path length represents the distance traveled by the radiation through the sample
longer path gives radiation more opportunities to encounter absorbing molecules
why you want to use the same cuvettes and just clean them in between (will have exact same pathlength)
Beer-Lambert’s Law
absorbance is related to concentration by this law
provides direct correlation between absorbance (A) of molecule to concentration © and path length (b) of sample

Molar Absorptivity
how much light is absorbed at specific wavelength by specific substance (amt of light absorbed per unit concentration)
Stray Radiation (UV-Vis)
radiation reaching the detector whose wavelengths are outside the selected spectral band
caused by poor instrument design (light getting into instrument from lab lights or daylight or light not being well separated by monochromator) or from damage to instrument
have instrument performance checks to ID stray light issues using test solution

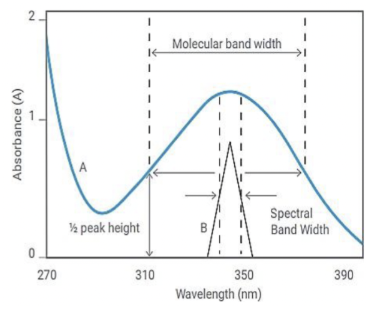
Optimal Spectral Band Width (SBW) (UV-Vis)
related to the physical slit width of the monochromator design
for most mid-range UV-Vis spectrophotometers, fixed SBW of 1.5 nm is common/sufficient for resolving peaks of most liquid/solid samples
Using larger SBW allows more light through the sample
can give better quality data and less noise
will not resolve narrow or close together peaks
Using smaller SBW allows less light through the sample
provides better resolving power
can result in increased data collection times to achieve the same data quality
Standard Check Procedure Using Caffeine for UV-Vis
1) Prepare a caffeine ref soln of known concentration in 2/3 N sulfuric acid & record all prep details
2) Complete the required baseline and zero measurements using a solvent blank
3) Analyze the prepared standard soln in the 220-340 nm range
4) Determine the wavelength of maximum absorbance (gamma-max) and corresponding absorbance value
5) Compare measured gamma-max and absorbance with established acceptance criteria to verify wavelength and photometric performance
6) save, review, and document the spectrum and results in the appropriate instrument maintenance or quality-control record
E Value
When the path length is fixed at 1 cm, a and b can be combined into a single constant (E = ab)
E value indicates how much absorbance is expected per unit concentration under specified measurement conditions (mg/mL)
Only valid for the particular…
substance
chemical form, such as a free base/salt
wavelength
solvent and pH
path length

Conversion of base form to salt form
E value was established using cocaine in its free-base form
if another analytical technique, such as FTIR spectroscopy, indicates that cocaine is present as a salt
Can calculate percentage purity of that salt by accounting for difference between MW of free-base and salt forms
salt-form purity can be calculated using MW of free-base and salt forms

Why do molecules absorb IR?
IR light absorbed by molecules at specific frequencies
occurs when energy of IR radiation matches energy required for molecule atoms to vibrate
vibrations involve periodic changes in bond angles
for vibration to produce IR absorption band, it must cause change in molecule’s dipole moment
Nonlinear molecules # of vibrational modes
3N - 6
each atoms can move in 3 spatial directions, giving molecule 3N total degrees of freedom
3 motions correspond to translation of entire molecules
3 rotational degrees of freedom
Linear Molecules’ # Vibrational Modes
3N - 5
each atoms can move in 3 spatial directions, giving molecule 3N total degrees of freedom
3 motions correspond to translation of entire molecules
2 rotational degrees of freedom
Stretching Vibration
change in distance along axis of bond between 2 atoms
stretching is only changing length of bond
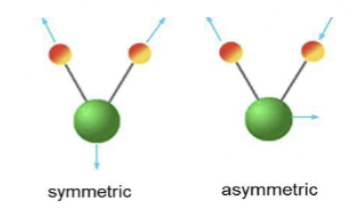
Bending Vibration
change in angle occurring between 2 bonds
(+) = movement toward the observer
(-) = movement away from the observer
→ = movement in the plane

Selection Rules for IR
1) For IR absorption to occur, its vibration must cause change in its dipole movement (change in how unevenly electrical charge is distributed within the molecule
2) Dipole moment determined by… difference in electrical charge between bonded atoms and distance between positive and negative centers of charge
3) Number of IR absorption bands observed in spectrum may be less than calculated number of possible vibrational nodes
some vibrations don’t change dipole moment
some absorptions may be too weak to detect
some bands may occur outside instrument’s measured range
2+ vibrations may occur at same or very similar frequencies, causing their bands to overlap
Do shirt or long bonds vibrate faster in IR?
SHORT BONDS ARE STRONGER AND ABSORB MORE ENERGY SO THEY VIBRATE FASTER
Hooke’s Law
used to approximate energy/frequency associated with vibrations to better understand factors involved
APPROXIMATIONS
Atomic Mass → as mass of atom attached to carbon increases, predicts reduction in energy absorbed, thus vibrational frequency decreases
Bond Strength → remove pi bond and remaining bond is longer and weaker, weaker bond absorbs less energy & vibrational frequency decreases

Are stretching or bending frequencies higher?
Stretching frequencies (easier to bend a bond than to stretch/compress it)
Fundamental Bands
occur when molecule moves from its lowest vibrational level to next level (v=0 to v=1)
most common and usually strongest bands in IR spectrum
Overtone Bands
Occur when molecule moves from its lowest vibrational level to second or third level (v=0 to v=2-3)
generally appear near 2-3x frequency of fundamental vibration but are much weaker
Combination Bands
occur when 2+ more different vibrations are excited simultaneously
Simple Approach to Spectrum ID (General Rules) IR
1) Look first at the high-wavenumber end of the spectrum (>1500 cm^-1)
2) For each band, ‘short-list’ the possibilities by using a correlation table
3) Use the lower-wavenumber end of the spectrum for the confirmation or elaboration of possible structural elements
4) Do not expect to be able to assign every band in the spectrum
5) Exploit the absence of major peaks as well as their presence
6) Band intensities should be treated with some caution. Under certain circumstances, they may vary considerably for the same group
What does FTIR stand for?
Fourier Transform Infrared
FTIR General Set-Up
1) IR source produces broad IR radiation
2) Interferometer (not monochromator) that modulates IR beam
3) Sample absorbs characteristic IR frequencies
4) Detector generates this interferogram
2 main detectors (we have both- one in microscope and one in FTIR)
5) Fourier transform function in computer converts interferogram into IR spectrum

Silicon Carbide Rod (Globar)
most common in modern spectrometers
silicon carbide (SiC) rod electrically heated to ~1000-1500 C
5 mm diameter, 50 mm long
produces strong, continuous radiation across most of mid-infrared region
durable, stable, and relatively inexpensive
doesn’t require preheating to become electrically conductive
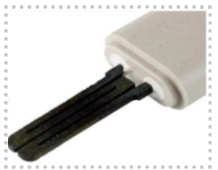
Nernst Glowers
ceramic rod composed of mixture of rare-earth metal oxides (zirconium, yttrium, and thorium)
1-2 mm diameter, ~20 mm long
typically operated at ~1200-2000 C
produces intense continuous mid-IR radiation
not electrically conductive at room temp and must first be externally heated
not capable of producing IR radiation above 2000 1/cm
more fragile and generally less convenient than the Globar
Michelson Interferometer
the most common & main name
1) IR radiation strike beamsplitter made of potassium bromide
2) ½ of radiation passes through beam splitter toward fixed mirror
3) ½ of radiation is reflected t 45 degrees angle toward moving mirror
4) Both beams reflect off surfaces of 2 mirrors and recombine at beamsplitter
5) Constructive and destructive interference occurs, before the resulting beam passes through the sample and then continues on to the detector
The resulting signal called interferogram: raw signal containing info from every IR wavelength
Moving Mirror in FTIR
only piece in movement within interferometer → as it changes position, IR wavelength interfere with one another
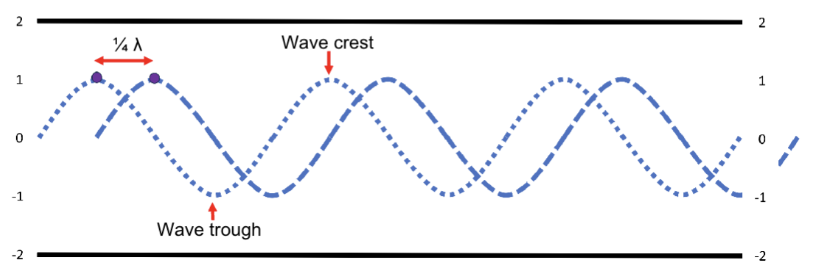
Constructive Interference
recombine at the same time/no change
2 beams are “in-phase” → crests are at the same point at same distance/time (maximum in signal in detector- creation of band)
Phase difference = 0

Destructive Interference
2 beams are “out-of-phase” → crests are NOT at same point at same distance/time
phase difference = ½ wavelength

Partial Interference
occurs between 2 extremes of constructive and destructive interference
beams are not in-phase but also not completely out-of-phase (phase difference = ¼ wavelength)
Deuterated Triglycine Sulfate (DTGS)
responds to changes in temp produced by incoming IR radiation
1) Crystal absorbs radiation and undergoes very small temp change
2) Temp change alters crystal’s electrical polarization
3) Resulting change in surface charge produces electrical signal proportional to variation in IR intensity
Key characteristics of DTGS Detector:
operates at room temp
durable and convenient for routine FTIR analysis
covers a relatively broad spectral range
less sensitive and slower than MCT detector
commonly used in standard ATR-FTIR and transmission instruments
USED IN SEIZED DRUGS

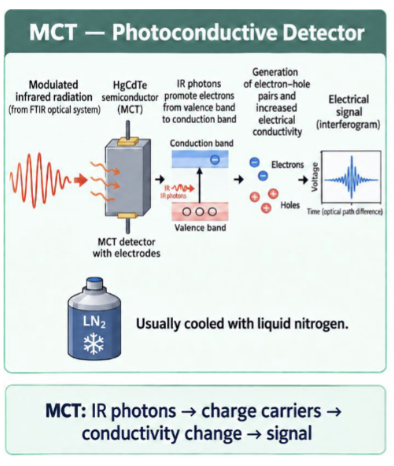
Mercury Cadmium Telluride (MCT)
semiconductor photon detector that responds directly to IR photons
located in microscope of FTIR spectrometer
1) IR photons enter semiconductor
2) photons with sufficient energy promote electrons across the material’s band gap
3) process generates mobile charge carriers (electrons and holes)
4) instrument measures conductivity as electrical signal
Key characteristics of MCT detector
much faster and more sensitive than DTGS
well suited for microscopic samples and those producing weak signals
commonly used in FTIR microscopy
requires liquid-nitrogen cooling (takes 15 min to reach correct temp)
spectral range that depends on its specific chemical composition
can saturate more easily when exposed to intense radiation
Fellgett or Multiplex Advantage
all wavelengths of IR energy are measured simultaneously
several scans can be collected in same amt of time a dispersive instrument would take to collect one scan
co-adding several scans will lead to improvement in S/N
S/N proportional to square root of total number measurements
recording twice as many scans, which takes twice as long, does NOT double S/N (need to look at square root)
Jaquinot Advantage
increased optical throughput (FTIR > dispersive)
In FTIR spectrometers, no slits in interferometer to limit amt of light reaching detector
instead, optical aperture is present and proper aperture diameter must be used to achieve desired resolution
Beam area of FTIR75-100x larger than slit width in dispersive spectrometer
more light is allowed to flow through, resulting in greater sensitivity
important if sample is thick and/or sample accessory limits optical throughput, resulting in energy limitations
Connes Advantage
Use of internal Helium-Neon (HeNe) laser
precise internal reference for monitoring position and movement of interferometer’s moving mirror
HeNe laser emits light as a highly stable, known wavelength
its interference pattern allows the instrument to:
measure moving mirror’s position and optical path difference very accurately
trigger detector measurements at evenly spaced mirror positions
maintain consistent mirror velocity during scanning
does not interact with sample of generate sample’s IR spectrum
Resolution
ability to detect or separate spectral features such as individual absorption bands
value determines number of data points that will be measured
units = wavenumbers
must be less than or equal to separation of bands (baseline typically 4)
smaller/lower resolution value results in more spectral detail (more data points collected, but noise can become a problem)
larger/higher resolution values results in less spectral detail (features may be missed because fewer data points collected)
FTIR
Fourier Transform InfraRed
FTIR Spectroscopy General Set-Up
1) IR Source produces broad IR radiation
2) Interferometer (not monochromator) modulates IR beam
3) Sample absorbs characteristic IR frequencies
4) Detector generates the interferogram
5) Fourier transform function in computer converts interferogram into IR spectrum

Beamsplitter
splits beam into 2 roughly equal parts → 1st goes to fixed mirror and 2nd goes to moving mirror
beam will recombine and go to 2nd mirror, get sent to 3rd mirror and then through the sample and goes through detector
Silicon Carbide Rod (Globar)
most common in modern spectrometers
Silicon carbide (SiC) rode electrically heated to ~1000-1500 degrees C
5 mm diameter, 50 mm long
produces strong, continuous radiation across most of mid-infrared region
durable, stable, and relatively inexpensive
doesn’t require preheating to become electrically conductive
most common IR source in modern FTIR instruments

Nernst Glowers
ceramic rod composed of mixture of rare-earth metal oxides (zirconium, yttrium, thorium)
1-2 nm diameter, ~20 mm long
typically operated at ~1200-2000 degrees C
produces intense, continuous mid-IR radiation
not electrically conductive at room temp and must first be externally heated
not capable of producing IR radiation above 2000 1/cm
more fragile and generally less convenient than a Globar

Michelson Interferometer
the most common and main name
IR Radiations strike beamsplitter made of potassium bromide
½ of the radiation passes through beam splitter toward fixed mirror
½ of the radiation is reflected 45 degrees angle toward moving mirror
Both beams reflect off surfaces of 2 mirrors and recombine at beam splitter
Constructive and destructive interference occurs, before the resulting beam passes through the sample and then continues on to the detector → makes an interferogram

Interferogram
raw signal containing info from every IR wavelength
varies with mirror displacement
expressed as a function of time, from which retardation (traveled distance) can be deduced
plot of IR intensity vs moving mirror’s position converted with mathematical function (Fourier transform)
Moving Mirror
only piece in FTIR in movement within interferometer
as moving mirror changes positions, IR wavelength interfere with one another
Constructive Interference
recombine at the same time/no change
2 beams are “in-phase:" crests are at same point at same distance/time
maximum in signal in detector (creation of band)
Phase difference = 0