GPCO 410 Globalization
1/90
There's no tags or description
Looks like no tags are added yet.
Name | Mastery | Learn | Test | Matching | Spaced | Call with Kai |
|---|
No analytics yet
Send a link to your students to track their progress
91 Terms
What is the principle of non-discrimination in the WTO?
The principle of non-discrimination in the WTO refers to two key concepts: Most-Favored-Nation (MFN) treatment, which mandates that any trade advantage granted to one member must be extended to all WTO members, and National Treatment, which requires that foreign goods and services be treated no less favorably than domestically produced counterparts once they enter the market.
What is Globalization? The Three-Part Definition
Increasing economic exchange across political and physical borders
• Once limited to physical goods and labor, now includes services, finance, and intellectual property
• Local & national markets are more integrated
• Prices shift across borders simultaneously and tend to converge
• These price trends reshape economic structures
• Example: wage changes in one country influence costs and prices in another — visible today in tariffs
• Large- Scale, transnational organizations
• Multinational corporations
• International organizations – World Bank, IMF
• NGOs
The Long Arc of Globalization 1870-1914
Main Features: First modern wave of integration;migration and capital flows at historic highs
Drivers: Industrial revolution, steamships, gold standard
Lessons: Market integration requires stable monetary and political systems
The Long Arc of Globalization 1919-1939
Main Features: collapse after WWI and the great depression s
Drivers: Smoot hawley tariffs, autarky, financial panic
Lessons: Weak leadership and protectionism destroy cooperation
Types of flows and Transactions
1. Services: Tourism, Transport, Accounting, Architecture, Movies/Music, ...
2. Foreign Direct Investment (FDI): Investment goods (factories, mines,
equipment, IP) financed & controlled by foreign entities.
3. Finance: insurance, loans, and portfolio investment.
4. People: migration
The Long Arc of Globalization 1945-1975
Main Features: Rebuilding through Bretton Woods system
Drivers : U.S. leadership, fixed exchange rates, IMF and World Bank
Lessons:Managed globalization stabilizes capitalism
The Long Arc of Globalization 2008-Present
Main Features:Slowdown and partial fragmentation
Drivers: U.S.–China rivalry, financial crises, regionalization
Lessons: Globalization persists but becomes more contested
Globalization Theories Hegemonic
Hegemonic Stability Theory (Kindleberger, 1973; Gilpin, 1973)
A stable global economy requires a hegemon — a dominant power large enough to benefit from, and enforce,
stability.
• The hegemon provides global “public goods”:
• Stable currency and financial system
• Open trade and security guarantees
• Leadership in crises (e.g., U.S. after 1945)
• When the hegemon declines, global cooperation weakens → instability and fragmentation.
Alignment-Based Globalization Theory
Countries differ in policy preferences — regulation, governance, alliances, etc.
• Globalization grows when policies are aligned, reducing barriers and “border effects.”
• Hegemons drive alignment through treaties, trade blocs, and institutions.
• In unipolar systems, globalization flourishes (shared rules).
• In multipolar systems, outcomes depend on rising powers’ preferences — may reinforce or fragment the system.
The Bretton Woods Order
Origins: Postwar leaders designed a system to prevent another Great Depression and rebuild trust in
trade and finance.
Bretton woods conference established world bank and international monetary fund
Institutions and Roles:
• IMF: Stabilize exchange rates, provide short-term financing.
• World Bank: Fund reconstruction and development projects.
• GATT/WTO: Lower tariffs and resolve trade disputes multilaterally.
U.S. Role: Supplied liquidity and markets, tied the dollar to gold ($35/oz), and became the anchor of
the system.
Collapse in the 1970s: The Nixon Shock ended convertibility, creating floating rates and a shift
toward financial globalization.
Legacy: Multilateral institutions remain central but face new legitimacy and power challenges as
emerging economies gain weight.
Factor Endowments
Definition: The stock of productive inputs—land, labor, capital, and human capital—available toan economy.
• Endowments change over time: Investment in education, innovation, and infrastructure can alter a country’s trade profile.
Deal with a countries opportunity cost to produce a good
Comparative Advantage:
the ability of a country, company, or individual to produce a good or service at a
lower opportunity cost than another.
• Countries export goods that use their abundant factors intensively.
• Labor-abundant : textiles, agriculture.
• Capital- and skill-abundant : machinery, technology.
• Factor Intensity: How much each good relies on different inputs.
• Example: Apparel (labor-intensive), microchips (capital- and skill-intensive).
Winners and Losers:
Winners: sectors using abundant factors (exporters).
Losers: sectors using scarce factors (import-competing industries)
Protectionism
Benefits concentrated groups while spreading costs among consumers.
Collective Action
Small groups with large stakes organize easily (farm lobbies, steel unions).
• Large groups with diffuse benefits rarely mobilize.
• Trade policy outcomes reflect organization and politics, not efficiency alone.
Rules of Nondiscrimination
From GATT to WTO: The 1947 GATT established rules for non-discrimination and reciprocity. The
1995 WTO expanded this into a formal institution covering goods, services, and intellectual
property.
• Core Principles:
• Most-Favored Nation: equal treatment across partners.
• National Treatment: imported goods treated the same as domestic ones.
• Reciprocity and transparency ensure balanced liberalization
Challenges: Consensus decision-making, unequal power, and limited enforcement capacity
create deadlocks (e.g., Doha Round).
• Big takeaway: Multilateralism lowers transaction costs but depends on trust and leadership.
The Uruguay Round “Grand Bargain
Developing countries gained market access; developed countries gained IP and service protections
Firms as Engines of Globalization- Why firms Exist
Why firms exist: To reduce transaction costs and internalize production when markets are
inefficient.
Core competencies: The unique strengths, skills, and capabilities that give an organization a
competitive advantage.
• Innovation, brand design, logistics
Types of FDI:
Horizontal : duplicates what a firm is doing in another country to access new market
Substitute for international trade
Vertical : splits production stages across countries to exploit cost differences
Complement to international trade
Example of foxconn and apple,
Credibility and Risk for firms
Once capital is sunk, governments may alter taxes or regulations (the “obsolescing bargain”).
• Firms manage this risk with bilateral investment treaties, investor–state arbitration (ICSID), and global
reputation.
The Obsolescing Bargain
Definition: When the bargaining power shifts from the
multinational to the host government after FDI is
committed.
• The host can change laws, expropriate, or impose new
taxes once the firm’s assets are immobile.
Stages
• Host offers concessions to attract FDI.
• Firm invests—creating sunk costs.
• Host tightens regulation or seizes control (“expropriation”).
Examples
• Carlsberg in Russia: assets seized by Kremlin.
• Próspera in Honduras: government reversed ZEDE law.
Global Production Networks and Value Chains
Definition: Interconnected production stages spanning multiple countries.
• Logic: Each country contributes where it has cost or skill advantages.
• Firm behavior:
• Keep high-value tasks (R&D, design, branding).
• Outsource low-value, labor-intensive stages (assembly, logistics).
• Country strategies:
• Bangladesh: entry through apparel assembly.
• Vietnam and Mexico: electronics and auto components.
• South Korea: moved from assembly to innovation and exports of technology.
• Policy challenge: Capturing more value through skills, innovation, and infrastructure while staying
open to trade and FDI.
Why Market integration matters
A. Quantities: The Structure of Economies and of Political Power Shifts:
Increasing integration of markets results in a reallocation of economicactivities across and within countries
B. Relative Prices of Goods in the Home Countries Change as Well.
For example, the price of manufactured goods has declined in relative terms (in the US). In response, the size of the domestic manufacturing sector has declined.
Prices of services, relatively, have remained high, and the size of the service
C. The Prices People receive for their Labor and Assets Changes:
The real source of concern over globalization is that one of the most important prices in
the economy is the price of labor.
Complete globalization implies that (eventually) the same quality of labor—labor with the
same skill level—should receive the same wage anywhere in the world.sector has increased.
Globalization Crises
20 years of strain on the institutional foundations of Globalization
A short list of recent crises includes:
1. Global Financial Crisis (2008-2010)
2. Eurozone Debt Crisis
3. Refugee Crisis in Europe
4. U.S. – China Trade War (2018- )
5. COVID-19 Pandemic and Economic Recession (2020-23)
6. Russian Invasion of Ukraine and Destabilization of Global Energy Markets
7. Israel-Gaza War (2023- )
Global Politics for a Globalized Economy
(Dervis & Conroy 2018)
Markets Outpace Borders
• Capital, talent, and supply chains now allocate globally, limiting the reach of purely national policy.
•Legitimacy Gap
• WTO/IMF-style bodies shape rules, but voters see them as distant and elitist → populist backlash.
•Rodrik’s Trilemma
• Deep globalization, national sovereignty, and full democracy can’t all coexist; choices are inevitable.
•Regulatory Divergence
• U.S. leans unilateral/protectionist; EU uses market size to export rules (GDPR, antitrust).
•Needed Reforms
• Stronger, more democratic global institutions (e.g., global competition & tax authorities) and local leaders
who can explain global-rule benefits at home.
The Middle Income Trap
any developing economies grow quickly in their early stages of industrialization.
• This growth is driven by large investments, cheap labor, and the reallocation of workers from agriculture
into higher-productivity sectors.
• Eventually, these easy gains diminish as wages rise and productivity growth slows.
• During the 1980s and 1990s, several countries entered long periods of slower expansion after
reaching middle-income levels.
• Their industries became less competitive, and upgrading toward innovation-based growth proved
difficult.
• Scholars labeled this dynamic the “middle income trap.”
• Yet, in the 2000s, a different trend emerged.
• Many middle-income economies experienced renewed growth, improved macroeconomic
management, and deeper participation in global markets.
• Their performance often matched or exceeded that of low- and high-income groups.
(not proven to exist)
Early growth ( Larson reading)
Early growth comes from cheap labor, basic tech adoption, and shifting labor from low- to high-
productivity sectors.
• As rural labor shrinks and wages rise, factor accumulation loses steam.
• Countries risk being “squeezed”:
• Too expensive to compete with low-wage economies
• Not advanced enough to compete with high-income economies
Debate: Some evidence questions if the “trap” exists; many countries continue to see steady per
capita income growth.
Migration: Global Income inequality
Massive Global Inequality in Wages
• A worker’s productivity (and wage) depends more on where they work than on who they are.
• The same person doing the same job earns 5–10× more in a rich country than in a poor one.
• This wage gap reflects differences in institutions, infrastructure, and capital, not individual skill.
Trillion-Dollar Opportunity
Michael Clemens (NBER): allowing just 5% of workers from developing countries to move could raise world GDP
by 50–100% — more than removing all remaining trade and investment barriers combined.
• Migration reallocates labor from low-productivity to high-productivity environments → creates global efficiency
gains.
why people move
These enormous income differences create powerful incentives for migration.
• The chart below (Branko Milanovic) shows how even middle-income workers in India or Brazil rank far below low-
income workers in the U.S. globally — explaining the economic pull of migration.
• Migration isn’t just a social issue — it’s one of the most powerful engines of global growth. The barriers keeping
workers in poor countries trap trillions in lost income and productivity.
Demographic imbalances: Diverging Population Trends
Advanced economies (Japan, Italy, Germany) face rapid population aging and shrinking workforces.
• Developing regions (Africa, South Asia) are experiencing youth booms, adding hundreds of millions of new workers.
Demographic imbalances: Economic pressures in advanced economies
Fewer workers mean slower growth, lower productivity, and falling tax bases.
• More retirees mean rising costs for pensions, healthcare, and welfare systems.
• Example: Japan’s working-age population has fallen by over 10 million since 2000, straining fiscal sustainability.
demographic imbalances: migration as a pressure valve
Labor mobility can rebalance global demographics: young workers from developing countries fill labor gaps in
aging societies.
• Without migration, rich countries may face existential fiscal crises as dependency ratios soar
More income More migration (to a point)
Migration Increases with Development
• The poorest people usually can’t afford to migrate — it’s costly to move.
• As income rises, aspirations and resources to migrate increase.
• People begin seeking better opportunities abroad, especially young, educated workers
The Migration Hump
The “Migration Hump”
• Emigration rates rise sharply as countries move from low to middle income (≈ $2,000 – $8,000 per capita).
• Beyond this point, as wages and local opportunities improve, emigration declines.
• Example:
• Mexico (1990s) → High migration peak.
• Now, as income rose, net migration to the U.S. has fallen.
• Economic development initially fuels migration — it doesn’t stop it.
Only when countries reach higher levels of income and stability does migration slow naturally.
Migration 3 effects
Social & Economic Assimilation: Migrants tend to assimilate successfully over time — economically, linguistically, and socially.
• Upward Mobility: Immigrants generally show higher intergenerational mobility than native-born white
Americans, reflecting strong incentives for educational and economic advancement.
• Crime & Integration: Immigrants consistently have lower incarceration rates than native-born white
Americans.
Migration and Trade Links
Migrants act as economic bridges—reducing information asymmetries, building trust, and promoting business networks (Rauch & Trindade, 2002).
• Vietnam Case Study (Vézina & Parsons 2014):
• After the U.S. lifted its embargo in 1994, states with larger Vietnamese populations exported more to Vietnam.
• A 10 % rise in the Vietnamese population → ≈ 2 % increase in exports.
• Strongest effect in differentiated goods, where trust and information are key.
Political Shift:
• Regions in Eastern Europe with higher emigration to Western Europe saw declining support for Communist and
populist parties, reflecting changing political preferences and exposure to democratic norms.
Arguments against immigration (voters) (perceived costs)
Competition for low-skill jobs (wage pressure).
• Strain on housing, services, and welfare systems.
• Cultural integration and crime concerns (often racialized).
• Short- vs. long-run effects: Sudden inflows (e.g., Mariel boatlift) can hurt some groups short-term, though overall gains emerge long-term.
• Political backlash: Immigration becomes a wedge issue; populists exploit fears despite evidence of net benefits.
• Policy tension: Rich countries need immigrants (e.g., 1/3 of U.S. construction workforce foreign-born) but lack coherent immigration systems.
Arguments for immigration (economists)
Huge productivity gains: Moving workers from low- to high-opportunity countries raises wages 500–1000% (Clemens’ “trillion-dollar bills on the sidewalk”).
• Aggregate growth: Immigration expands national output, complements native labor, and boosts productivity.
• Fiscal effects often understated: Taxes on capital income generated by immigrant labor are usually ignored—when included, fiscal contributions are positive at all skill levels.
• Historical perspective: Immigration levels (% foreign born) are not dramatically higher than 100 years ago; what changed is the composition (more from Latin America, Asia, Africa). Immigrants tend to assimilate on average
Climate Change and Globalization: Emissions Link
The rapid expansion of global trade, production, and consumption since the 1980s has increased greenhouse gas (GHG) emissions.
•Industrial relocation to emerging markets expanded total global output, often with weaker environmental oversight.
Climate Change and Globalization: Transportation and Supply chains
•Global shipping and aviation networks have grown exponentially, raising CO₂ and methane emissions.
•Complex supply chains mean emissions are “embedded” in traded goods: e.g., Europe’s consumption includes carbon produced in China
Climate Change and Globalization: Shared responsibility Dilemma
•Advanced economies have historically emitted the most, yet developing nations now drive marginal increases.
•Raises the question: Who bears the main cost of mitigation those who caused past damage or those currently growing?
Globalization has intertwined economic growth and emissions so deeply that climate action now requires international coordination and fairness mechanisms.

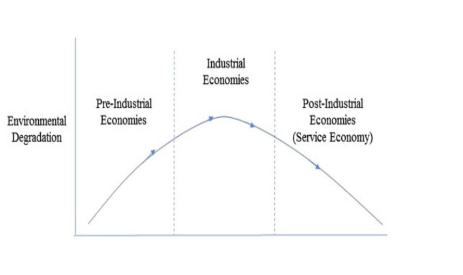
Kuznets Curve: definition and logic
•The EKC suggests an inverted U-shaped relationship between per capita income and environmental degradation.
•At low-income levels, pollution grows with industrialization.
•After reaching a certain income threshold (“turning point”), richer societies prioritize cleaner technologies and environmental protection.

Kuznets Curve: Drivers
•Early growth depends on resource extraction and manufacturing.
•Rising income fosters environmental awareness, technological efficiency, and stronger institutions.
•Environmental regulation and innovation lower pollution in post-industrial phases.
Kuznets Curve: empirical evidence
•Observed in air pollutants (SO₂, particulate matter), but less consistent for CO₂ and biodiversity loss.
•The “turning point” varies widely depending on governance quality, technology, and inequality.
The New Trilemma 3 Pieces
The New Trilemma:
1. Climate Change Mitigation: Decarbonization to prevent planetary collapse.
2. Middle-Class Prosperity: Protecting workers and industries in advanced economies.
3. Global Poverty Reduction: Supporting growth in the developing world.
Policy Tradeoffs: Rodriks Trilemma
Climate + Middle Class: Protects green jobs in rich countries but limits export-led growth in poor nations.
• Climate + Poverty Reduction: Promotes equity but can harm manufacturing jobs in developed economies.
• Middle Class + Poverty Reduction: May ignore climate urgency, sustaining fossil-fuel dependence.
Rodrik’s Argument: Green protectionism (e.g., subsidies, tariffs) risks deepening global inequality.
The transition must be managed to ensure climate justice—not just carbon reduction.
A service-led green economy can balance prosperity, inclusion, and sustainability—addressing all three corners of Rodrik’s trilemma.
Exchange Rates
Exchange rates and currency values are inverses of each other.
Exchange rates are often written as the foreign-currency cost of 1 USD.
exchange is what it takes to buy one of the dollar you are going to. eg 167 yen for 1 usd
Appreciation = currency value increases (strengthens).
Depreciation = currency value decreases (weakens).
Use value, not exchange rate, to calculate percentage change.
Formula: (new value – old value) / old value
Example: Peso rises from $0.05 to $0.06 → 20% appreciation.
What is Balance of Payments
Record of all international transactions between a country and the world.
• Identity: Current Account + Capital/Financial Account = 0.
• A country must sell goods or sell assets to pay for imports.
What is a Balance of Payments current account?
Goods & services trade (exports = credit, imports = debit).
• Investment income (earnings on foreign assets).
• Transfers (remittances, aid).
• CA Surplus: country is a net lender; foreign asset position rises.
• CA Deficit: country is a net borrower; must attract capital inflows.
What is Balance of Payments: Financial Capital Accounts?
FDI, portfolio flows, loans, remittances, official reserves and foreign aid.
• Inflow (+): foreigners buy domestic assets (finances CA deficit).
• Outflow (–): residents buy foreign assets.
Persistent deficits = persistent dependence on foreign capital.
Global Patterns, Surpluses/Deficits & Exchange Rates: Long Run Patterns
Example surplus countries: Germany, China.
• Example deficit countries: U.S., Turkey, Kenya, Lebanon.
• U.S. CA deficit persistent since 1970s due to strong dollar, asset demand, high consumption.
Global Patterns, Surpluses/Deficits & Exchange Rates: Central Bank Interventions
Buy foreign assets → reserves ↑ → prevent appreciation.
• Sell foreign assets → reserves ↓ → prevent depreciation.
• Whenever reserves change, they appear in the financial account
Global Patterns, Surpluses/Deficits & Exchange Rates: Exchange rate connections
Exchange rate connections
• Capital inflows → appreciation.
• Capital outflows → depreciation.
• Balance-of-payments pressure shows up first in the FX market.
CA and FX markets are deeply linked through capital flows and reserves.
Who Benefits when the currency appreciates ?
Consumers: imported goods become cheaper → higher real purchasing power.
• Firms relying on imported inputs: lower production costs.
• Travelers & students abroad: stronger buying power.
Who Loses When the Currency Appreciates?
Exporters: products become more expensive abroad → reduced competitiveness.
• Import-competing industries: domestic goods become less attractive → job losses.
• Agriculture & manufacturing: often most exposed to “overvaluation.”
Who Benefits When the Currency Depreciates?
Exporters: goods become cheaper abroad → higher sales.
• Tourism sector: becomes more attractive to foreigners.
• Domestic substitute industries: more competitive versus imports.
Who Loses When the Currency Depreciates?
• Consumers: inflation in imported food, medicine, electronics.
• Urban poor: hardest hit by higher cost of essentials.
• Firms with foreign-currency debt (especially USD): repayment burden spikes → crises.
Political Consequences of Exchange Rates
FX movements reshape coalitions (exporters vs. consumers).
• Governments may respond with:
• Tariffs, quotas, industrial policy
• FX market intervention
• Capital controls
• Large depreciations often trigger social unrest, subsidies, or emergency stabilization programs.
• Exchange rate movements are not just macro events — they are distributional shocks with political consequences.
What Causes BOP Crises ? Immediate triggers
Sudden capital outflows (“sudden stop”).
• Falling reserves while defending an exchange rate.
• Unsustainable external debt (especially in foreign currency).
• Global shocks: rising U.S. interest rates, commodity crashes.
What Causes BOP Crises? Crisis Mechanics
Investors pull money.
• Capital account collapses.
• CB burns reserves to defend currency.
• When reserves hit the limit → sharp devaluation, inflation, recession, often default
What causes BOP Crises? Policy Options in crisis
Spend reserves
• Depreciate currency
• Austerity (collapse imports)
• Borrow from IMF
• Default
Examples
• Latin America 1980s, Mexico (1994–95), East Asia (1997–98), Russia (1998), Argentina (2001), Eurozone (2010–15).
Crises occur when a country cannot finance its external obligations at current exchange rates.
How BoP, FX, Crises & Policy Interact
A CA deficit must be financed
• By capital inflows or selling reserves.
• If financing evaporates → depreciation pressure → crisis risk rises.
Exchange rate is the shock absorber
• Appreciation = easy capital inflows.
• Depreciation = capital flight, reserve loss, rising debt burdens.
Reserve changes are policy signals
• Rising reserves → CB preventing appreciation (export competitiveness).
• Falling reserves → CB defending peg or currency value.
Crisis warning signs
• Rapid reserve loss
• CA deficits financed by short-term debt
• FX pegs with low credibility
• High dollar-denominated liabilities
• Rising global interest rates
IMF as backstop—but not a panacea
• Provides liquidity, demands adjustment.
• Effectiveness depends on politics, credibility, and domestic reforms.
• IMF demands Reforms from countries
Balance of Payments ≠ accounting exercise.
It is the central framework to understand currency movements, financial crises, sustainability of growth, and the global financial architecture.
Purchasing Power Parity (PPP): What It Is and Why It Matters
PPP measures how much local currency is needed to buy the same basket of goods in different countries.
Why exchange rates mislead:
• Exchange rates reflect international tradable prices, not local costs.
• Many goods people consume daily (rent, services, domestic food) are not traded globally.
Example:
• A haircut or taxi ride is 10x cheaper in India or Kenya than in the U.S., but the exchange rate does not reflect this.
Why economists prefer PPP for welfare comparisons:
• Gives a more realistic picture of living standards.
• Used for global poverty lines (e.g., $2.15/day PPP).Reduces distortions caused by currency volatility.
• More stable across time than nominal exchange rates.
Resource curse: Definition
Countries rich in natural resources often grow slower (e.g., Gabon, Zambia, Venezuela) than resource-poor success stories (China, Korea).
Resource Curse: Economic component
Dutch Disease
• Resource boom → foreign currency inflow → currency appreciates
• Non-resource exports become uncompetitive → manufacturing shrinks
• Leads to deindustrialization and low diversification
Dutch Disease
Dutch Disease is an economic concept that describes how a boom in one sector—usually natural resources like oil, gas, or minerals—can hurt the rest of a country’s economy, especially manufacturing.
1. A resource boom happens
Examples: oil discovery, surge in commodity prices, major new mining operation.
2. Lots of foreign money flows in
Foreign companies buy the resource, boosting demand for the country’s currency.
3. The currency appreciates (gets stronger)
This makes the country’s other exports more expensive to foreign buyers.
4. Manufacturing & other tradable industries suffer
Because their goods are now pricier, they lose competitiveness and may shrink or disappear.
Resource Curse: Political Component
Revenues reduce need for taxation → less accountability
• Leaders use resource wealth to buy loyalty, fuel corruption
• Creates incentives for conflict (as noted by Collier’s “Bottom Billion”)Graph (pp. 17–18):
• Countries with high resource shares systematically grow less.
Resources are not destiny—institutions determine whether a boom becomes a curse or a development engine.
When Foreign Aid can act as a Resource Curse
Foreign aid can generate rent-like distortions similar to natural resource windfalls — but through political incentives, not commodity exports.
How Aid Creates Governance Risks (Distinct from natural resources)
Accountability gap: Governments rely on donors instead of taxpayers → weak fiscal capacity, weaker social contract.
• Patronage reinforcement: Leaders use aid-funded budgets to strengthen political networks rather than institutions.
• Volatility vulnerability: Sudden aid suspensions trigger crises in countries dependent on external financing.
• Crowding-out effect: State capacity, bureaucratic development, and domestic revenue systems may stagnate.
When Aid Fuels Underdevelopment:
Acts like an exogenous flow of easy money → encourages short-term spending rather than structural reforms.
• Can weaken incentives for export diversification or private-sector growth.
Mozambique’s Aid Dependency Crisis:
• For years, ~50% of the government budget came from foreign aid.
• Aid dependence allowed corruption networks to expand (e.g., the “hidden debt” scandal).
• Once donors suspended support, the economy fell into fiscal crisis → default, inflation, fall in public investment.
• Demonstrates how aid rents can amplify institutional weaknesses, not strengthen them.
Aid is not inherently harmful, but in weak institutional settings, it can behave like a resource curse
What Is Foreign Aid & Why Countries Give It
Foreign aid = transfers of money, expertise, or goods to support development, crisis response, or political goals.
• Main forms: development aid, humanitarian relief, military/security aid, technical assistance.
Why donors give foreign aid
Humanitarian motives
• Geopolitical strategy (alliances, influence, competition with rivals)
• Economic interests (open markets, stabilize partners, resource access)
• Security (prevent state collapse, terrorism, migration pressures)
Aid is rarely purely altruistic — politics + economics drive allocation
Does Foreign Aid Work? Where?
Public health (vaccines, HIV, malaria nets)
• Education access
• Humanitarian emergencies
Foreign aid and Weak impact on long-run GDP growth
(growth ≠ money alone).
Why growth effects are limited:
• Weak institutions → poor implementation
• Corruption and rent-seeking
• Donor fragmentation & volatile funding
• Aid can crowd out domestic effort (taxation, governance).
Aid saves lives but rarely transforms economies.
Purchasing Power Parity (PPP): What It Is and Why It Matters
PPP measures how much local currency is needed to buy the same basket of goods in
different countries.
Why exchange rates mislead:
• Exchange rates reflect international tradable prices, not local costs.
• Many goods people consume daily (rent, services, domestic food) are not traded globally.
Example:
• A haircut or taxi ride is 10x cheaper in India or Kenya than in the U.S., but the exchange rate
does not reflect this.
Why economists prefer PPP for welfare comparisons:
• Gives a more realistic picture of living standards.
• Used for global poverty lines (e.g., $2.15/day PPP).Reduces distortions caused by currency
volatility.
• More stable across time than nominal exchange rates.
The Kuznets Curve
Inequality follows an inverted-U as countries develop.
• Early stage: Industrialization → rural-urban migration → rising inequality.
• Later stage: Education, taxation, and social policy → falling inequality
The Kuznets Curve: Does it hold Real data?
• Early evidence (mid-20th century) seemed supportive but based on very limited data.
Modern cross-country data does not consistently show an inverted-U.
• Many rich countries still show high inequality (e.g., U.S.).
• Some middle-income economies have falling inequality (e.g., Brazil 2000s), contrary to the theory.
Technology, globalization, and policy differences shape inequality more than income level alone
• Advanced economies since the 1980s exhibit a renewed rise in inequality, opposite of Kuznets’ predicted decline.
Bottom Line
• The Kuznets Curve is a useful conceptual model, but not a universal empirical law.
• Real inequality trends depend heavily on institutions, policies, and global economic forces
Global Trends
Trade liberalization: cheaper goods for consumers, export opportunities, productivity gains... but benefits depend on domestic institutions and complementary policies (infrastructure, credit, labor mobility).
• FDI can raise wages and upgrade skills, but effects are heterogeneous: depends on location advantages,
human capital, and sector.
• Uneven gains: Middle-income countries like China & India benefited enormously; the poorest countries often
did not integrate.
• Why the divergence?
• Conflict & instability
• Weak governance / corruption
• Geography (landlocked)
• Resource curse when commodity revenues distort incentives
Globalization = potential engine of growth, but not a guarantee. Institutions determine who wins.
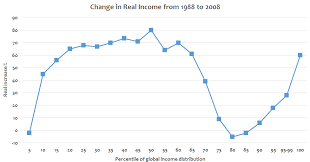
Elephant Graph
1. Big gains for the global middle class
Income growth was strongest around the 40th–60th percentiles, mostly people in China, India, Southeast Asia, etc.
These groups benefited heavily from globalization, manufacturing jobs, and economic development.
2. Stagnation for the working class in rich countries
Around the 70th–90th percentiles, income growth was much lower.
This represents lower- and middle-income workers in the U.S., Europe, Japan, who lost manufacturing jobs or saw wages stagnate.
This dip is one of the most important features:
→ It reflects why many people in rich countries felt “left behind.”
3. Massive gains for the global super-rich
At the very top (the top 1%), incomes shot up dramatically — the “elephant’s trunk.”
Globalization lifted hundreds of millions out of poverty
The global rich became much richer.
Many middle-class workers in wealthy countries saw almost no income growth
Inequality within countries rose, even while global inequality fell
How should we measure welfare?
Start with access to economic resources
– consumption or income
• At the national level: GDP and GDP per capita
– GNI
• Growth in GDPpc: changes in average living
standards
• Other options exist...
– HDI, “happiness”, environmentally-weighted GDP
Walmart & Retail chain entry into mexico
Entry of foreign supermarkets into Mexican municipalities lowered consumer prices for many goods.
Panel A (graph 1):barcode-level prices fall immediately after entry.
Total welfare gains skewed toward richer households (graph 2).
•Rich households consume more varieties and travel less for shopping.
Winners
•Consumers benefiting from lower prices
•Regions gaining more product variety
•Higher-income households (larger proportional gains)
Losers / Costs
•Local “mom-and-pop” stores face tougher competition → exit
•Retail labor market shifts; mixed results for workers
Globalization increases efficiency but creates distributional consequences—even within communities.
Underlines need for adjustment policies.
The Obsolescing Bargain
Definition: When the bargaining power shifts from the
multinational to the host government after FDI is
committed.
• The host can change laws, expropriate, or impose new
taxes once the firm’s assets are immobile.
Stages
• Host offers concessions to attract FDI.
• Firm invests—creating sunk costs.
• Host tightens regulation or seizes control (“expropriation”).
Examples
• Carlsberg in Russia: assets seized by Kremlin.
• Próspera in Honduras: government reversed ZEDE law.
Global Production Networks and Value Chains
Definition: Interconnected production stages spanning multiple countries.
• Logic: Each country contributes where it has cost or skill advantages.
• Firm behavior:
• Keep high-value tasks (R&D, design, branding).
• Outsource low-value, labor-intensive stages (assembly, logistics).
• Country strategies:
• Bangladesh: entry through apparel assembly.
• Vietnam and Mexico: electronics and auto components.
• South Korea: moved from assembly to innovation and exports of technology.
• Policy challenge: Capturing more value through skills, innovation, and infrastructure while staying
open to trade and FDI.