sampling and statistical theory
1/34
There's no tags or description
Looks like no tags are added yet.
Name | Mastery | Learn | Test | Matching | Spaced | Call with Kai |
|---|
No analytics yet
Send a link to your students to track their progress
35 Terms
population
any complete group of interest
census
investigation of all the individual elements making yp the population a total enumeration rather than a sample
sample
subset of some larger population that is measured or observed in some way to infer what the entire population is like
statistic
to sample as parameter is to population
why we need a sample
cuts costs, reduces labor requirements, gathers vital info quickly
more accurate than a census
occurs in the process of the research project
provides the case against a census
sampling frame
a list of elements from which the sample may be drawn
stages in selection of sample
define target population
select sampling frame
determine if a probability or non-probability sampling will be used
plan procedures for selecting sampling units
determine sample size
select actual sampling units
conduct fieldwork
sampling frame examples
demographics (age, gender, income)
psychographics (attitudes towards a firm/brand, political affiliation)
geographic (city, state, country)
behavioral (purchase / online search behavior, social media usage)
random sampling error
statistical fluctuations that occur because of chance variations in the elements selected for the sample
systematic error
result from non sampling factors, primarily the nature of a study’s design and the correctness of execution
systematic error example
CNN conducted a poll on their website about electric vehicles. 68% preferred EVs over gas vehicles. They concluded that 68% of Americans preferred EVs over gas vehicles.
data processing error
made by administrator during data entry or coding or editing or tabulation or analysis stages
sample selection error
made by administrator in selecting sampling units
interviewer error
unintentionally made by administrator whle administering the interview / survey
interviewer cheating
deliberate manipulation by administrator while administering the interview / survey
measurement error
made by administration where he fails to communicate the scale of measurement (you are measuring satisfaction on a 7-point scale, but the respondent thinks you are using a 5-point scale)
acquiescence bias
aka agreement bias; when respondents tend to select a positive response option disproportionately
extremity bias
aka extreme response bias; the survey respondents answer questions with extreme views even if they don’t actually feel that way
social desirability bias
when respondents give answers to questions that they believe will make them look good to others, concealing their true opinions or experiences
probability sampling
every population element has a known, nonzero probability of selection
nonprobability sampling
probability of any member or the population being chosen is unknown
Assume there are 40 students in the class. I need to take a sample of 10 to determine their satisfaction with the course. Which of the following represents a convenience sample?
a) ask the 10 students who are near to me
b) ask the students who scored in the top
quartile (top 25 percentile)
c) ask the 5 girls and 5 boys who come first to class
d) ask a student and then ask him to refer another of his friends. Continue till we get 10 responses.
a
Assume there are 40 students in the class. I need to take a sample of 10 to determine their satisfaction with the course. Which of the following represents a judgemental sample?
a) ask the 10 students who are near to me
b) ask the students who scored in the top
quartile (top 25 percentile)
c) ask the 5 girls and 5 boys who come first to class
d) ask a student and then ask him to refer another of his friends. Continue till we get 10 responses.
b
Assume there are 40 students in the class. I need to take a sample of 10 to determine their satisfaction with the course. Which of the following represents a quota sample?
a) ask the 10 students who are near to me
b) ask the students who scored in the top
quartile (top 25 percentile)
c) ask the 5 girls and 5 boys who come first to class
d) ask a student and then ask him to refer another of his friends. Continue till we get 10 responses.
c
Assume there are 40 students in the class. I need to take a sample of 10 to determine their satisfaction with the course. Which of the following represents a snowball sample?
a) ask the 10 students who are near to me
b) ask the students who scored in the top
quartile (top 25 percentile)
c) ask the 5 girls and 5 boys who come first to class
d) ask a student and then ask him to refer another of his friends. Continue till we get 10 responses.
d
Assume there are 40 students in the class. I need to take a sample of 10 to determine their satisfaction with the course. Which of the following represents a simple random sample?
a) assign each student a number from 1-40.
Randomly select 10 numbers between 1-40.
b) assign each student a number from 1-40. After selecting the first number randomly select numbers at equal intervals till we reach a sample size of 10.
c) consider different groups. For example, male and female students. Select 5 female and 5 male respondents.
d) consider different groups. For example, male and female students. Select one group for example, female and ask 10 female students.
a
Assume there are 40 students in the class. I need to take a sample of 10 to determine their satisfaction with the course. Which of the following represents a systematic sample?
a) assign each student a number from 1-40.
Randomly select 10 numbers between 1-40.
b) assign each student a number from 1-40. After selecting the first number randomly select numbers at equal intervals till we reach a sample size of 10.
c) consider different groups. For example, male and female students. Select 5 female and 5 male respondents.
d) consider different groups. For example, male and female students. Select one group for example, female and ask 10 female students.
b
Assume there are 40 students in the class. I need to take a sample of 10 to determine their satisfaction with the course. Which of the following represents a stratified sample?
a) assign each student a number from 1-40.
Randomly select 10 numbers between 1-40.
b) assign each student a number from 1-40. After selecting the first number randomly select numbers at equal intervals till we reach a sample size of 10.
c) consider different groups. For example, male and female students. Select 5 female and 5 male respondents.
d) consider different groups. For example, male and female students. Select one group for example, female and ask 10 female students.
c
Assume there are 40 students in the class. I need to take a sample of 10 to determine their satisfaction with the course. Which of the following represents a cluster sample?
a) assign each student a number from 1-40.
Randomly select 10 numbers between 1-40.
b) assign each student a number from 1-40. After selecting the first number randomly select numbers at equal intervals till we reach a sample size of 10.
c) consider different groups. For example, male and female students. Select 5 female and 5 male respondents.
d) consider different groups. For example, male and female students. Select one group for example, female and ask 10 female students.
d
proportional stratified sampling
the number of samples taken from each subgroup (stratum) reflects its actual size in the population, ensuring accurate representation
disproportional stratified sampling
sample sizes from each stratum are not in line with their population sizes, often oversampling smaller or more important subgroups to give them greater focus
multistage area sampling
a cluster sampling approach involving multiple steps with a combination of multiple probability techniques
a computation of sample size requires
Required degree of precision
Desired level of confidence
Estimate of population variability
number of sample elements (sample size) required to achieve a given precision at a specified confidence is
N=Z² * S² / D²
z= confidence (90% ~1.6, 95% ~2, 99% ~2.6)
s= estimated population variance
d= precision
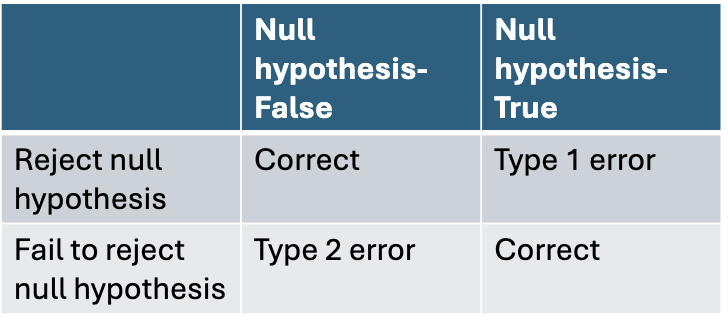
type 1 and type 2 errors