AQA A Level Bio 2.2 Cell Cycle Including Mitosis
1/59
Earn XP
Description and Tags
Name | Mastery | Learn | Test | Matching | Spaced |
|---|
No study sessions yet.
60 Terms
Meiosis occurs during the life cycle of organisms. What is the importance of meiosis (2)
Haploid has half the chromosome(1)
Full number restored at fertilization (1)
Describe two events during interphase which prepare a cell for mitosis (2)
DNA replicate (1)
Increase in cytoplasm (1)
A sample of epithelial tissue from the small intestine of an animal was analysed. Some of the cells has 8.4 units of DNA, others had only 4.2 units
Use your knowledge of the cell cycle to explain why some cells has 8.4 units of DNA and others had only 4.2 units (2)
8.4/cells with twice DNA content - replicated DNA
4.2 = DNA not replicated (1)
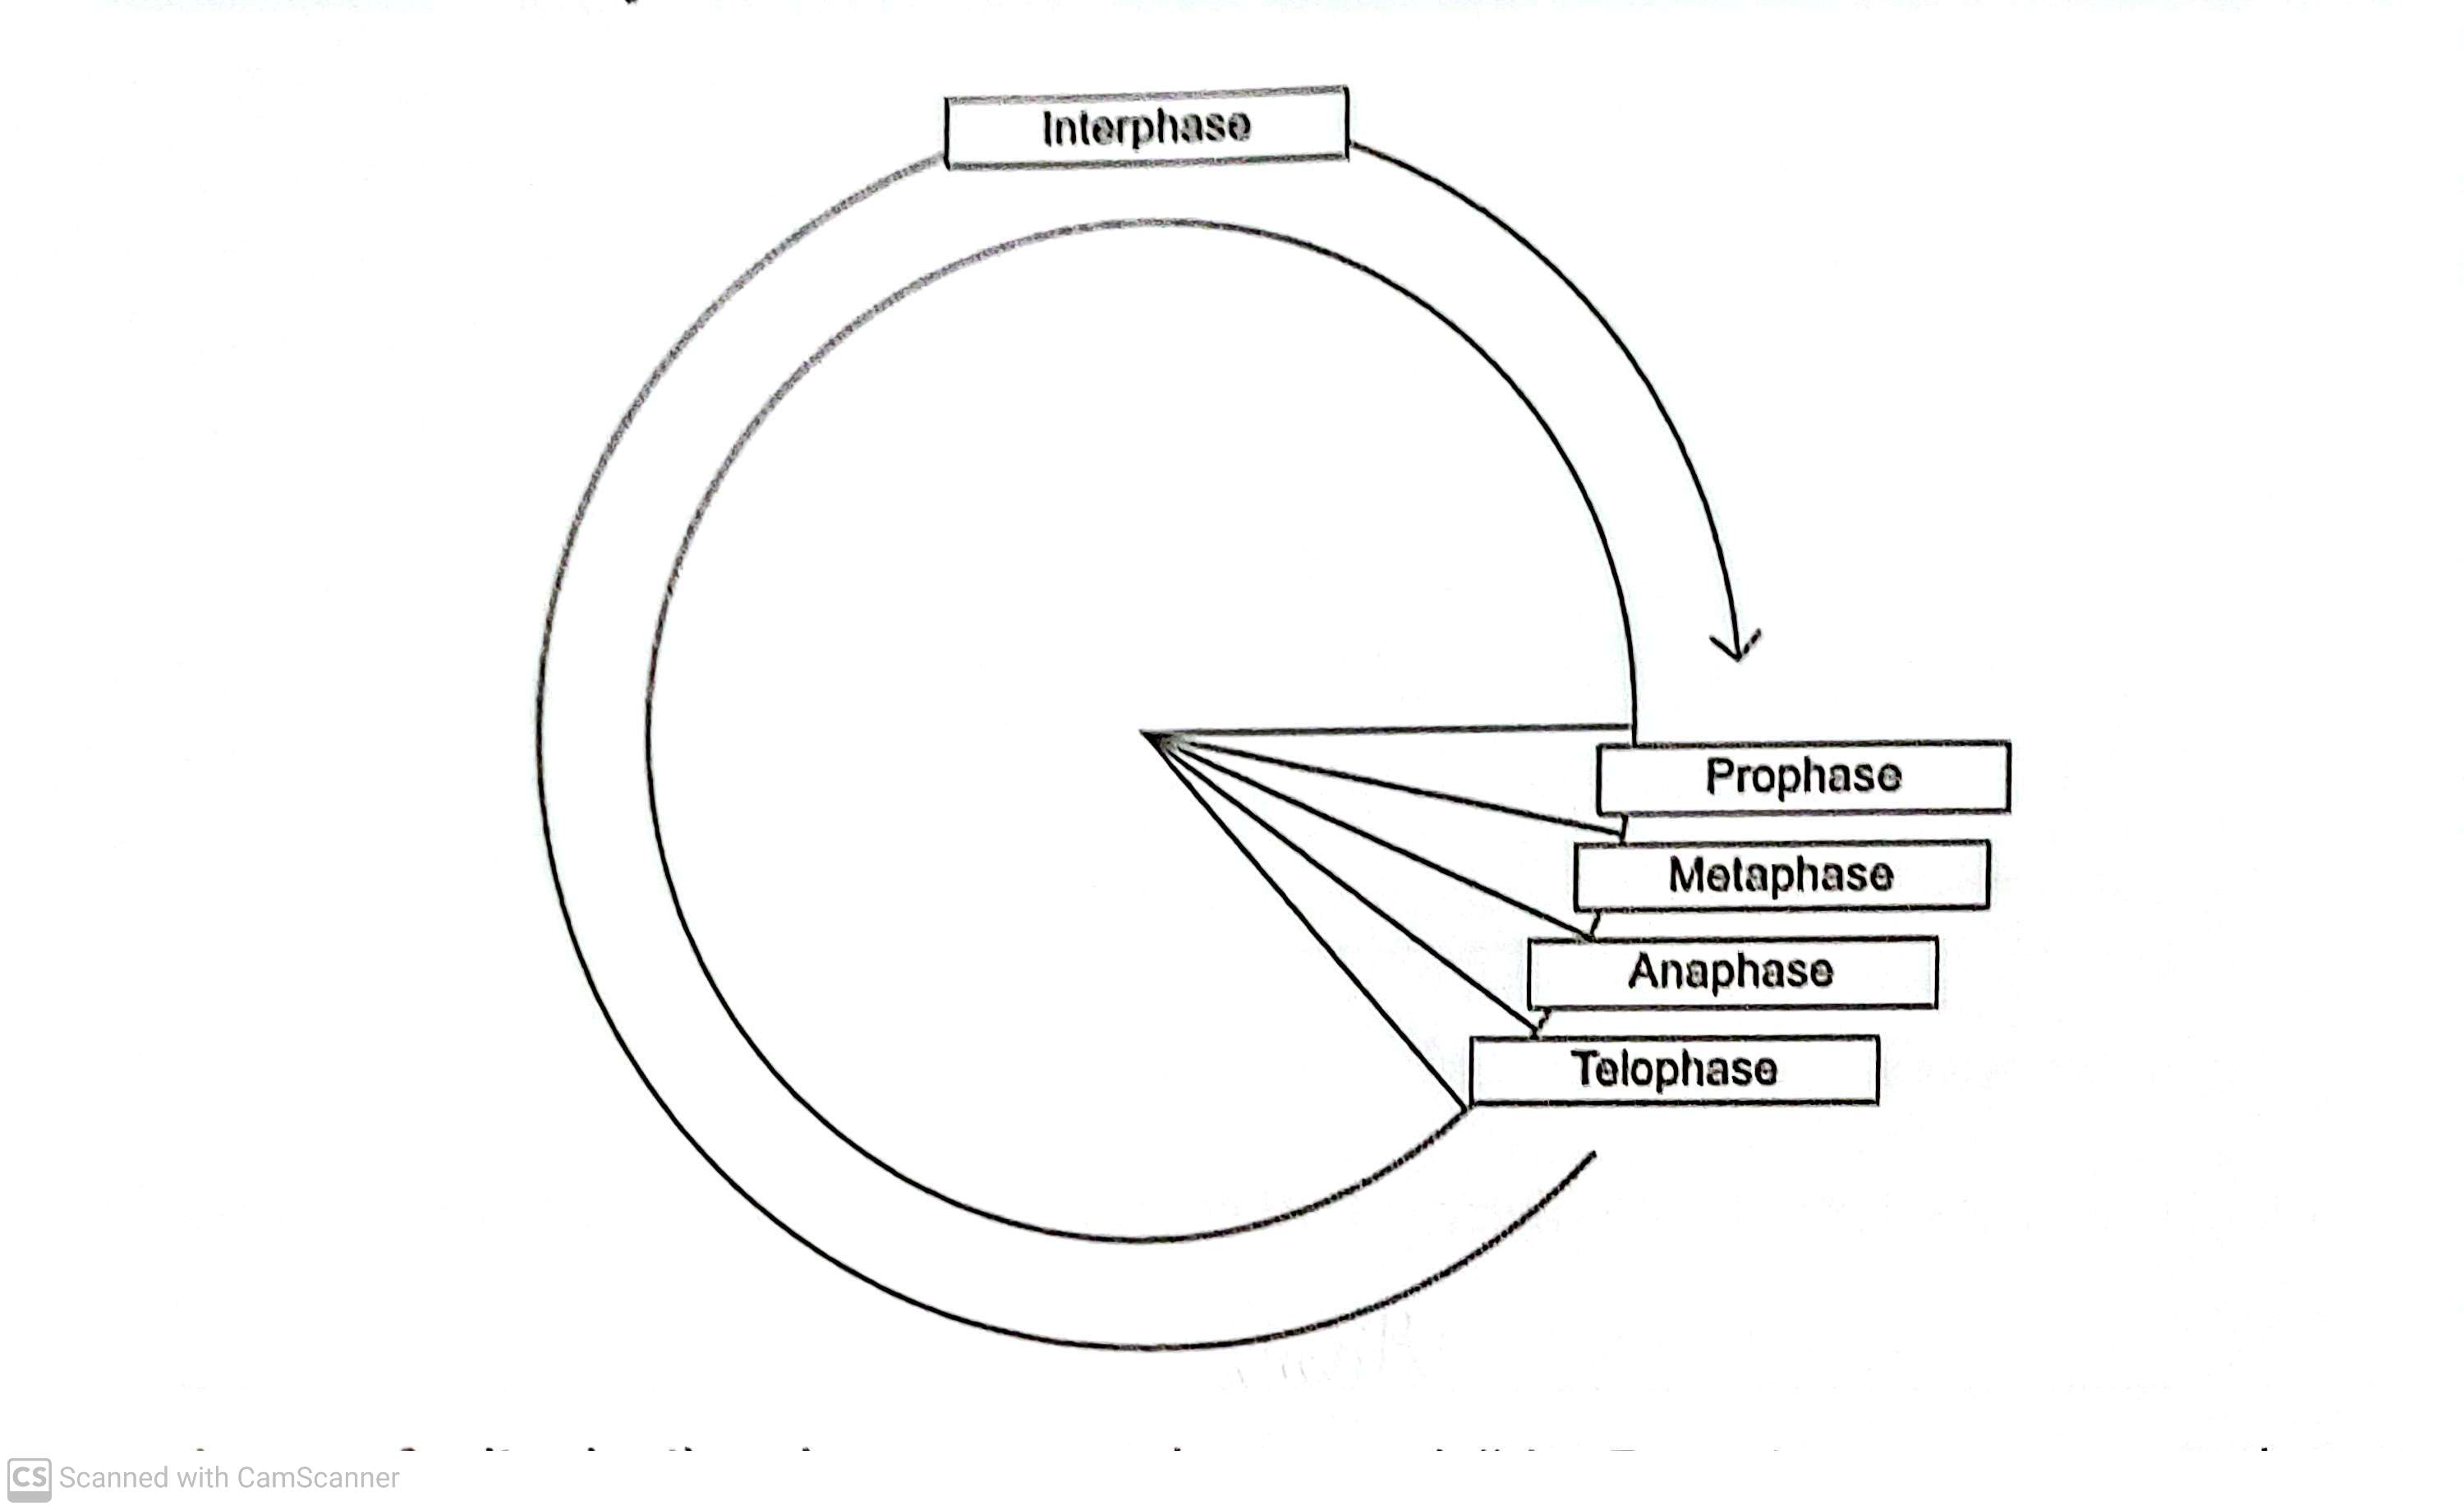
In prophase of mitosis, the chromosomes become visible. Describe what happens in
Metaphase
Anaphase (4)
Metaphase- chromatids attached to spindle (1)
Its spindle fibres organize chromosomes to line up across the equator (1)
Anaphase- chromatids are pulled to opposite poles (1)
Centromeres divide (1)
Cells lining the human intestine complete the cell cycle in a short time. Explain the advantage of these cells completing cell cycle in a short time (1)
Replace cells quickly (1)
The time required for a cell to complete the cell cycle was 4 hours 18 minutes.
Calculate the time required in minutes for this cell to multiply to produce eight cells (2)
258×3 = 774(2)
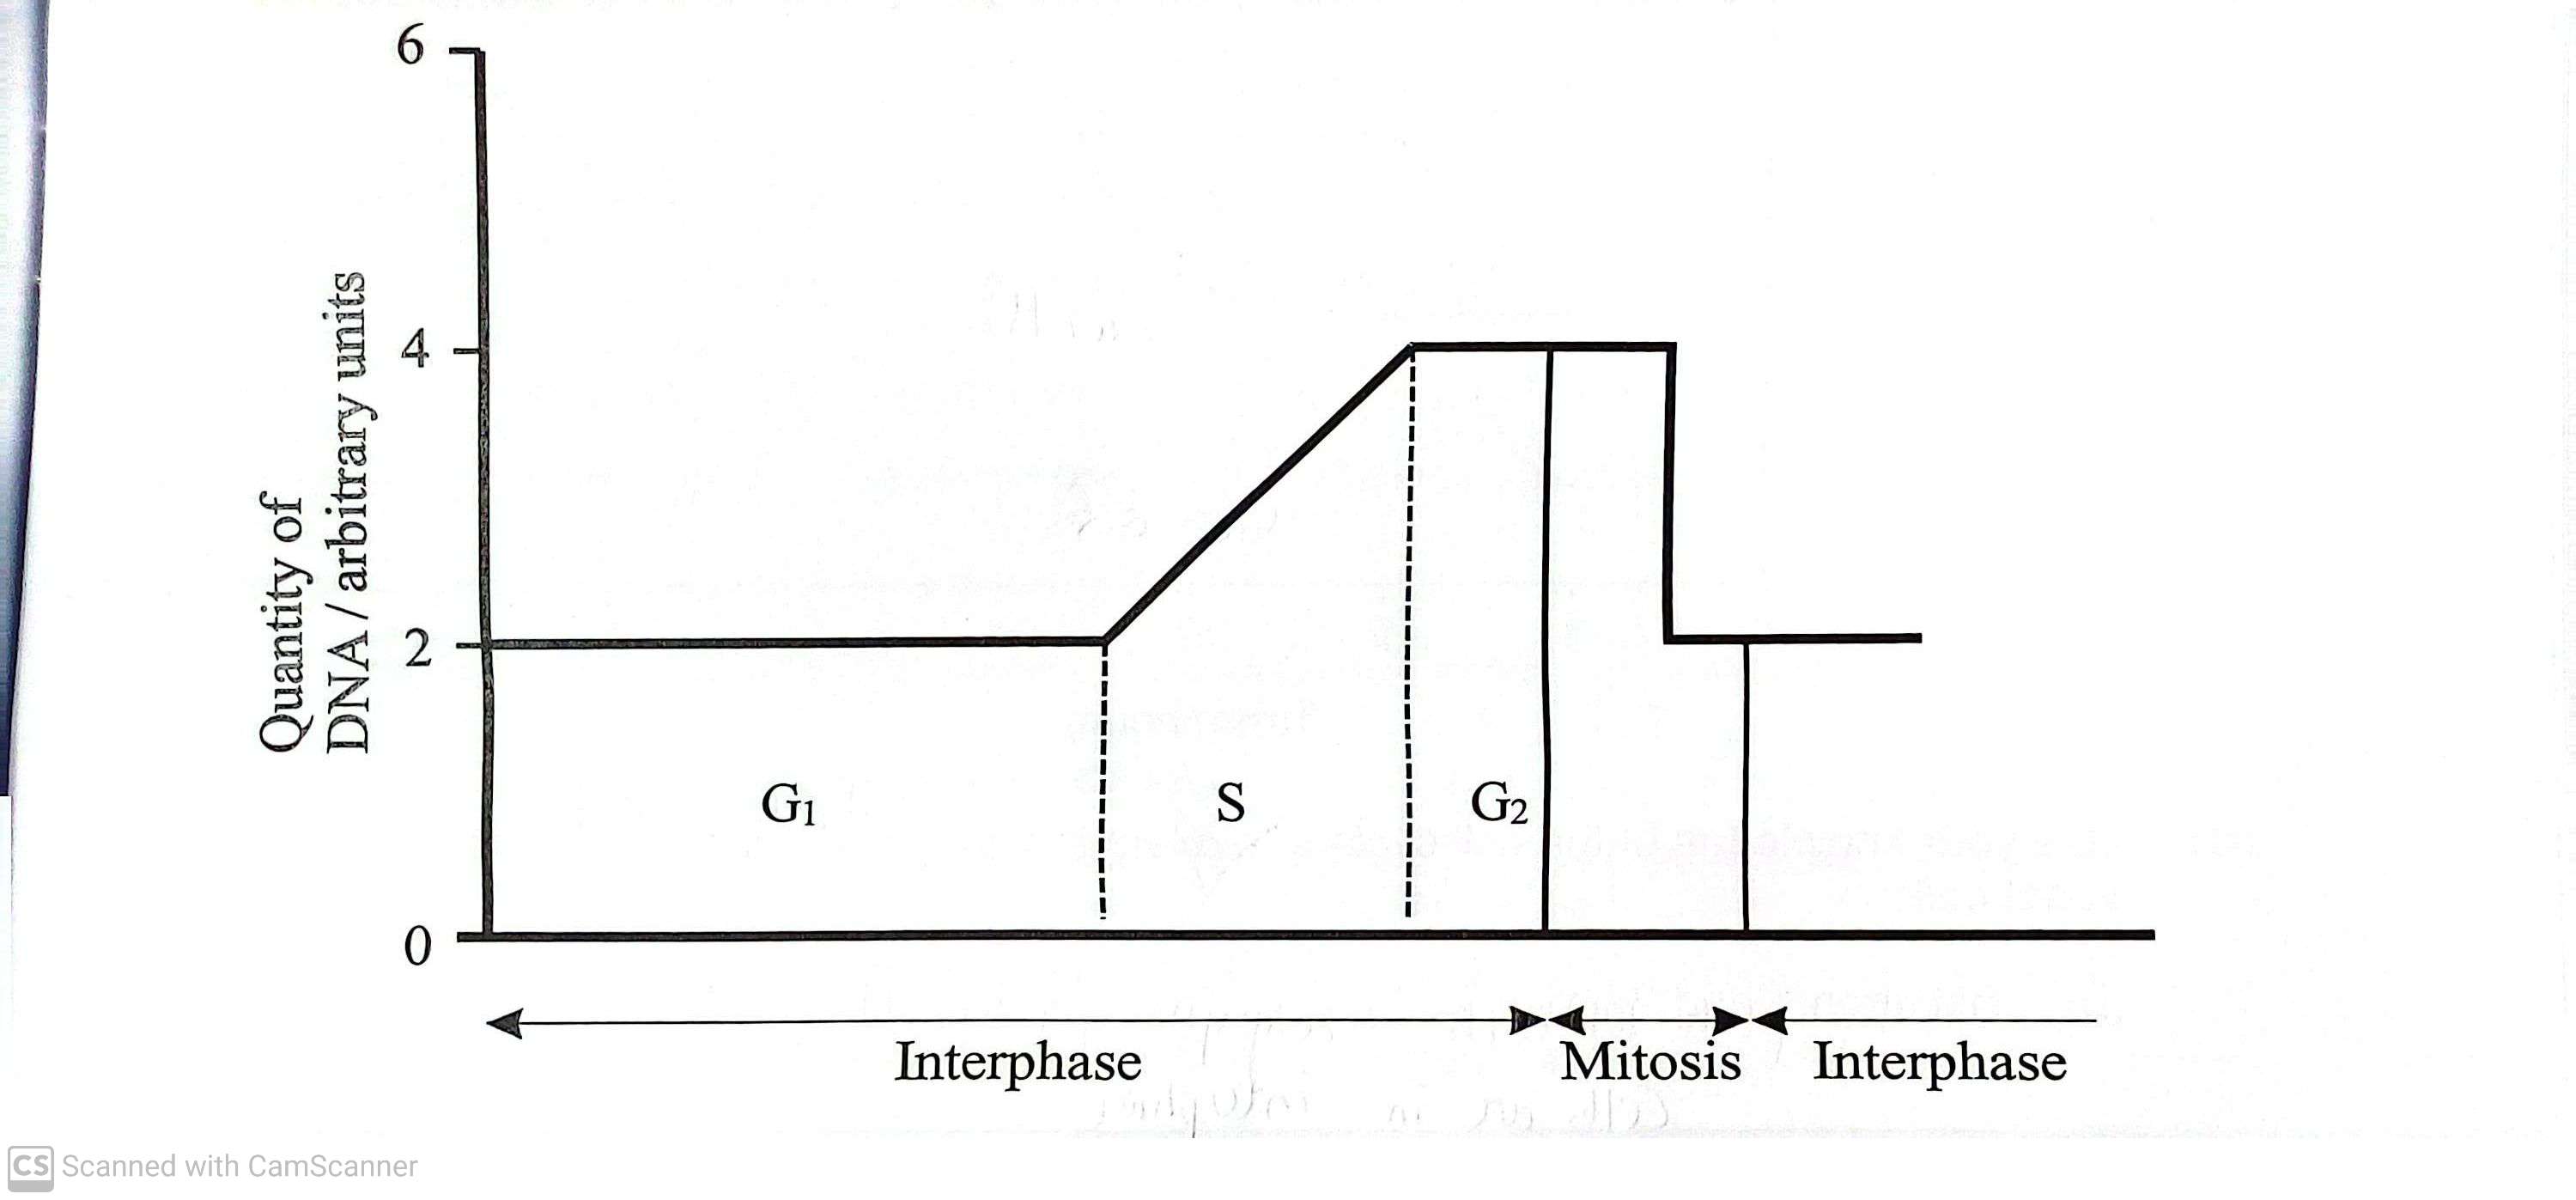
The graph below shows how the quantity of DNA, measured in arbitrary units, varies with time during different phases of the cell cycle in an animal cell
Interphase is made of two growth phases, G1 and G2 separated by an intermediate phase,S
Explain what is happening within the cell during phase S (2)
DNA is replicated (1)
It doubles from 2 to 4 units (1)
State one process other than cell growth which occurs during phase G2 (1)
Proteins made (1)
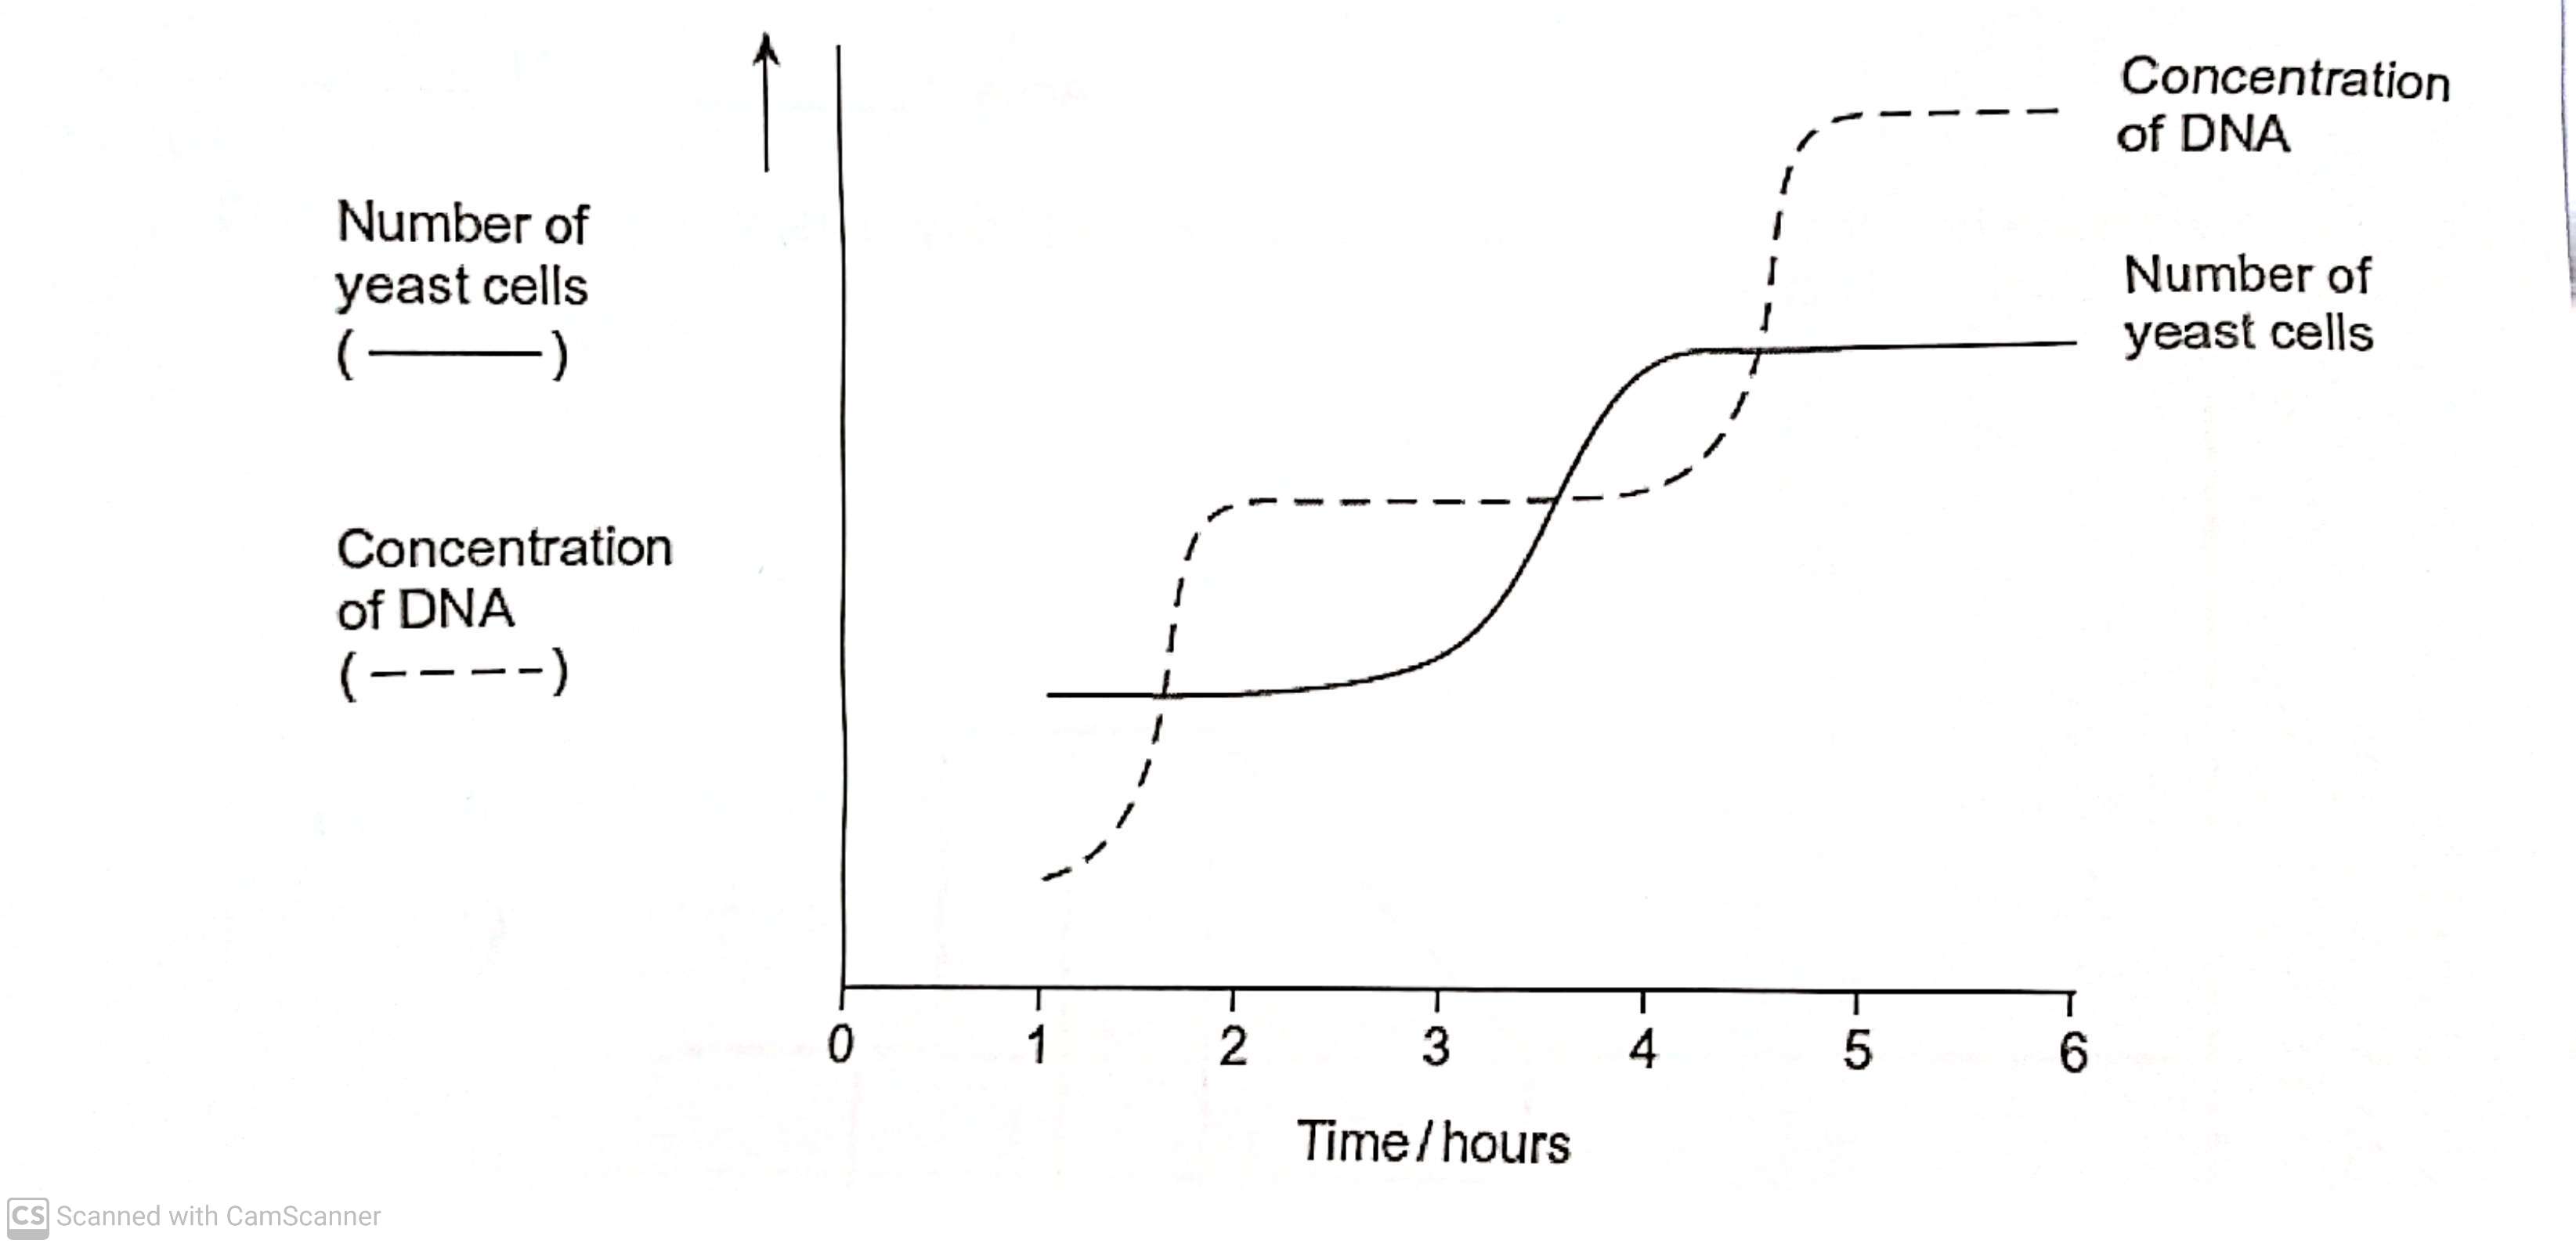
Use the curve for the concentration of DNA to find the length of a cell cycle in these yeast cells. explain how you arrived at your answer (3)
Length of cell cycle - 3 hours (1)
Explanation - time between beginnings DNA replication (1)
DNA replication takes place once per cell cycle (1)
Describe how viruses are replicated. (4)
(Virus) attachment protein attaches to cell receptors (1)
(Viral) genetic material/DNA/RNA enters into cell (1)
(Viral) genetic material/DNA/RNA replicated (in cell) (1)
(Viral protein is produced (1)
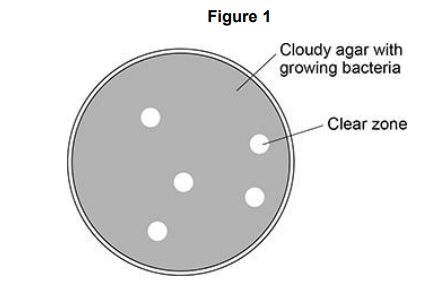
A scientist investigated the effect of a virus species on a bacterial culture. The scientist:
• mixed a diluted sample of the virus with a bacterial culture in liquid agar • poured the liquid agar into a Petri dish and let the agar set
• incubated the virus-bacterial culture at 30 °C for 24 hours.
Figure 1 shows the appearance of the Petri dish after 24 hours.
Explain why clear zones are present in Figure 1. (1)
Virus (replication has) killed bacteria/cells (in clear zones) (1)
Describe the appearance and behaviour of chromosomes during prophase and during anaphase of mitosis. (4)
(in prophase)
1) Chromosomes/chromatids condense
2) Chromosomes attach to spindle fibres
(in anaphase)
3) Chromosomes/chromatids moved/pulled to opposite poles
4) Centromeres divide/split
Complete the word equation used to determine mitotic index (1)
Mitotic index = The number of cells in mitosis/total number of cells (in field of view) (1)

A scientist used an optical microscope to determine the mitotic index in cells at different distances from the tip of onion roots. The graph below shows the results.
The scientist used data from the graph above to calculate a correlation coefficient (r). The scientist then used a statistical test to determine the probability (P) associated with the value of r. r = –0.98 (P < 0.05) What can you conclude from this result? (2)
Strong/significant negative (correlation)(1)
(Because probability of) correlation occurring by chance is less than / < 0.05 / 5% (1)
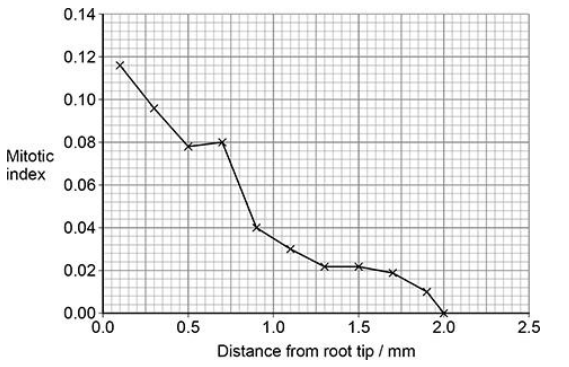
What can you conclude about the effect that distance from the root tip has on the proportion of cells in different stages of the cell cycle? Use information in the graph above. (3)
More/larger proportion of cells in mitosis closer to tip (1)
More/larger proportion of cells in interphase further from tip (1)
No cells in mitosis at/after 2(mm) (1)
A student prepared a plant root to observe cells undergoing mitosis. He put the root in a small bottle of hydrochloric acid in a 40 °C water bath. Why did he put the plant root in acid?
To break down/hydrolyse cellulose/cell wall
or
to stop mitosis
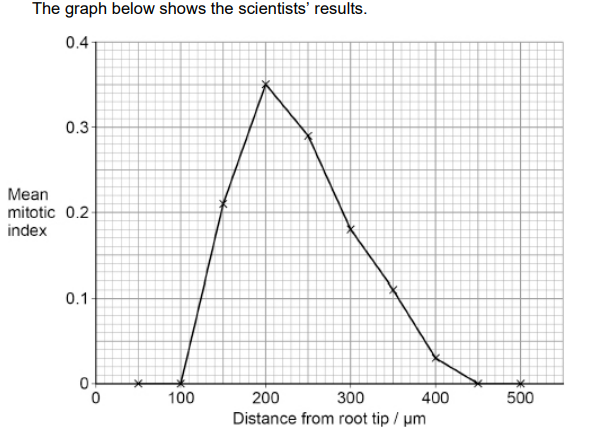
Scientists determined the mean mitotic index at 50 μm intervals away from the root tip in 10 young plant roots. The graph below shows the scientists’ results.
State the null hypothesis for this investigation. Name the statistical test needed to determine whether the difference between the mean mitotic index at 200 μm and at 300 μm is significant. (2)
Statistical test- t test
Null hypothesis- There is no difference between the mitotic index (at 200 and 300 μm)
What is a null hypothesis ? (1)
A null hypothesis H0 is a statement that there is no significant relationship or difference between two or more variables, and that any observed effects are due to chance.(1)
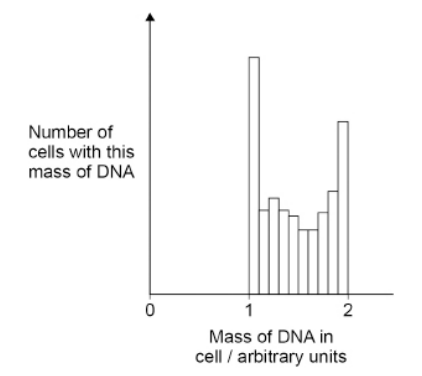
The figure below shows the mass of DNA present in a group of healthy cells
Use your knowledge of the cell cycle to explain the results shown in the figure. (3)
Mass of DNA equals 1 (indicates) (early) interphase (1)
Mass of DNA equals 2 (indicates) mitosis (1)
Mass of DNA between 1 and 2 (indicates) some of the DNA has been replicated (1)
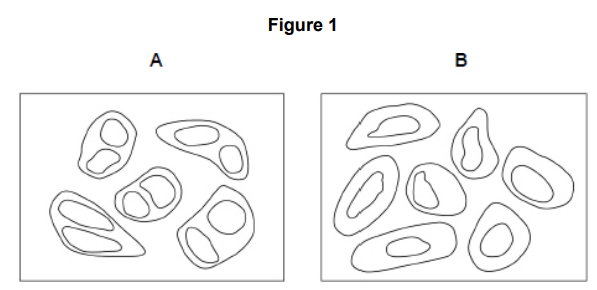
Scientists investigated a drug called MiTMAB as a treatment for cancer. MiTMAB inhibits cytokinesis.
Figure 1 shows drawings of cancer cells seen with an optical microscope from a:
• sample treated with MiTMAB
• control sample.
The cells in drawing A can be identified as those treated with MiTMAB. Explain why. (2)
2 nuclei (in cells) (1)
Cytokinesis prevented (1)
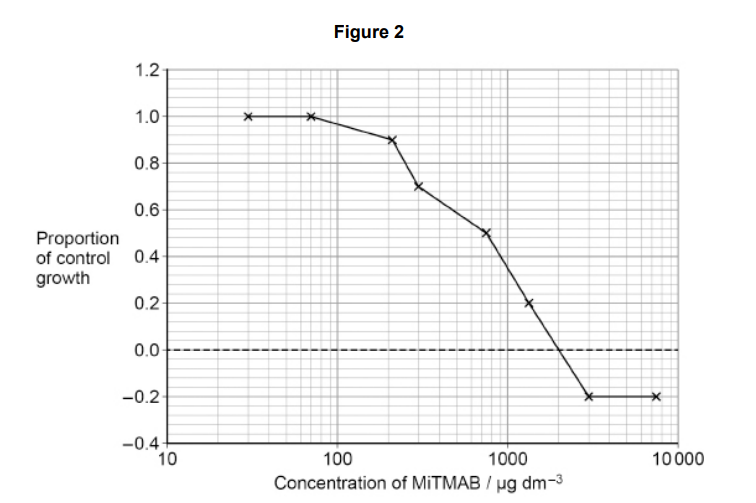
When active, dynamin has two functions:
• it stimulates cytokinesis
• it inhibits cell death.
The scientists treated actively growing cultures of cancer cells with MiTMAB.
They incubated:
• one sample of 2500 cells without MiTMAB as a control
• eight samples, each with 2500 cells and a different concentration of
MiTMAB.
After 72 hours, the scientists measured the number of cells in each sample.
Figure 2 shows the scientists’ results.
A negative value for proportion of control growth means that fewer than 2500
cells were counted after 72 hours
Use all the information given to explain the results shown in Figure 2. (3)
(At) lowest concentrations (all) dynamin is not inhibited (1)
(As MiTMAB) concentration increases more dynamin is inhibited/inactive (1)
(At) highest (MiTMAB) concentrations all dynamin is inhibited (1)
Describe how you would determine a reliable mitotic index (MI) from tissue
observed with an optical microscope.
Do not include details of how you would prepare the tissue observed with
an optical microscope. (3)
Count cells in mitosis in field of view (1)
Divide this by total number of cells in field of view (1)
Select (fields of view) at random (1)
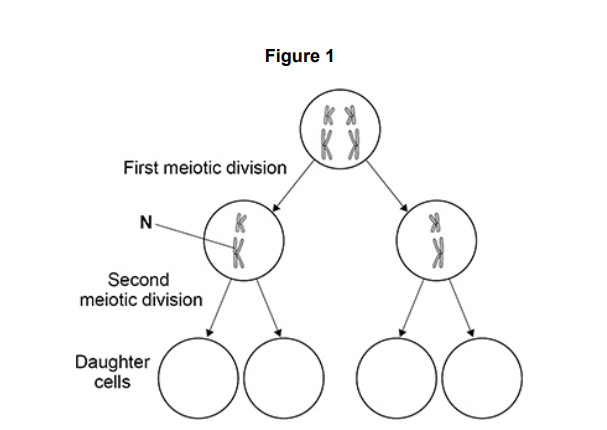
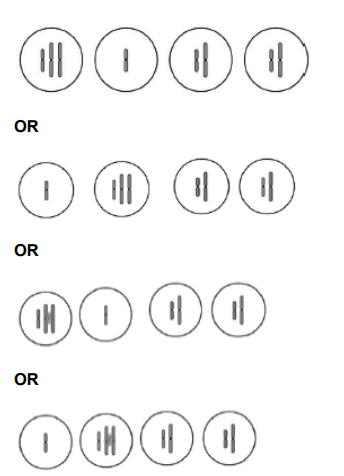
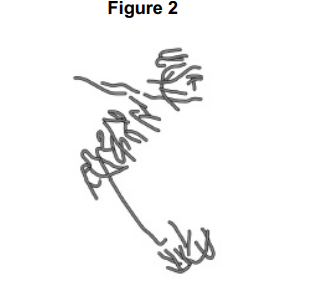
Figure 1 represents a cell undergoing meiosis. It shows the chromosomes in the
parent cell and in the two cells formed after the first meiotic division.
The second division of meiosis proceeds normally except that non-disjunction
occurs in the chromosome labelled N.
Complete Figure 1 to show the chromosomes inside the daughter cells formed after the second meiotic division. (2)
2 cells on left correct, ignore differences in
chromosome length in drawn cells (1)
2 cells on right correct, ignore differences in
chromosome length in drawn cells (1)
A student prepared a stained squash of cells from the root tips of garlic to
calculate a mitotic index. He:
1. cut the end 5 mm from 10 garlic roots
2. placed the root tips into a Petri dish containing 5 cm3 of hydrochloric acid
for 12 minutes
3. rinsed the root tips in distilled water
4. placed one of the root tips on a microscope slide and added toluidine blue
stain
5. placed a coverslip onto the microscope slide, and gently pressed the
coverslip downwards on the root tip
6. observed the root tip using an optical microscope
Pressing the coverslip downwards enabled the student to observe the
stages of mitosis clearly.
Explain why (2)
To create a single/thin layer of cells (1)
so light can pass through (1)
A student prepared a stained squash of cells from the root tips of garlic to
calculate a mitotic index. He:
1. cut the end 5 mm from 10 garlic roots
2. placed the root tips into a Petri dish containing 5 cm3 of hydrochloric acid
for 12 minutes
3. rinsed the root tips in distilled water
4. placed one of the root tips on a microscope slide and added toluidine blue
stain
5. placed a coverslip onto the microscope slide, and gently pressed the
coverslip downwards on the root tip
6. observed the root tip using an optical microscope
Pressing the coverslip downwards enabled the student to observe the
stages of mitosis clearly.
Other students in the class followed the same method, but calculated different mitotic indices. Apart from student errors, suggest two explanations why (2)
(Garlic roots) are a different age (1)
(Other) students may have calculated a mean (1)
or
Cells/roots undergo mitosis/cell division at different times/rates
Describe binary fission in bacteria.(3)
Replication of (circular) DNA (1)
Replication of plasmids (1)
Division of cytoplasm(to produce daughter cells (1)
The cell growth rate of the bacterium Bacillus subtilis is proportional to its mass immediately after binary fission.
Suggest and explain how two environmental variables could be changed to increase the growth rate of these cells. (4)
Principle of marking pairs: Named environmental variable; Correct effect on growth rate;
1. Increased (concentration of) glucose;
2. Increased respiration;
3. Increased (concentration of) oxygen;
4. Increased respiration;
5. Increased temperature;
6. Increased enzyme activity;
7. Increased (concentration of) phosphate;
8. Increased ATP/DNA/RNA;
9. Increased (concentration of) nucleotides;
10. Increased DNA synthesis;
Name the fixed position occupied by a gene on a DNA molecule. (1)
Locus/loci (1)
Give one reason why trout eggs produced by meiosis are genetically different.(1)
Independent segregation OR crossing over (1)
A trout body cell contains 80 chromosomes.
Farmed female trout are treated so that they produce diploid egg cells.
Give the number of chromosomes in body cells of the offspring produced
from treated farmed female trout and untreated farmed male trout. (1)
120 (1)
The offspring produced from farmed trout are sterile. Suggest and explain why. (2)
Too many/extra set/three copies of chromosomes (1)
So no meiosis (1)
Suggest why preventing the formation of spindle fibres stopped the cell cycle (2)
Chromosomes/centromeres cannot attach (to spindle) (1)
(so,no) metaphase (1)
Suggest and explain why ABZ could be used as a treatment for cancer even though it affects some healthy cell (1)
Cancer cells divide more/uncontrollably/rapidly (1)
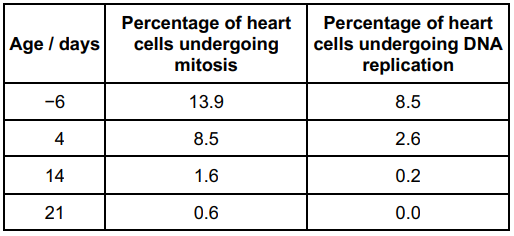
Scientists investigated the cell cycle in heart cells taken from mice 6 days before their birth and then at 4, 14 and 21 days after their birth.
Their results are shown in the table. Age 0 days = day of birth.
Describe and explain the data in the table above (2)
(Trend of) decreasing percentage undergoing mitosis from before birth to 21 days (1)
DNA replication happens before mitosis OR These cells lost the ability to divide (1)
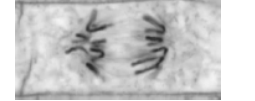
A scientist treated growing tips of onion roots with a chemical that stops roots growing.
After 24 hours, he prepared a stained squash of these root tips.
Figure 2 is a drawing showing the chromosomes in a single cell observed in the squash of one of these root tips in anaphase. This cell was typical of other cells in anaphase in these root tips.
Use all of this information to suggest how the chemical stops the growth of roots. (3)
Stops anaphase/cell division/mitosis (1)
(By) disrupting spindle fibres forming / attaching (1)
Preventing separation of (sister) chromatids (1)
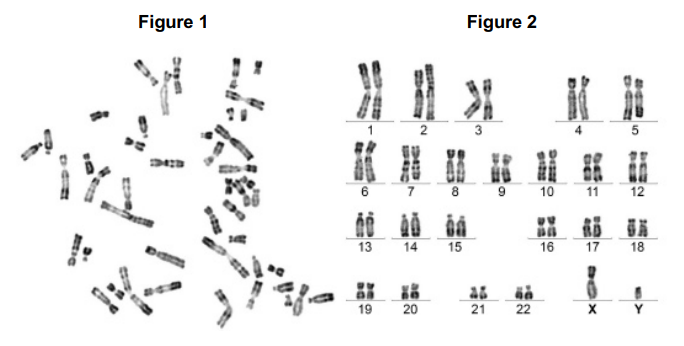
Figure 1 shows all the chromosomes present in one human cell during mitosis. A scientist stained and photographed the chromosomes. In Figure 2, the scientist has arranged the images of these chromosomes in homologous pairs.
Give two pieces of evidence from Figure 1 that this cell was undergoing mitosis. Explain your answers.(2)
(Each) chromosome is made up of two chromatids because DNA has replicated (1)
The (individual) chromosomes are visible because they have condensed (1)
When preparing the cells for observation the scientist placed them in a solution that had a slightly higher (less negative) water potential than the cytoplasm.
This did not cause the cells to burst but moved the chromosomes further apart in order to reduce the overlapping of the chromosomes when observed with an optical microscope.
Suggest how this procedure moved the chromosomes apart. (2)
Water moves into the cells/cytoplasm by osmosis (1)
Cell/cytoplasm gets bigger (1)
The dark stain used on the chromosomes binds more to some areas of the chromosomes than others, giving the chromosomes a striped appearance.
Suggest one way the structure of the chromosome could differ along its length to result in the stain binding more in some areas. (1)
Differences in condensation/(super)coiling (1)
In Figure 2 the chromosomes are arranged in homologous pairs. What is a homologous pair of chromosomes? (1)
(Two chromosomes that) carry the same genes (1)
A microbiologist investigated the ability of different plant oils to kill the bacterium Listeria monocytogenes. She cultured the bacteria on agar plates. She obtained the bacteria from a broth culture.
Describe two aseptic techniques she would have used when transferring a sample of broth culture on to an agar plate. Explain why each was important. (4)
Flame the loop (1)
to maintain a pure culture of bacteria (1)
Wear gloves (1)
It prevents contamination from bacteria on hands (1)
Describe the appearance and behaviour of chromosomes during telophase (1)
Chromatids / chromosomes uncoil / unwind / become longer / thinner. (1)
The image below shows one cell the student saw in the onion tissue.
The student concluded that the cell in the image above was in the anaphase stage of mitosis. Was she correct? Give two reasons for your answer. (2)
Chromosomes / chromatids are (in two groups) at poles of spindle / at ends of spindle (1)
V-shape shows that (sister) chromatids have been pulled apart at their centromeres (1)
A student investigated mitosis in the tissue from an onion root tip.
The student prepared a temporary mount of the onion tissue on a glass slide. She covered the tissue with a cover slip. She was then given the following instruction.
“Push down hard on the cover slip, but do not push the cover slip sideways.”
Explain why she was given this instruction. (2)
Push hard – spread / squash tissue (1)
Not push sideways – avoid rolling cells together/breaking
chromosomes (1)
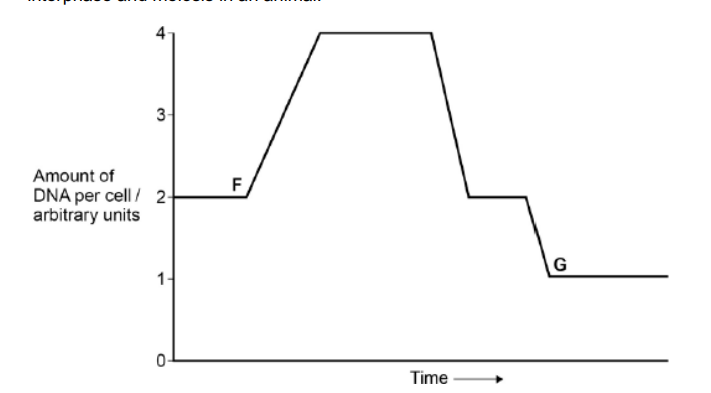
The figure below shows how the amount of DNA per cell changed during interphase and meiosis in an animal.
Explain how the behaviour of chromosomes causes these changes in the amount of DNA per cell between F and G. (3)
(Increase)
Chromosomes / DNA replicates (1)
Homologous chromosomes separate (1)
Sister chromatids separate (1)
The diagram shows a chromosome at the start of mitosis.
Describe and explain the appearance of the chromosome. (2)
DNA strands condense to make visible (1)
attached at centromere (1)
Figure 1 shows one pair of chromosomes
Describe the role of centrosome in mitosis (2)
Holds chromosomes together (1)
Attaches chromatids to spindle (1)

Figure 2 shows three pairs of homologous chromosomes in a cell at the end of cell division. The appearance of each chromosome in Figure 2 is different from those shown in figure 1. Explain why. (1)
They are chromatids which hasn’t been joined by the centromere (1)
Describe the role of spindle during mitosis (2)
Attachment of centromeres (1)
Separation of chromatids (1)
Describe the behaviour of chromosomes during mitosis and explain how this results in the production of two genetically identical cells (7)
Chromosomes thicken and condense to make visible (1)
Each chromosome has 2 identical chromatids (1)
Chromatids line up across the equator (1)
as they’re attached to spindle fibres (1)
Spindle fibres contract (1)
Chromatids move to opposite poles (1)
Nuclear envelope forms around each group of chromosomes (1)
A student investigate the stages of mitosis in a garlic root. The root tip was placed on a microscope slide with a stain. A cover slip was placed on top and the root tip was firmly squashed.
Explain why
a root tip was used (1)
a stain was used (1)
the root tip was firmly squashed (1)
root tip-where mitosis occurs (1)
a stain was used - to distinguish chromosomes (1)
the root tip was firmly squashed - to let light through (1)
Give one way in which a benign tumour differs from a malignant tumour (1)
Cells of benign tumour wouldn’t spread to other body cells (1)
Describe two ways in which both types of tumour may cause harm to the body (2)
May cause blockages (1)
They cause damage to the organs (1)
Explain the link between sunbathing and skin cancer (2)
Sun’s radiation contains UV light (1)
UV light leads to mutation of genes which control cell division (1)
Suggest why fair-skinned people are at a greater risk of skin cancer than dark-skinned people when sunbathing (1)
Fair skin has little melanin which protects against UV radiation (1)
Mikanolide is a drug that inhibits the enzyme DNA polymerase. Explain why this drug may be effective against some types of cancer (2)
Slows DNA replication (1)
New strand not formed (1)
If the DNA of the cell is damaged, a protein called p53 stops cell cycle. Mutation in the gene for p53 could cause cancer to develop. Explain how. (3)
p53 is faulty (1)
Faulty cells complete cell cycle (1)
Uncontrolled division produces cancer (1)
State the meaning of a malignant tumour (1)
a group of undifferentiated cells with uncontrolled growth that can spread to different body parts (1)
The data for fair-skinned and dark-skinned people were collected separately. Explain why skin colour was a factor likely to affect the death rate (2)
Dark skin stops UV light (1)
so less likely to develop tumour (1)
A cancerous tumour is formed by uncontrolled mitotic division. This results in a mass of cells with an inadequate blood supply. Drugs are being developed which only kill cells in a low oxygen environment. Suggest how these drugs could be useful in the treatment of cancer (2)
cancer cells killed, normal body cells survive(1)
cancer cells low oxygen (as blood supply cannot satisfy demand (1)
Give one reason for the change in death rate from malignant skin tumours with increasing age. (1)
Exposure when young, cancer is triggered later (1)