stats ch. 7, 8, and 9 flashcards (+ key to letters)
1/81
Earn XP
Description and Tags
Sadistic Torture Across Two Semesters
Name | Mastery | Learn | Test | Matching | Spaced |
|---|
No study sessions yet.
82 Terms
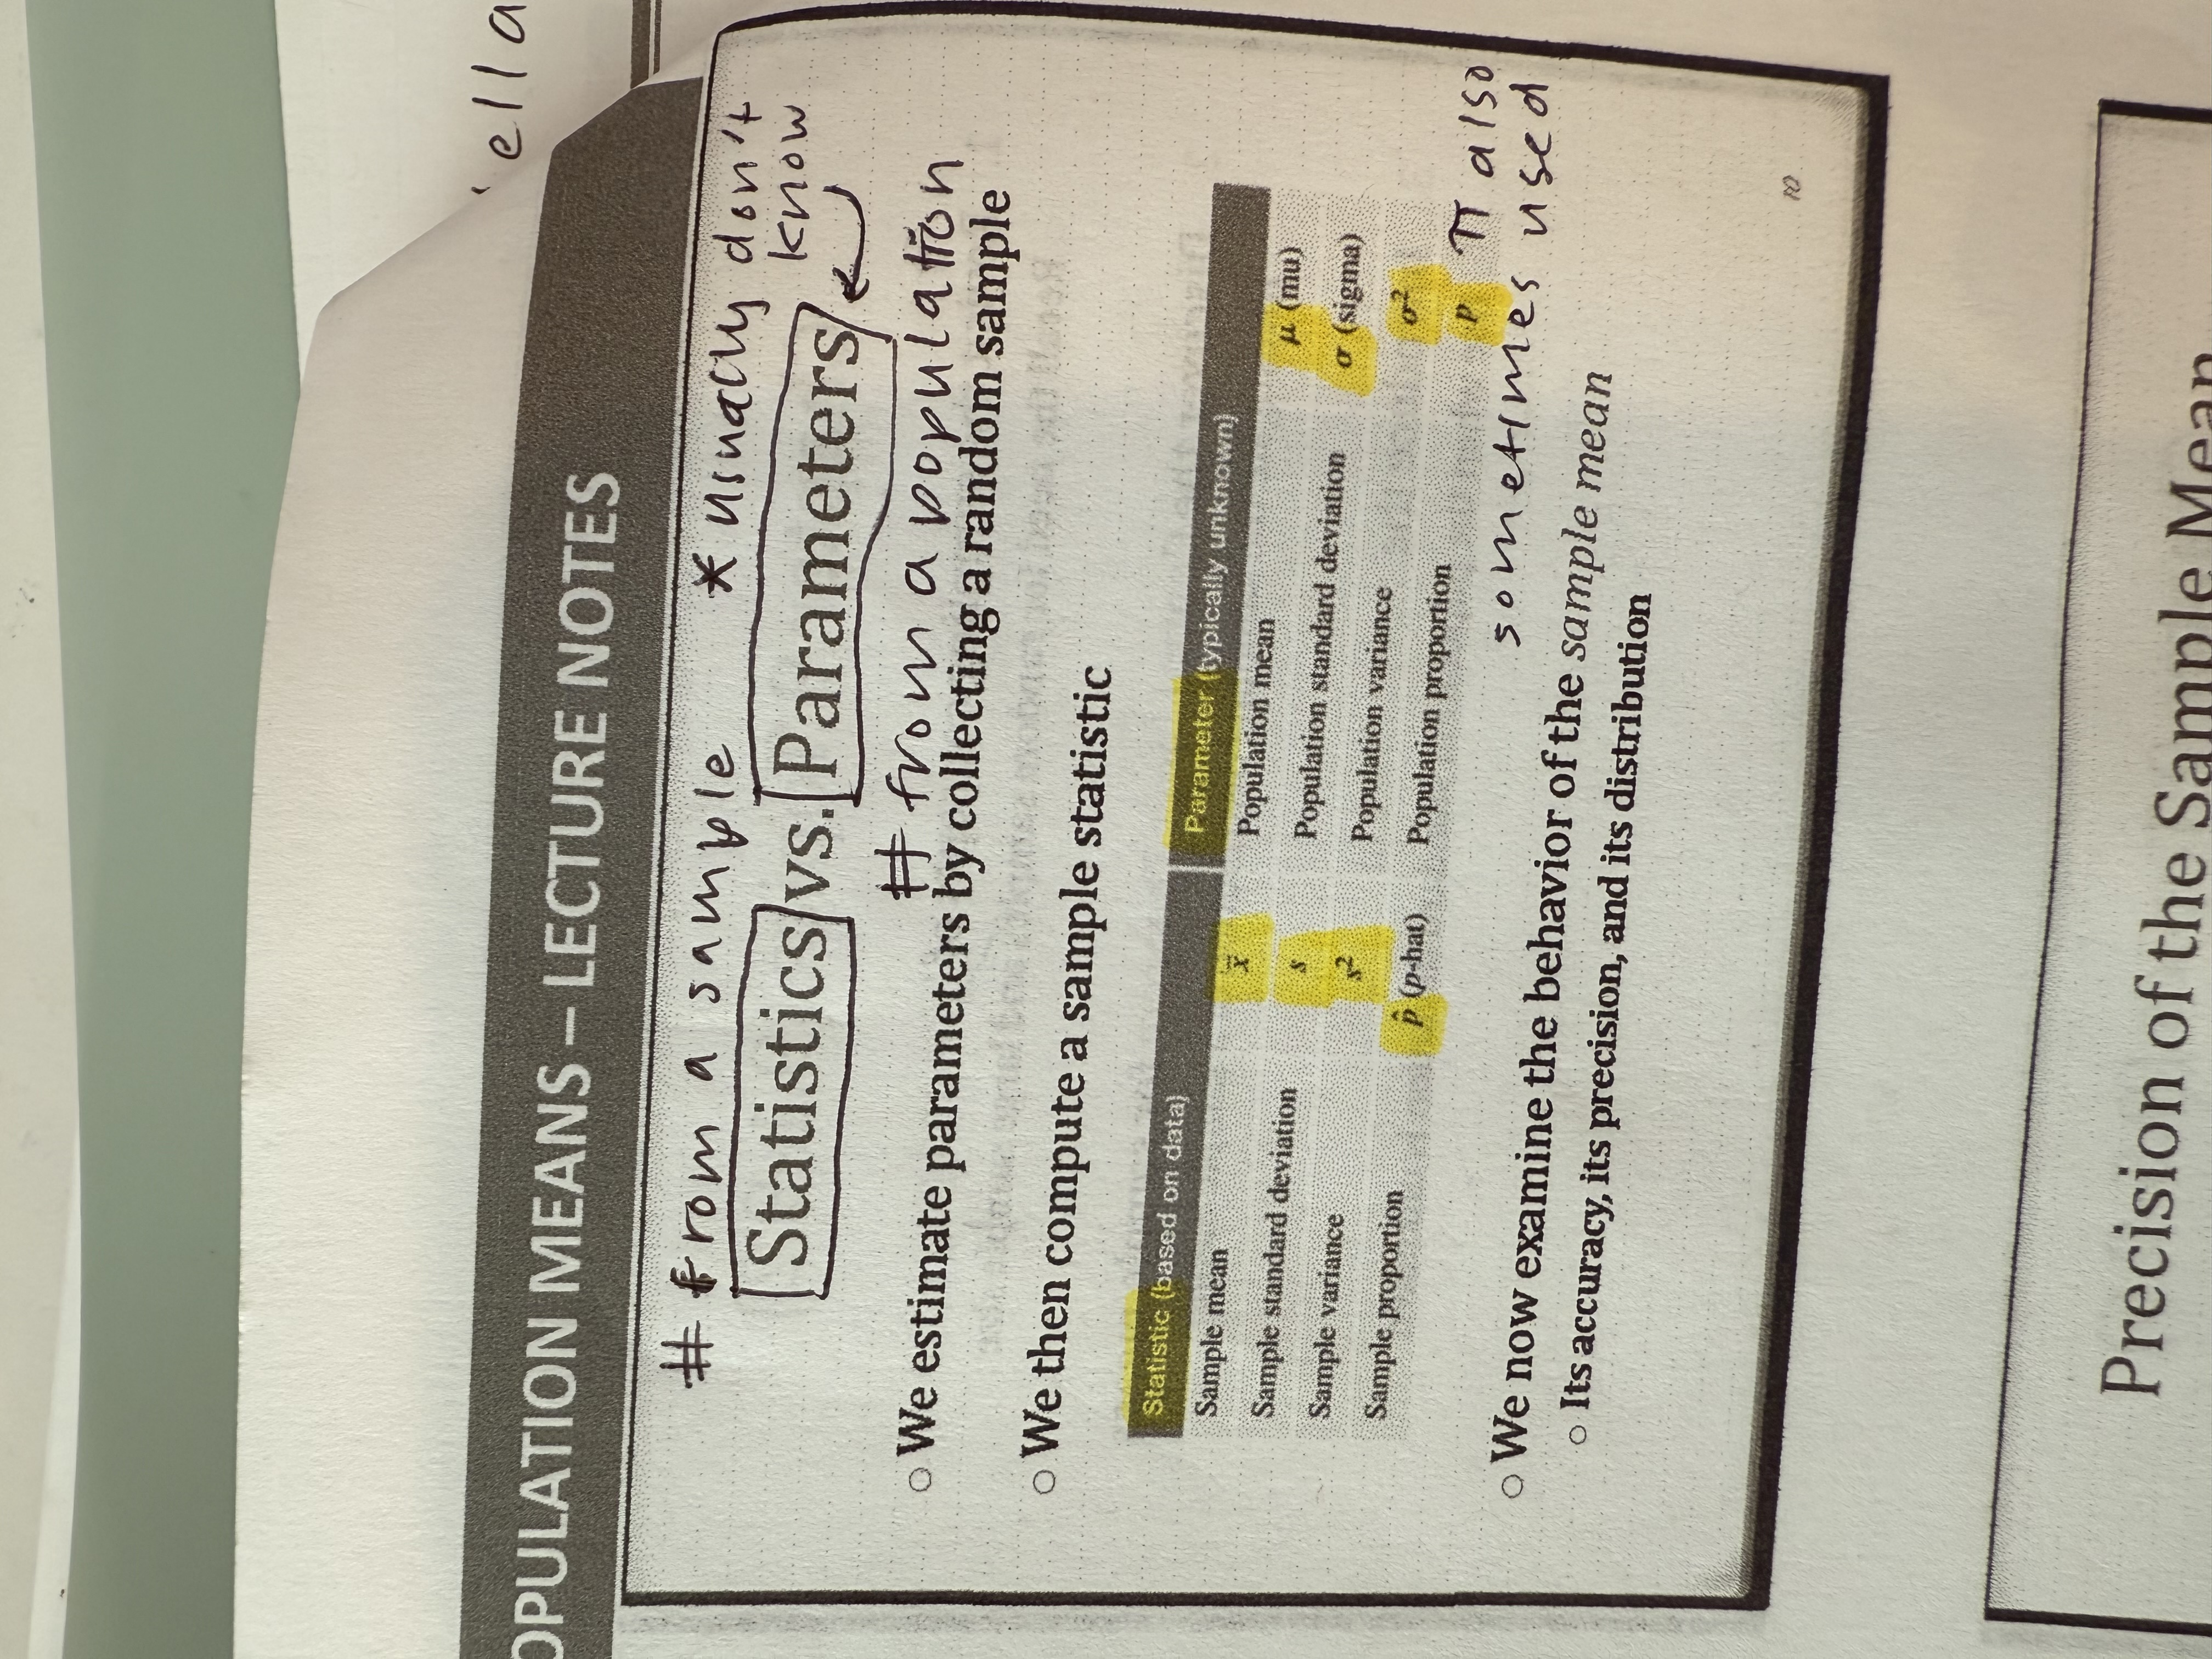
Key to all letters used in stats?
p = population proportion, yeses / total population. Usually a decimal like 0.6. → alternatively, in 1-PropZTest (hypothesis test), it represents p-value.
p̂ = sample proportion, yeses / sample size. Also called p-hat. Usually a decimal like 0.6
x = amount of “yeses”
n = total sample size
Po = assumed population proportion in the null hypothesis. This is what you guess before you do the experiment.
H0 = null hypothesis
HA = alternative hypothesis
μ = mean
x-bar = sample mean
σ = population standard deviation
s = sample standard deviation
α = significance level
Symbols for Statistics vs. Parameters ?
What is a population?
Group of individuals we wish to study (eg. all students at WVC).
What is a parameter?
Either a population proportion or population mean. Represented by p (proportion) or μ (mean). eg. proportion of all WVC students who work part-time.
What is a census?
Example of surveying entire population. However, this is usually unrealistic because the population is too big.
What is a sample?
Collection of individuals taken from population of interest.
What is a statistic?
Number of “yeses” / sample size. You have to have calculated something from the sample, like median or sample proportion. Represented by p-hat.
Which value can never be found, statistic or parameter?
Parameter. You can find the value of a statistic by collecting data, but you can only make inferences about the parameter (generalizations about the whole population).
What is sampling bias?
You get a sample that doesn’t accurately represent the whole population. eg. you survey a very opinionated population
What is voluntary-response bias?
Sampling bias where people only respond if they feel strongly about the results (miku fans will respond to surveys about how much they like miku. non-miku fans won’t fill it out at all)
What is nonresponse bias?
Sampling bias where people asked to do the survey refuse to fill it out. (might ask for uncomfortable info.)
What is measurement bias?
Survey questions do not produce true answers b/c confusing wording or misleading questions
What questions can you ask to determine if a survey is biased?
What % of people who were asked to participate actually did so?
Did the researchers choose people to participate, or did the people themselves choose to participate?
Did the researcher leave out whole segments of the population who are likely to answer the question differently from the rest of the population? (eg. only survey northern Californians, not southern ones)
How do you get a random number from the calculator?
assign a number to each and every member of the population
MATH → PRB → 5 → randInt (1, population size, amount of results you want)
pro: minimizes bias as long as individuals are selected without replacement (ie. don’t choose the number 3 twice, skip numbers that appear twice)
What is the difference between accuracy and precision?
Accurate → how close you are to the target value → measured by how unbiased you are → fixed by getting a random sample
Precise / variation→ how close the values are to one another → measured by size of standard error (the smaller the better) → fixed by getting a larger sample
What is a sampling distribution?
Take the mean of a bunch of samples. Then graph those means as a normal distribution. This is the sampling distribution of that sample statistic.
How do you calculate the population proportion based on the sampling distribution?
Mean of sampling distribution (p-hat, the sample proportion) is equal to population proportion.
How do you calculate shape, center, and spread for sampling distribution of a sample proportion/ population proportion?
Shape → check CLT. If all 3 conditions check, shape is Normal and you can make inferences. Else, can’t use normalcdf to calculate probability, stop calculating.
Center → mean.
Mean of sampling distribution = population proportion
Mean of sample statistic = population parameter
Spread → standard error → √[(p(1-p) / n] where p stands for population proportion AKA what % of the sample is “yes” (I put this on the TI-84 under PRGM 5: STDERROR)
Normal distribution vs. sampling distribution
Normal distribution → mean at μ (population mean) → axis on x (sample mean) → calculate standard deviation
Sampling distribution → mean at P (population proportion) → axis on p-hat (proportion of yeses) → calculate standard error → way smaller standard deviation, centered at same number as normal dist. though
Standard deviation vs. standard error?
Standard deviation = variation of your sample around the mean
Standard error = you take the mean of a bunch of samples. Then you calculate the standard deviation of those means.
Criteria for CLT (Central Limit Theorem) for population proportions?
CLT tells you if distribution is Normal, if it is, only then can you run tests on it
Random sample
Large sample (at least 10 yeses and 10 nos)
Large population (at least 10x sample size)
When do you use confidence interval vs. hypothesis test?
Confidence interval when you don’t know the past value or estimate for population proportion
Hypothesis test if you already know the past value
Note that confidence intervals give more info that hypothesis tests b/c tell you BOTH if a parameter could be that specific value AND gives a plausible range of values. Hypothesis test only tells you whether or not there’s significant evidence to prove you right.
Point estimate vs. interval estimate
Point estimate = single number, like a sample proportion or mean, that is our “best initial guess” for the parameter
Interval estimate = interval of numbers within which the parameter value is believed to fall
What is a confidence interval?
Interval containing the most plausible values for a parameter. Written like (point estimate) ± (margin of error).
How do you calculate confidence interval on a calculator?
Verify CLT:
Random sample
Large sample (at least 10 yeses and 10 nos)
Large population (at least 10x sample size)
STAT → TESTS → A: 1-PropZInt
x = number of yeses
n = sample size
c-level = confidence level
report the interval and write a sentence interpreting the interval (We are ___ % confident that the population proportion of all ____ that _____ is between ___ % and ___ %).
What is margin of error for population proportions?
z-score * standard error
Multiply the following SE by z-score to get margin of error:
99% confidence level = 2.58 standard errors
95% confidence interval = 1.96 (shortcut method: 2) standard errors
90% confidence interval = 1.645 standard errors
80% = 1.28 standard errors
How do you know if confidence interval means the majority likes something?
ENTIRE confidence interval has to be over 50% / 0.5. Basically, even if it’s (0.49, 0.51) the majority isn’t true because 0.49 < 0.50.
What is a confidence level?
Probability that the confidence intervals created with this process contain the true parameter. Basically: if I create a bunch of confidence intervals, what % of them capture the true value?
Does NOT apply to a single confidence interval. That one either captures the true value (100%) or doesn’t (0%).
Confidence level is a number chosen to be close to 1, most commonly 0.95.
confidence level * # of intervals = # intervals accurately captured
Correlation between confidence level, margin of error, and sample size?
Increase confidence level → increase margin of error and increase width of confidence interval → decrease sample size
Decrease confidence level → decrease margin of error and decrease width of confidence interval → increase sample size
If you know you want a certain margin of error, how do you find what sample size you need?
sample size n = (z*/m)² * ¼ where z is the critical number from the critical value table (search z-score in this flashcard deck)
Always round up to the nearest whole number EVEN IF decimal is small (eg. 1.01 → 2)
Equation for sample size is registered as a program in the TI-84 under PRGM
What is the sample size short-cut formula?
Special case: you want a 95% confidence level so you can suppose critical value Z* ~ 2 (in reality it’s 1.96)
Short-cut formula = n = 1/m² where n is margin of error you want and n is sample size needed to get that margin of error
Which proportions can be used to draw conclusions?
Population proportion. Never sample proportion.
What are the conditions for confidence interval for 2 populations?
Random sample OR individuals are randomly assigned & all other conditions are met. IF random assignment THEN specify for this condition: YES— BY RANDOM ASSIGNMENT
Samples are independent of one another (process of selecting 1 sample doesn’t affect selection of the other)
Large sample for BOTH (at least 10 yeses and 10 nos)
Large population for BOTH (at least 10x sample size)
How do you calculate a confidence interval for 2 proportions on the TI-84?
STAT → TESTS → B: 2-PropZInt
x1 = # of yeses for population 1
n1 = sample size population 1
x2 = # of yeses for population 2
n2 = sample size population 2
Calculate and report the interval. Search “interpret confidence interval for two populations” in this flashcard deck to find how to interpret the interval.
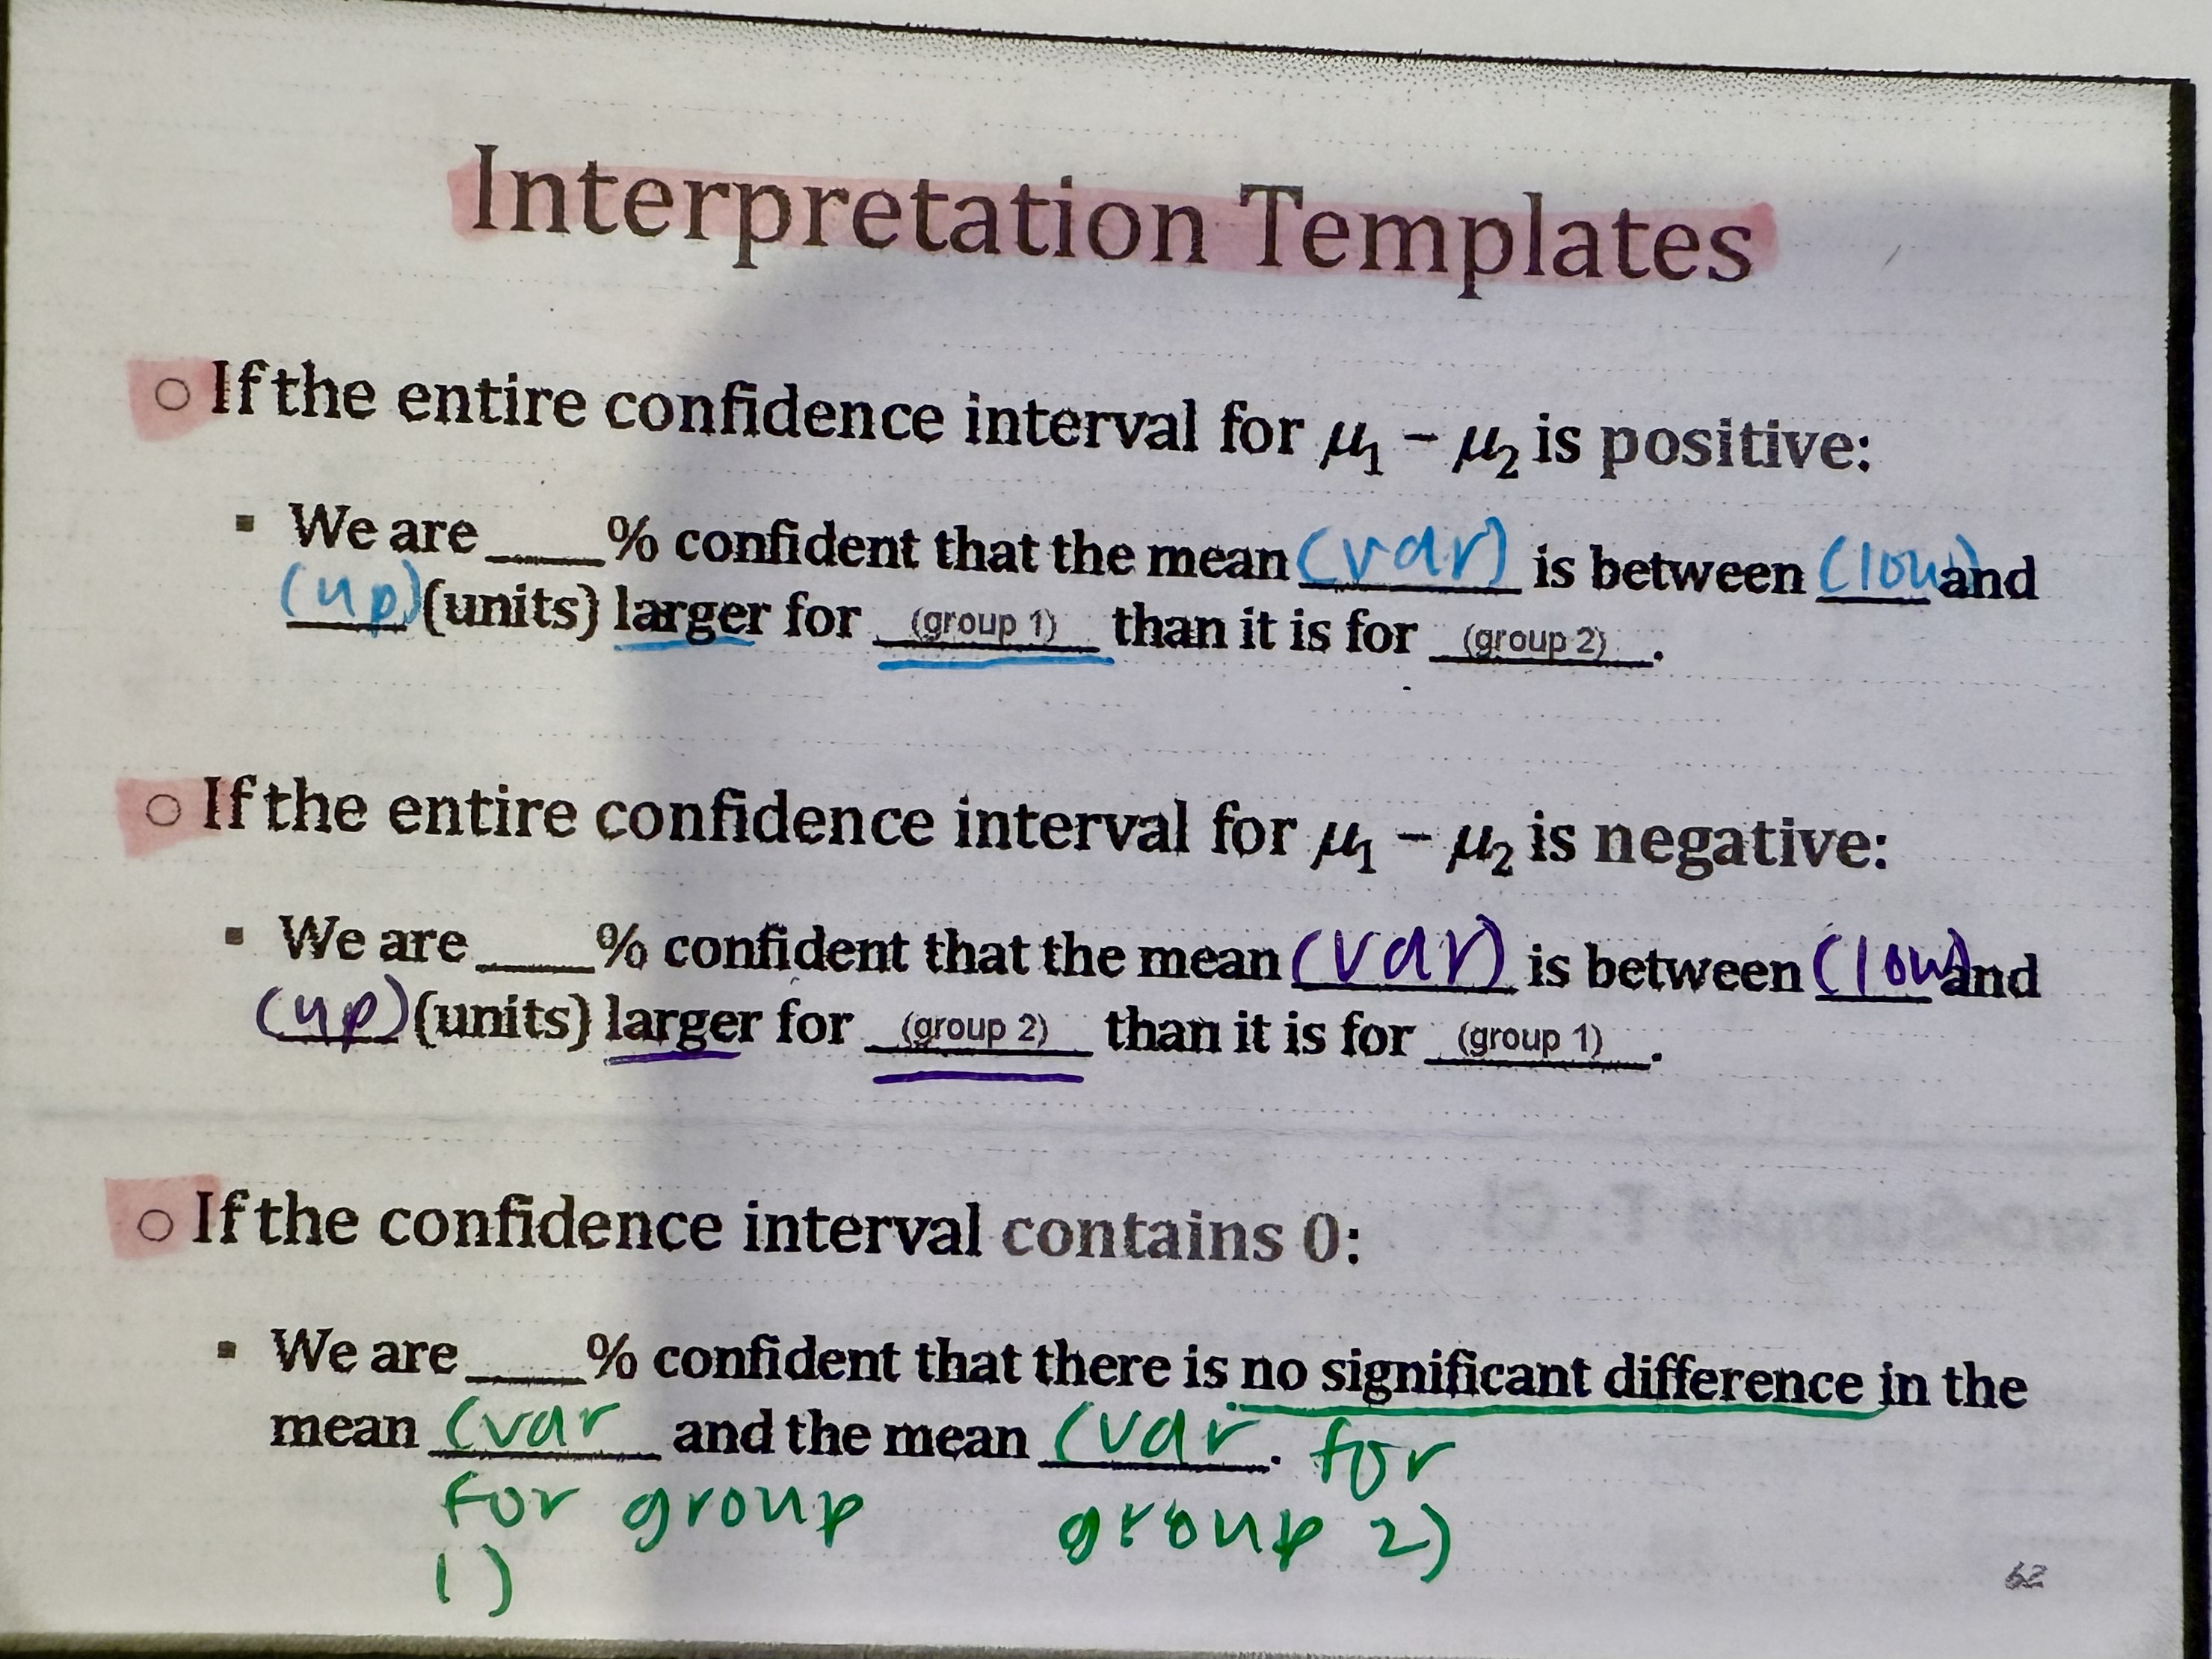
How do you interpret a confidence interval for two populations?
(+,+) → Population 1 is significantly larger
We are ___ % confident that the proportion of (yes) is between ___% and ___% significantly larger for (population 1) than it is for (population 2).
(-,-) → Population 2 is significantly larger
We are ___ % confident that the proportion of (yes) is between ___% and ___% significantly larger for (population 2) than it is for (population 1).
(-,+) → No significant difference between populations (contains 0)
We are ___ % confident that there is no significant difference in the proportion of (yeses, population 1) and the proportion of (yeses, population 2).
What do hypotheses in hypothesis testing describe?
Population parameters. NEVER sample statistics.
What are the 2 hypotheses?
Null: H0 = P0
Alternative: HA
p > P0 , p < P0 , p ≠ P0
What is a significance level?
How okay you are with making a mistake. Usually 0.05, given by alpha (α).
Is the probability of making a type I error: rejecting the null when the null is true / concluding the alternative hypothesis is true when in fact it is not true (WORST kind of error)!!
What is a test statistic?
How many standard errors the observed proportion is above/below the null hypothesis. The higher it is, the more evidence you have against the null. Represented by z (like z-score).
Only use if the data passes CLT.
1-proportion test statistic can be found by running 1-PropZTest on the TI-84 (DON’T use the one programmed into PRGM).
If test-stat is over 2, it’s unusual and you can reject the null. If it’s closer to 0, not unusual and fail to reject the null.
What is a p-value?
How likely the data is to be the same as expected / probability of obtaining a test statistic as extreme or more extreme than the one we actually observed / “surprise” in sample data is null is true. Represented by p.
Small p-value → large z-test statistic → data isn’t likely to be the same as expected → reject the null
Large p-value → small z-test statistic → data is pretty likely to be the same as expected → don’t reject the null
What is the relationship between p-value and significance level?
p < significance level → enough evidence to reject the null
p > significance level → not enough evidence. don’t reject the null
What are the 4 steps for hypothesis testing?
Write the null and alternative hypotheses
Choose a significance level and check CLT
Random sample
Large sample (at least 10 yeses and 10 nos)
Large population (at least 10x sample size)
STAT → TESTS → 5: 1-PropZTest → find the z (test statistic) and p (p-value)
P = initial %
X = amount of “yes”
N = total population
Prop = (≠, <, or >) P0
Interpret that you either reject or fail to reject the null hypothesis (is p-value bigger or lesser than significance level?) Use sentence template.
What are the “tailed” tests?
Right tailed test: Result is bigger than expected (p > Po). The right part of the normal curve is shaded, representing the p-value.
Two-tailed test: Result is not equal to what is expected (p ≠ Po). The p-value is double what it would be on right- and left- tailed tests, and is shaded on the end of both sides of the normal curve. IF you got the p-value from calculator, DON’T double it, it’s already right! ☆
Left-tailed test: Result is smaller than expected (p < Po). The left part of the normal curve is shaded, representing the p-value.
What is a sampling distribution?
The probability distribution of a sample statistic. ALWAYS normal even if population distribution is skewed. Graphed on x-bar (sample means) scale, not x-scale like the population distribution.
1-Prop ZTest vs. 2-Prop ZTest
same thing but 2-Prop has 2 population proportions, therefore 2 sample sizes and 2 sample proportions (girls vs. boys, new vs. old)
What are the null and alternative hypotheses for 2-Prop ZTest?
Null hypothesis: H0: p1 = p2 AKA p1 - p2 = 0
Alternative hypothesis: HA
Left-tailed test: p1 < p2
Right-tailed test: p1 > p2
Two-tailed test: p1 ≠ P2
*no numbers in these hypotheses! Only comparing the two proportions against each other!
How do you calculate 2-Prop ZTest?
Write the null and alternative hypotheses (search 2-Prop ZTest in this flashcard deck)
Choose a significance level and check CLT
Random sample (assume true if not given)
Samples are independent of one another (selection of one doesn’t affect selection of the other)
Large sample (at least 10 yeses and 10 nos)
Calculate pooled sample proportion: p̂ = (pop #1 yes + pop #2 yes)/(pop1 sample size + pop2 sample size)
For each population, do the following:
→ p̂*sample size ≥ 10
→ p̂*(sample size - # of “yes”) ≥ 10
NO need for large population!!
STAT → TESTS → 6: 2-PropZTest → find the z (test statistic) and p (p-value)
x1 = pop1 amount of “yes”
n1 = pop1 sample size
x2 = pop2 amount of “yes”
n2 = pop2 sample size
p1 = (≠, <, or >) p2
Interpret that you either reject or fail to reject the null hypothesis (is p-value bigger or lesser than significance level?) Use sentence template.
Z-Distribution vs. T-Distribution
Z-Distribution = used for population PROPORTIONS. large sample sizes. you know the population standard deviation. AKA Normal Distribution
T-Distribution = used for population MEANS. small sample sizes. you don’t know the sample mean or the population standard deviation (only sample). Shorter and wider than Normal Distribution to account for extra error b/c you lose 1 degree of freedom when you’re measuring 2 things
How do you calculate population mean?
Average/mean of all sample means
Spread of sample mean vs. spread of population mean
WAY SMALLER
What happens to sample means when you increase sample size?
Graph gets narrower (bigger sample size → better precision). Accuracy does not change (only impacted by level of bias).
What is standard ERROR (not deviation)?
Standard deviation of the sampling distribution (the mean of a bunch of samples from the population).
How do you calculate the standard error of a sample mean?
standard deviation of all sample means / √sample size
DON’T use PRGM 5: STDERROR !! that one is for when you’re given the population proportion— but here, you’re trying to find the STDERROR of sample mean!!!
How do you calculate the mean of a sample mean?
Mean = same as population mean
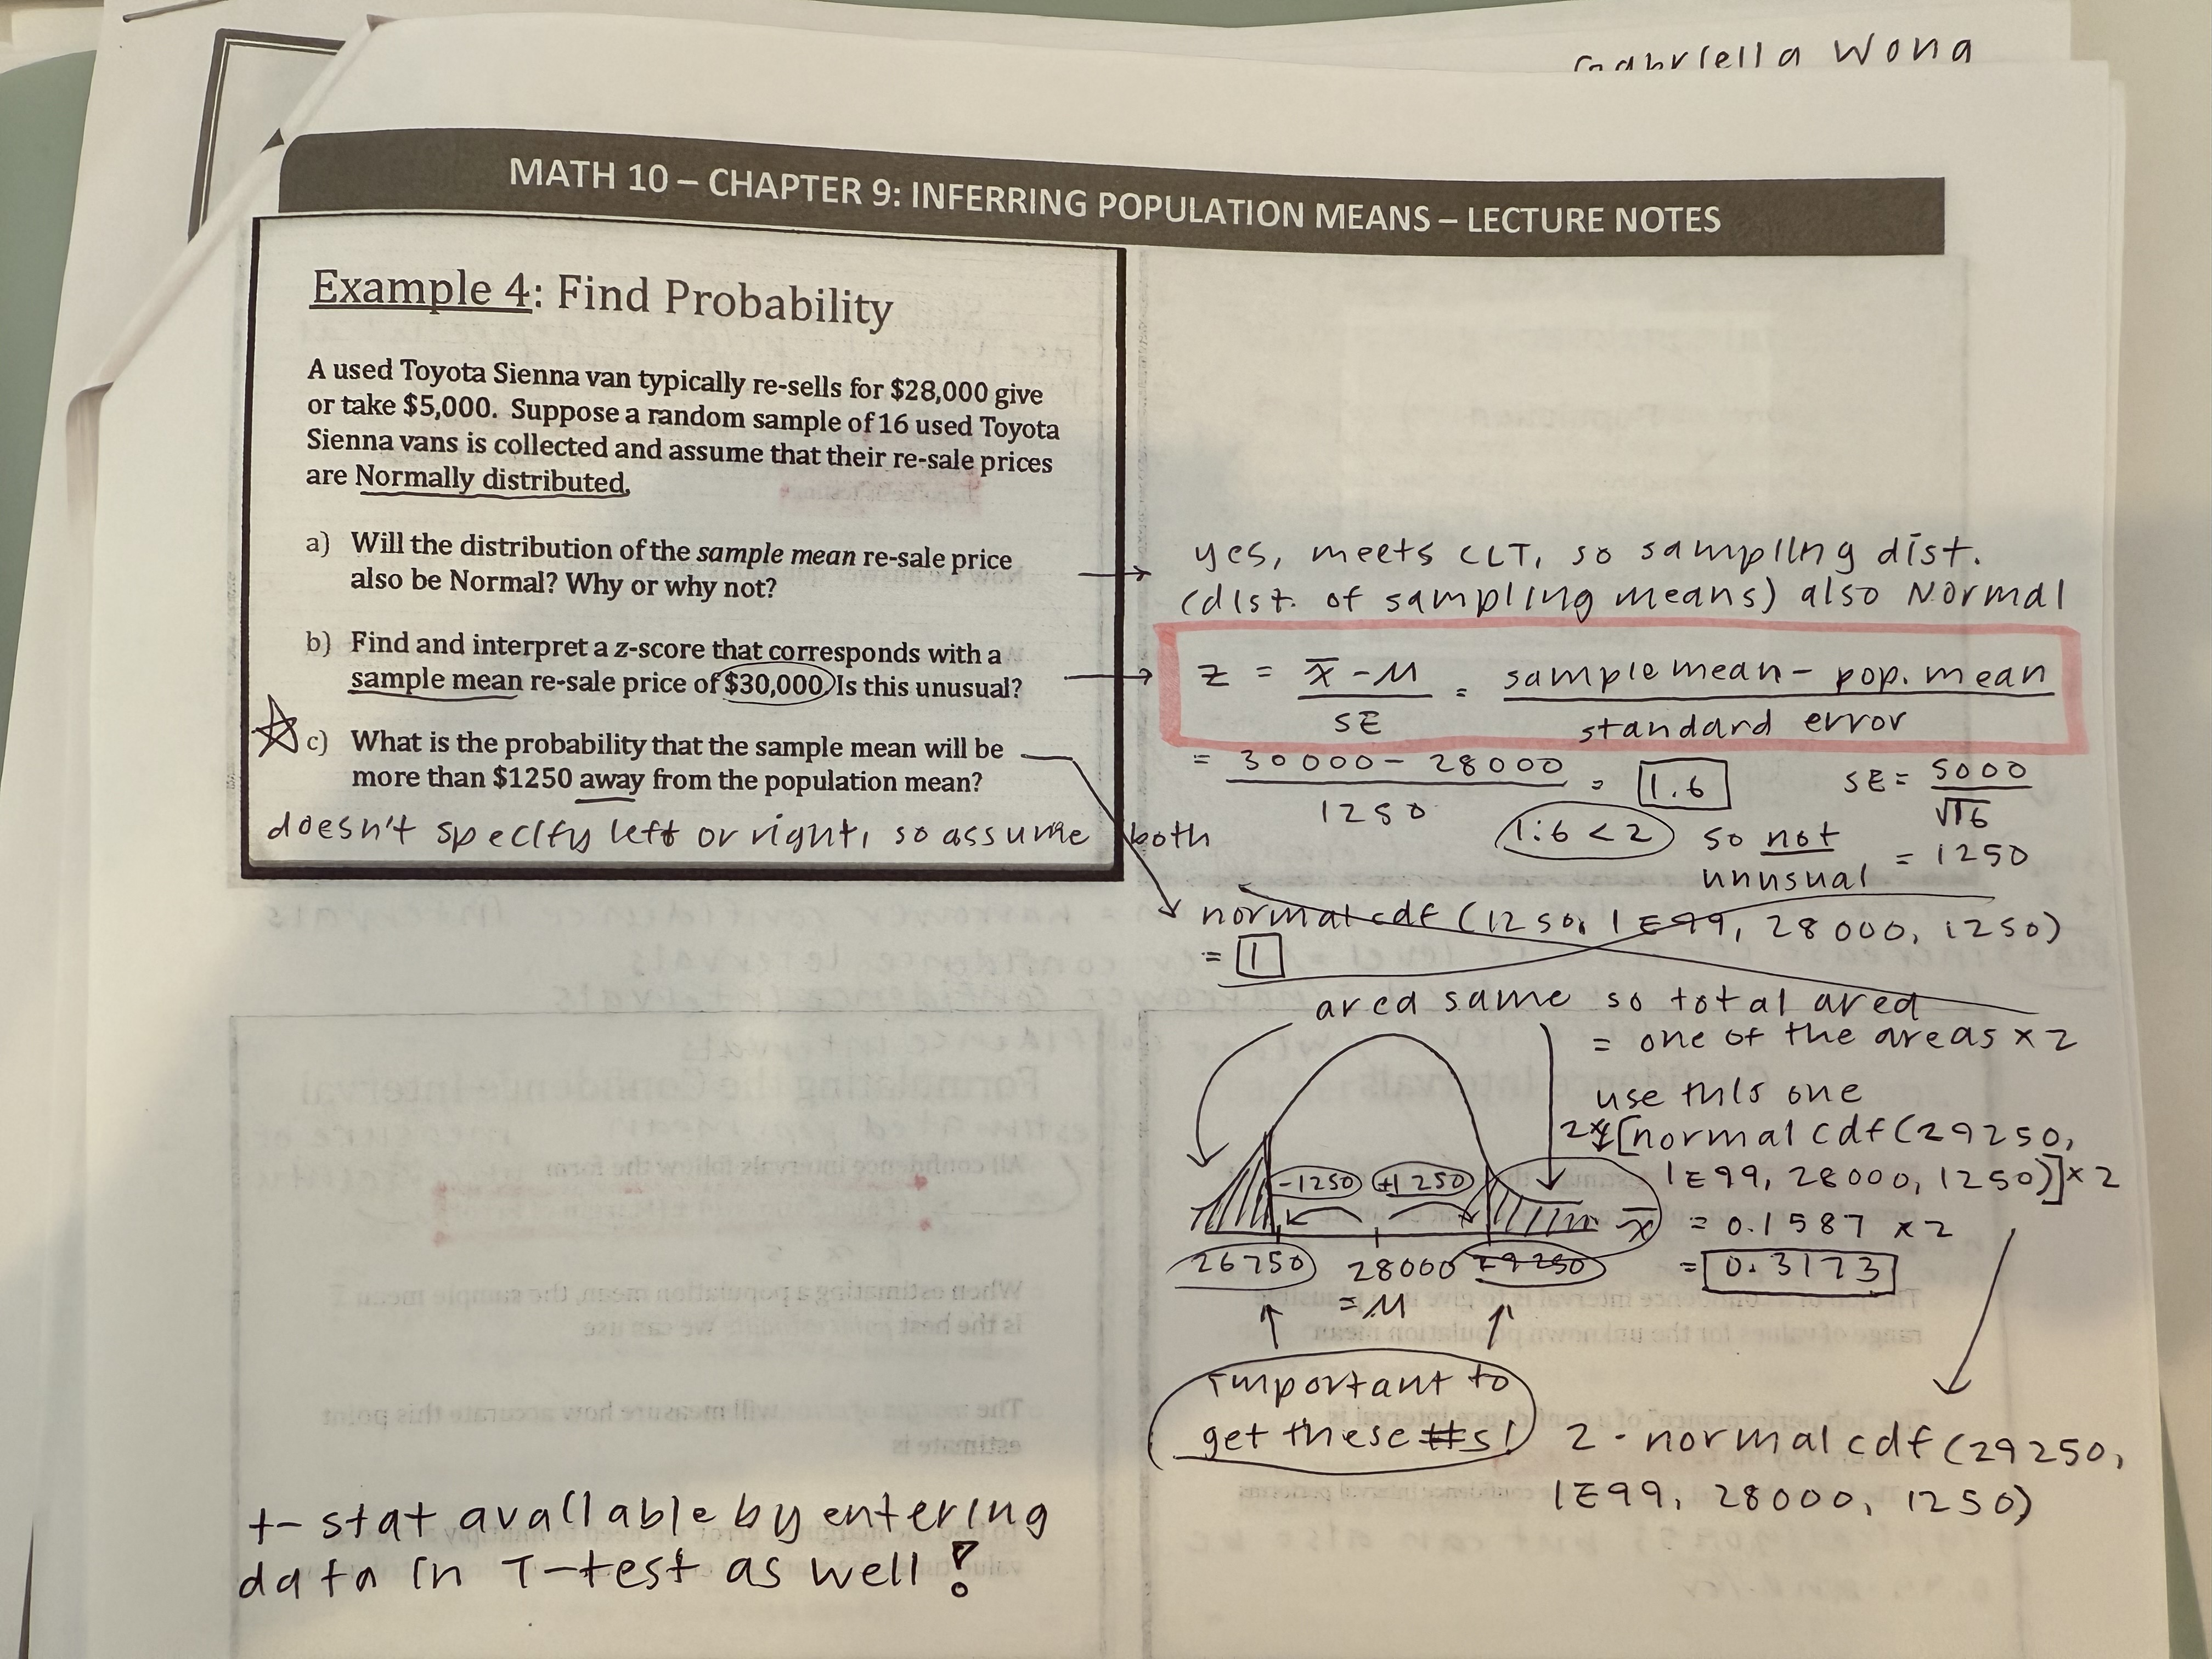
How do you compute the z-test statistic?
Do 1 or 2-Prop ZTest (hypothesis test for 1 vs. 2 proportions) then look for z=
OR (sample mean - population mean) / standard error
can use PRGM 8: ZSCORE for this, but replace:
→ given number = sample mean
→ mean = population mean
→ STDDEV = standard error
What are “tailed tests”?
Describes the sampling distribution:
Right-tail test → Ha: P > P0 → “result is as extreme or more extreme than hypothesis” → Z is on the right of P0, and everything to the right of Z is shaded
Left-tail test → Ha: P < P0 → Z is on the left of P0, and everything to the left of Z is shaded
2-tail test → Ha: P ≠ P0 → Z is on both sides of P0. The shaded part is twice as big as it is on a 1-tailed graph, and everything from the left and right are shaded (NOT in between).
*on all of these, it is the standard error graph (on a scale of p-hat). P0 (null hypothesis) is the middle of the graph, where the mean on a standard deviation graph would be. the shaded part represents the p-value, the smaller the p-value, the more evidence you have to discredit the null hypothesis
What is skew?
|||IIIIIiiii—- = right skew (it’s flat on the right)
—iiiiIIIIII|||| = left skew (it’s flat on the left)
bell-shaped or uniform = no skew
What are the two distributions that look similar?
Population distribution → distribution of values from the population → has a certain shape, center, and spread → but value of its parameters are generally unknown → graphed on x-axis
Distribution of the sample (if random and large) looks the same as population distribution → has the same shape, center, and spread → described by sample statistics → also graphed on x-axis
Which flavor of distribution is not like the other girls :D
Sampling distribution → found by looking at the probability distribution of a sample statistic (basically st. dev of all the sample means) → describes how close the sample stat is to the population parameter → graphed on x-bar (sample mean) axis
looks NOTHING LIKE population distribution and distribution of the sample!! also usually narrower; its standard deviation = standard error of a sample mean = standard deviation of all sample means / √sample size
Sampling distribution ALWAYS normal-shaped even if the population distribution is skewed!
What are the CLT conditions for sample means?
Random
EITHER Normal OR sample size ≥ 25 (if the distribution is unknown or not normal)
Large population (at least 10 times sample size, if sample is collected without replacement - once an observation is selected it cannot be selected again) (use sentence from the template)
How do you calculate shape, center, and spread for sampling distribution of a sample mean / population mean?
Shape → ALWAYS Normal!
Center → same as the one noted in the sample.
Spread → standard error → σ/√n where n is sample size. If you don’t know σ (population std. dev.), you can substitute s (sample std. dev.) to calculate the standard error.
*if you’re using Spread to plug into 2nd → VARS (DISTR) → normalcdf, make sure you plug in the Standard Error and NOT the standard deviation! Use equation for spread to calculate std. error.
Equation for sampling distribution of sample means
N ( μ , σ/√n)
if you don’t know σ (population std. dev.), you can substitute s (sample std. dev.) to calculate the standard error
Equation for z-score
(sample mean - population mean) / standard error
Special case of finding probability based off of sampling distribution
What is the t-statistic?
Basically like the z-score except you don’t know the population standard deviation. So you are only estimating the standard error, losing 1 degree of freedom to account for the additional error in the measurement that was estimated.
This changes the shape of the distribution, making the tails a little bigger/thicker than the Normal distribution. The new distribution isn’t Normal, it’s called the t-distribution instead and is shorter and wider. It’s still bell-shaped and centered at zero, though.
How to find t-statistic with a calculator?
T-test (STAT → TESTS → 2 → look for t=)
What factors influence the shape of a confidence interval?
Narrower confidence interval → lessen confidence level → small t-score AKA T* (critical value) → larger sample size
Wider confidence interval → increase confidence level → large t-score (critical value) → smaller sample size → more variation
What is margin of error for population means?
t-score x standard error (VS population proportion using z-score x standard error)
Can you know the standard error for a population mean?
No. This would require you know the value of the population standard deviation, but you don’t. So, you substitute in the sample standard deviation and use that to estimate (NOT know for sure) standard error instead.
How do you calculate confidence intervals for a population mean?
Verify CLT (random sample, Normal distribution or n ≥ 25, large population at least 10x sample size)
Check if you were given the raw data or summary stats
Raw data: STAT → Edit → enter into L1. Then STAT → Tests → 8: TInterval → DATA → List: L1 → Freq: 1 → C-Level: [enter what’s given] → Calculate
Summary stats: STAT → Tests → 8: TInterval → STATS → enter sample mean, sample standard deviation, population size, confidence level → Calculate
Then report the interval you get.
Interpret the interval with the following template: We are ___% confident that the population mean (variable you’re trying to find) of all (population) is between ___ and ___ (units).
How do you calculate sample size for population means?
n = (2σ / desired margin of error)²
*Always ROUND UP to NEXT whole number!! (eg. 72.01 → 73)
**If you don’t know the standard deviation (σ), use an estimate of the standard error from previous research
How do you calculate hypothesis testing for a population mean?
Hypothesize (H0 is always = population mean)
State significance level, verify CLT (ONLY random and Normal / n ≥ 25 !!! NO large populations requirement)
STATS → Tests → 2: T-Test → STATS → population mean, sample mean, sample standard deviation, sample size, ≠ or < or > → report t-test statistic and p-value
Interpret if p-value is greater than or less than significance level (α). Reject null if p-value is less than α.
How do you know if you can use a 2-sided test and if the results of the confidence interval will match with the results of the hypothesis test?
If significance level + confidence level add up to 100% (0.05 → 5% significance level + 95% confidence level).
What are dependent samples?
Dependent samples = matched pairs
Measured twice (“before and after,” same item in two stores)
Related somehow (twins, siblings, spouses)
Subjects deliberately matched to have similar characteristics (race, age)
What are independent samples?
No pairing, no connection
Both samples collected randomly
How do you make a confidence interval (to estimate the mean difference) for 2 independent samples?
Verify CLT (random, independent, Normal or both samples n ≥ 25)
Check if you’re given the summary statistics OR raw data
Summary statistics: STAT → Tests → 0: 2-SampTInt → sample 1 mean, sample 1 st. dev, sample 1 size, sample 2 mean, sample 2 st. dev, sample 2 size, confidence level, pooled = NO!!!
Raw data: STAT → Edit → enter data in L1 and L2 → STAT → Tests → 0: 2-SampTInt → FREQ for both = 1 → pooled is always NO!!!
Then report the calculated interval
If entire confidence interval is positive, μ1 is significantly larger. If it’s negative, μ2 is significantly larger. If it contains 0 (-, +), there is no significant difference (μ1 - μ2 = 0).
3 interpretations for confidence interval for 2 (works for both independent and dependent) samples
How do you do a hypothesis test (to test the mean difference) for 2 independent samples?
Write the null hypothesis (ALWAYS μ1 = μ2), then alternative hypothesis (μ1 ≠ or < or > μ2). There are no numbers involved, only symbols.
Write significance level and verify CLT (random, independent, Normal or n ≥ 25)
Check if you’re given the summary statistics OR raw data
Summary statistics: STAT → Tests → 4: 2-SampTTest → Pooled: No
Raw data: STAT → Edit → enter data in L1 and L2 → STAT → Tests → 4: 2-SampTTest → FREQ for both = 1 → pooled is always NO!!!
Report t-test statistic (t=) and p-value (p=)
Interpret if p-value is more than or less than significance level (α). Reject null if p-value is less than α.
What special thing do you do for 2 dependent samples?
Do x1 - x2 to turn them into “difference” scores.
How do you make a confidence interval (to estimate the mean difference) for 2 dependent samples?
Make the difference scores and enter them into STAT → Edit → L1
Verify CLT (Random and Normal or n ≥ 25, NO large populations requirement!!)
STAT → Tests → 8: T-Interval → Data → Freq = 1 → Report the interval
If entire confidence interval is positive, μ1 is significantly larger. If it’s negative, μ2 is significantly larger. If it contains 0 (-, +), there is no significant difference (μ1 - μ2 = 0).
Interpret using sentence templates (search “three interpretations” in this flashcard deck, flashcard 77)
How do you do a hypothesis test (to test the mean difference) for 2 dependent samples?
Make the difference scores and enter them as a list in the calculator
Write the null hypothesis (ALWAYS μ0 = 0), then alternative hypothesis (μ0 ≠ or < or > 0).
“means are not the same” → μ0 ≠ 0
sample 1 > sample 2 → μ0 > 0
sample 2 > sample 1 → μ0 < 0
Write significance level and verify CLT (Random and Normal, NO large populations requirement!!)
STAT → Tests → 2: T-Test → Data → μ0 = 0 → Freq = 1 → Report t-test statistic (t=) and p-value (p=)
Interpret if p-value is more than or less than significance level (α). Reject null if p-value is less than α.
Which method do you use for one-tailed and two-tailed testing?
One-tailed → “bigger or smaller” → > or < symbols → hypothesis test
Two-tailed → “by how much” → ≠ symbol → Either hypothesis test or confidence interval
Confidence intervals are PREFERRED because they give more information: both if it could or could not be a specific value AND gives plausible range of values for population parameter