Generalized Linear Model Part 3
1/21
There's no tags or description
Looks like no tags are added yet.
Name | Mastery | Learn | Test | Matching | Spaced |
|---|
No study sessions yet.
22 Terms
Binary Logistic Regression
Models the odds for “success” for response variable y depend on a set of exploratory variables
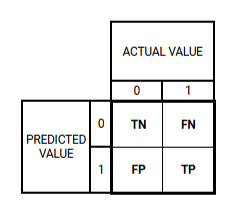
Confusion Matrix
Summarizes the performance of a binary classifier by comparing predicted labels to the actual labels of the data
TP or True Positive
Correctly predicted as Positive
TN or True Negative
Correctly predicted as Negative
FP or False Positive
Incorrectly predicted as Positive
FN or False Negative
Incorrectly predicted as Negative
Default Confusion Matrix
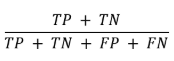
Accuracy
Measures of overall correctness of the classifier
Proportion of correctly classified instances over the total number of instances
Precision
Measures overall accuracy of positive predictions made by the classifier
Of all the instances classified as positive, how many were genuinely positive?

Sensitivity
True Positive Rate
Identify all the positive instances
Of all the positive instances in the dataset, how many did the classifier identify correctly?

Specificity
True Negative Rate
Identify all the negative instances
Of all the negative instances in the dataset, how many did the classifier correctly identify

False Positive Rate (FPR)
Fall Out
Negative instances that were incorrectly classified as positive
avoid false alarms in negative instances

False Negative Rate (FNR)
Miss Rate
The proportion of Positive instances that were classified as negative
avoid missing positive instance

Positive Predicted Value (PPV)
Accuracy of positive prediction
Same Formula with PRECISION

Negative Predicted Value (NPV)
Precision for the negative class
Accuracy of negative predictions, specifically.

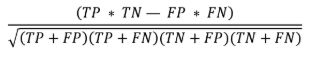
Matthew Correlation Coefficient (MCC)
Least influenced by imbalanced ness
All four components of confusion Matrix
Ranges from -1 to +1
+1 = Represent a perfect classifier
0 = indicates a random classifier
-1 = Denotes a classifier that performs exactly the opposite to the desired behavior
Higher value = Better Classifier
Cohen’s Kappa Statistic
Insight on gain using a model
Designed model’s reliability in terms of agreement
Youden’s J statistic
probability of an informed decision
A value of 1 indicates that there are no false positives or false negatives; the model is Perfect

Receiver Operating Characteristic (ROC) Curve
plotting Sensitivity against FPR or Fall-Out
Area Under the ROC Curve (AUC)
probability that a model ranks a random positive example more highly