Research Methods -- Midterm!
1/60
There's no tags or description
Looks like no tags are added yet.
Name | Mastery | Learn | Test | Matching | Spaced | Call with Kai |
|---|
No analytics yet
Send a link to your students to track their progress
61 Terms
T-test
Difference between 2 groups on a continuous variable
ANOVA
Difference between 2+ groups on a continuous variable
Chi-square
Relation between two categorical variables
Sample from population of interest
Sampling is choosing members of a population
Population is the defined group of individuals from which a sample is drawn
Sample is a portion of population but not the whole population
The goal is to generalize the sample to the population
Who hope our sample is representative
Representative samples
Representative is critical for generalization
We are interested in looking for general rules of behavior (not the expectations)
You can never totally be sure your sample is representing the population
Steps to be as representative as possible
The more representative, the more closely you are approximating the population
Sample sizes as large as possible
Law of large numbers — the more observations in a sample, the more likely it is to approximate a normal curve
Different ways to sample!
Nonprobability sampling
Hapazard
Quota
Probability sampling
Simple random sampling
Stratified random sampling
Cluster sampling
Critically evaluating
What was the response rate on the survey?
Sampling frame → who’s included
Non-probability sampling
Haphazard (limits the generalizability of findings)
Participants are selected without any systematic or random procedure, often based on convenience
Ex: our study
Quota (think of as buckets)
Participants are selected based on predetermined quotas for specific subgroups
Ex: subgroups like "male" and "female" with quotas of 100 people for each
Probability Sampling
Everyone has a certain probability of being selected
Simple random sampling (no bias)
Each member of the population has an equal chance of being selected
Stratified random sampling (buckets)
The population is divided into subgroups, called strata, based on shared characteristics, and then a random sample is taken from each stratum
Ex: a survey where a school divides its students into grade levels (freshmen, sophomores, juniors, and seniors) and then randomly selects an equal number of students from each grade to ensure fair representation
Cluster sampling
The population is divided into groups, or "clusters," and some of these clusters are randomly selected for a sample
Ex: surveying students in a state by randomly selecting a few schools (clusters) from each district and then surveying all the students within those chosen schools
Correlation
Relation between to continuous variables
Data Types - Ratio Scale
Description
Have a rational / fixed 0 point
A uniform unit → difference between 1 & 2 is the same as 35 & 36
Examples
No height = zero height
Someone can be double your height
Statistical test
T-test, ANOVA
Data Types - Interval Scale
Description
No fixed zero (can’t have true absence)
Maintain uniqueness even with the multiplication of a positive constant
Intervals are equal distance
Can use negative variables
Each point on the scale represents some magnitude of the trait being measured, no matter where on the scale you are
Example
100% on a test is not twice as good as a 50%
Statistical test
T-test, ANOVA
Data Measurement - Ordinal Scale
Description
The unit does not have to be fixed
The required order of numbers themselves preserves the order of objects on the attribute being observed
You’re literally in order, preserving the order (but not saying anything about the ratio)
Example
1st place is faster than 2nd, but 2nd is not proportionally faster than 3rd
Statistical test
Mann-Whitney
What makes a good research question?
Relates to research that would fill a hole in the literature, continuing existing research
Solves a practical problem
Describes a relation between 2+ variables
Specifically identifies the variables
Operationally defines the variables
Ethical
Is in the form of a question
Is capable of being tested (testable)
What makes a good hypothesis?
Founded in theory
Contributes to knowledge
A prediction that’s testable
Has to be refutable by the current study
Derived from some observation of behavior
Ethical
Is in the form of a statement
Brief and to the point
Independent variable
Manipulated
Considered the “cause”
Has nothing to do with the participant
Dependent variable
Dependent on the independent variable
The result / outcome of what you are manipulating
What you measure
Participant variable
Can be your independent variable
Ex: gender, depression
Confounding variables
Variables other than the one you manipulated that could be responsible for your results
Type 1. Situational Variable
Characteristic of a situation or an environment
Ex: color of the room
Type 2. Experimental Variable
Anything about the experimenter themselves
Ex: using female vs. male researchers
Type 3. Participant Variable
Anything having to do with the individual differences of the participants
Ex: gender, age, IQ, personality
Correlational Research Method
Doesn’t manipulate anything
Takes existing situations
Observing / measuring variables of interest
Questionnaire is NOT manipulating
Doesn’t have to be a correlation test
Experimental Research Method
Manipulating variables
Changes to conditions to see if a behavior differs
KEY - experimental control
Everything is kept constant expect variable of interest
KEY - randomization
You don’t pick your group, randomly assign
Distributes individual differences
Quasi-Experimental Research Method
Not really manipulating variables
Taking advantage of existing group differences (e.g. height, age, gender)
using participant variables
Different types…
Non-equivalent control group pre-test post-test design
Find two groups with a pre-test
Looking for greater change with a treatment than control group
Interrupted time-series design
Take advantage of circumstances in which something is changing
Measures something that’s interrupted by time
Control series design
As if you added control group to interrupted time-series design
Correlational Design Issues
Direction of cause and effect
Can’t know what causes what
Third variable problem
A →/ B, B →/ A, C → B & A
Experimental Design Issues
Allows you to make causal inferences but such a sense of artificiality that we struggle to generalize from results
Sacrifices ecological validity
Quasi-Experimental Design Issues
Have to wait for naturally occurring situations
At mercy of things changing
Choosing a method!
Consider artificiality of experiments
Realism is sacrificed for the sake of control
Ethical considerations
Sometimes we just want to describe behavior → doesn’t make sense to do an experiment
Longitudinal Method
Naturally occurring changes over time
2+ data collections over time
Attrition - the gradual loss of participants in a research study over time
Reasons to use longitudinal
Want to know the stability of a specific measure
Effects of earlier conditions on later development
Describing changes in development over time
Cross-sectional Method
Interested in one slice in time
Look at different characteristics within that time
Reasons to use cross-sectional
Less expensive
Faster
Doesn’t have the issue of attrition
Problems with cross-sectional
Can’t measure age changes
Can’t ask about stability over time
Can’t necessarily make causal claims
Cross-sequential
The combination of cross-sectional and longitudinal methods
Start with different age groups
You test everyone 2+ times
Advantages
Have different age groups right away
Drawbacks
Recruiting participants is difficult
Have to wait for the longitudinal data
Reliability
The consistency or stability of a measure, behavior, or the degree to which a measure is consistent
Different versions:
Test-retest
Split-half
Odd-even
Item-total
Inter-rater / inter-observer reliability
Test-retest
A reliability measure
Measure the same individual at 2 points in time
Split-half
A reliability measure
(Running correlation) Compare different parts of the test to themselves
Cronbach’s alpha - calculates every single split-half correlation (sensitive to # of items)
Odd-even
A reliability measure
Compare correlation between odd and even questions
Item-total
A reliability measure
Look at each individual item and its correlation with the rest of the measure
Inter-rater / inter-observer reliability
A reliability measure
You vs. your partner
Multiple people make observations, the correlate observations or % agreement
Cohen’s K - the statistic we report for inter-rater reliability; corrects for the proportion of agreement that might occur by chance
Validity of Measures
The extent to which the instrument measured what it intended to measure
Types of Validity of Measures
Content validity
Criterion validity
Construct validity
Content validity
The extent to which a measurement accurately represents the specific domain of content it is intended to measure
It involves ensuring that the indicators used in the measure comprehensively represent the full range of content relevant to the concept being measured
Criterion Validity
Does your performance on the test relate to external criterion
Types:
Concurrent validity - comparing performance to an established external criterion at the same time (i.e., take a math test then take an IQ test after
Predictive - does measure predict what we think it should (i.e., does the SAT predict success in college)
Construct validity
Are you capturing the theoretical meaning of the variable? Is the operational definition measuring what its supposed to?
Types:
Convergent validity
If the measure relates in predicted ways to other theoretically related variables
Discriminant validity
The measure should not be related to non-related variables
Face validity
The measure (i.e., the questions) are obvious to what is being measured
Validity of studies
Internal Validity
the validity/accuracy of the conclusions within the study
External Validity
Degree to which your results can be generalized
Accuracy of Observations
Reactivity - knowing you are being observed changes your behavior
Reduce by…
Habituate participants to observer
Participant observer
Disguise observation
Non-reactive measures
Observer Bias
Reduce by…
Not telling people what they’re coding for (blind coding)
Data types / Scales of Measurement
Nominal
Categories
No numerical or quantitative properties
Ordinal
Categories with rank orders
E.g. Likert-type scales, movie ratings
Interval
Differences between scale points are meaningful
No true absence of variable being measured (no zero point)
E.g. temperature, IQ
Ratio
Differences between scale points are meaningful
Scale has a zero point
E.g. height, reaction time
Between-groups design
Requirements
Two or more equivalent groups
Participants undergo one level of the IV
Random sampling and assignment
Might include a pre-test to make sure the groups are the same
Advantages
Avoid carry-over effects
Disadvantages
Need a lot of people (issue power)
Need to ensure the groups are equivalent
Methods
Experiment
Quasi-experiment
Cross-sectional using participant variables
Cross-sequential
Example
Testing the effects of listening to music on studying
Group 1: study with music
Group 2: study in silence
Within-groups design
Requirements
Single group
Participants undergo every level of IV
Need to do a post-test after each level of the independent variable
Random sampling, but no random assignment
Advantages
Don’t need as many participants
Greater statistical power
Disadvantages
Carryover or order effects
Methods
Longitudinal
Cross-sequential
Anything with repeated measures
Example
Testing the effects of listening to music on studying
Participants study in silence, then study with music; posttest after each
Carryover or Order Effects
Practice effects
better over time
Fatigue effects
tired over time
Facilitation and interference
specific previous experience has an effect on performance
Ecological validity
the degree to which the findings of a study can be generalized to real-world, natural settings
Operational definition
Define the variable in terms of observations / techniques the uses to measure and evaluate the variable
helps narrow down the topic
helps communicate ideas
makes something abstract more concrete
Absence of a grand unification theory of psychology
There is no one theory that explains everything in psychology
Scientific method
Research that is not based on faith or a single person’s experience
Steps:
Question/hypothesis
Testing hypothesis
Interpreting results
Modifying hypothesis
Main effects
The effect of one independent variable on the dependent variable
Regardless of the 2nd independent variable (isolation)
To calculate…
Is there a difference in the averages
Interaction
How do the independent variables relate to each other?
Interactions qualify main effects
If we have interaction, don’t interpret main effect
The two independent variables depend on each other to predict the dependent variable
Choosing within or between designs
use between when carry over effects can’t be reversed
use within if carry over effects can be reversed
use within if you need greater statistical power
Levels of an independent variable
2 levels of an IV → always a linear relation
More than 2, can be curvilinear
Multiple independent variables
Factorial design
All levels of each IV are combined with all the levels of the other IVs
Data Measurement - Nominal Scale
Description
Categories
No numerical or quantitative properties
Example
Sex (male or female)
College major
Presence / absent of behavior
Statistical test
Chi-square
Relations between variables
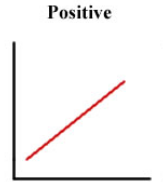
Positive
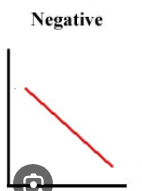
Negative
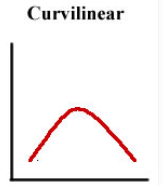
Curvilinear
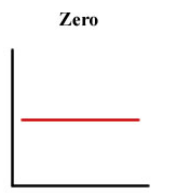
No relation
Positive relation between variables
As one variable increases, so does the other variable
Negative relation between variables
As one variable increases, the second variable decreases
Curvilinear relation between variables
As one variable increases, so does the other variable, but only up to a certain point, after which, as one variable continues to increase, the other decreases
No relation between variables
The increase or decrease of one variable does not affect the other variable
Correlational variables
Variables that have a relationship, but one does not cause the other