AP Stats - Collecting Data / Sampling
1/44
There's no tags or description
Looks like no tags are added yet.
Name | Mastery | Learn | Test | Matching | Spaced | Call with Kai |
|---|
No analytics yet
Send a link to your students to track their progress
45 Terms
Why do we sample?
Sampling is used when we cannot reach the entire population
Population
an entire group of individuals we want information about
Parameters
values about the population
Sample
a subset of individuals from the population
Statistics
values from the sample
Bias
when we consistently over or underestimate the PARAMETER
Voluntary Response Sampling Bias
When people choose to respond, people with stronger opinions are most likely to take time to respond
Ex. people are more likely to leave a mad review than a good one because they are upset about damage, etc.
Convenience Sampling Bias
Choosing individuals that are easy to reach. This can eliminate subgroups from a population
Ex. If you sit outside a class before lunch and ask the first people to leave how hungry they are
Undercoverage Bias
Some groups of a population are left out in the sample
Ex. If you call people during the day and ask how much free time they have, you are leaving out the people who are working
Non-response Bias
Individual chosen cannot be contacted or does not cooperate
Ex. Sending out an email, don’t get responses
Response Bias
When interviewed, people will lie
Ex. If you are asked how much you speed by a police officer, you will say never
Simple Random Sampling (SRS)
A sample in which every group of a given size has an equal chance of being chosen. This means that every individual in the population has an equal chance of being selected for the sample, and that the sample is representative of the overall population.
Assign each individual a number
Use a random number generator (RNG) to generate a numbers with a size n
Correspond numbers to individuals
Strata
groups of individuals in a population who share characteristics thought to be associated with the variables being measured in a study
Stratified Random Sample
Dividing individuals into strata, number the individuals in the group, and randomly select a few from each strata ex →
Dividing high school into classes
Randomly select 20 from each grade
Cluster Sampling
Dividing into groups or strata, numbering each strata, and randomly selecting an entire strata
Systematic Random Sampling
Selecting every nth individual
Multi-stage Sampling
A combination of the various sampling methods
If the population is the same use…
…use an SRS
If the population is not the same (heterogeneous) use…
…use a different sampling method
Observational Study
a research method where the researcher observes and records behavior or outcomes without manipulating any variables. This type of study is crucial for understanding relationships between variables in real-world settings, helping researchers identify patterns and trends without the interference of experimental controls.
Experiment
A method of research where the researcher manipulates one or more variables to determine their effect on a dependent variable.
Prospective Study
looking at the future (ex. watching a group of people for a long time to see their response to a drug)
Retrospective Study
looking at the past (ex. looking at what cancer patients were exposed to)
Experimental Units
individuals in which the experiment is done to (if human, called subjects)
Explanatory Variable
The variable manipulated by the researcher. What you are doing to the experimental units
Factors
Another word for the explanatory variable. What you are doing to the experimental units
Levels
How you will break down the factors; the ways of measurement
Treatments
Each individual combination of factors and levels
Response Variable
The outcomes that are measured after the treatments have been administered
Confounding Variables
Any variable that are not a part of the experiment but could have an effect on the results
What makes a good experiment?
Control
Replication
Randomization
Control
controlling all outside variables that could affect results… keep as much the same as possible outside the variable; we use a control group within an experiment for comparison.
Replication
repeat on many subjects or many times to eliminate chance
Randomization
randomly select people fo groups, randomly select order of treatments; use this to create roughly equivalent groups before treatments are imposed for comparison purposes
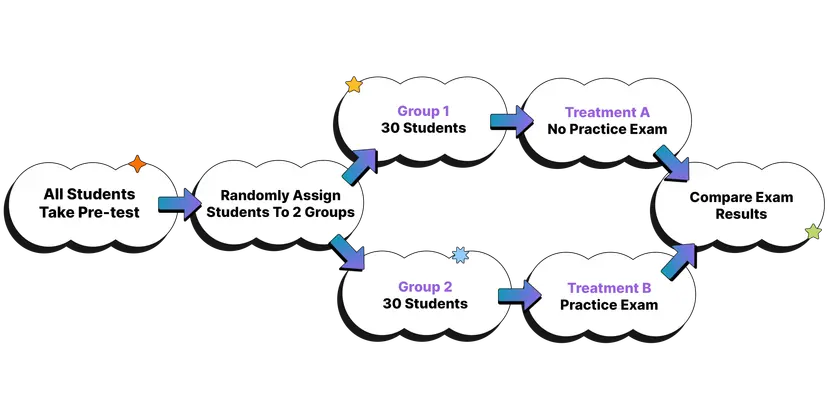
Completely Randomized Design
Experimental units are assigned to the treatments completely by chance. Assignment of treatment to the groups must be random. The group sizes won’t always be exactly even. This is the simplest statistical design for experiments but when there are clear distinctions or similarities within the chosen experimental units, that’s when you need a more specific experimental design.
Blocking
Treatments are assigned completely at random within each group; Used to control confounding variables. By dividing the units into groups based on one or more blocking variables, researchers can ensure that the units within each block are similar to each other with respect to these variables.
Matched Pairs
Subjects are arranged in pairs that are matched on relevant factors, such as age, gender, or other characteristics; each pair receives both treatments in a random order. This allows the researcher to compare the responses of the subjects to the two treatments and to determine the effects of the treatments on the response variable.
Single Blind Study
Where the subject doesn’t know what treatment they are receiving
Double Blind Study
Neither subject nor researcher knows what treatment they are receiving
When to use SRS
You have a complete sampling frame (a list of every unit).
The population is fairly homogeneous or you don’t need guaranteed subgroup representation.
Pros: unbiased, easy to analyze, conceptually simple.
Cons: can be expensive or impractical for widely spread populations; may miss small subgroups.
When to use Stratified Random Sampling
You want precise estimates for known subgroups (strata)
Strata are internally similar but differ from each other.
Pros: increases precision (lower variance) if strata differ; ensures subgroup representation.
Cons: needs strata info ahead of time and careful allocation.
When to use Cluster Sampling
Population naturally grouped (clusters) and travel/cost/time make sampling individuals across all clusters impractical.
You can sample clusters (e.g., schools, villages) and then sample within them.
Pros: cost-efficient and practical for large, geographically spread populations.
Cons: clusters are often similar within and different between → higher variance (design effect >1). Needs larger sample sizes to match SRS precision.
When to use Systematic Sampling
You have a list (sampling frame) and want a simple, fast method — pick every k-th item after a random start.
Pros: easier and faster than SRS; good spread across frame.
Cons: dangerous if the list has periodic patterns that align with the sampling interval (creates bias).
Sampling Variability
natural variation in sample statistics that occurs when different samples are drawn from the same population
Large sample sizes…
…results in smaller sampling variability, making estimates more stable and reliable