Correlation and regression
1/36
There's no tags or description
Looks like no tags are added yet.
Name | Mastery | Learn | Test | Matching | Spaced |
|---|
No study sessions yet.
37 Terms
Partial correlation
The correlation between two variables after removing (or partialing out) the common effects of a third variable.
Pearson Correlation
Looks for an overall relationship
Regression
Uses on variable to predict the other
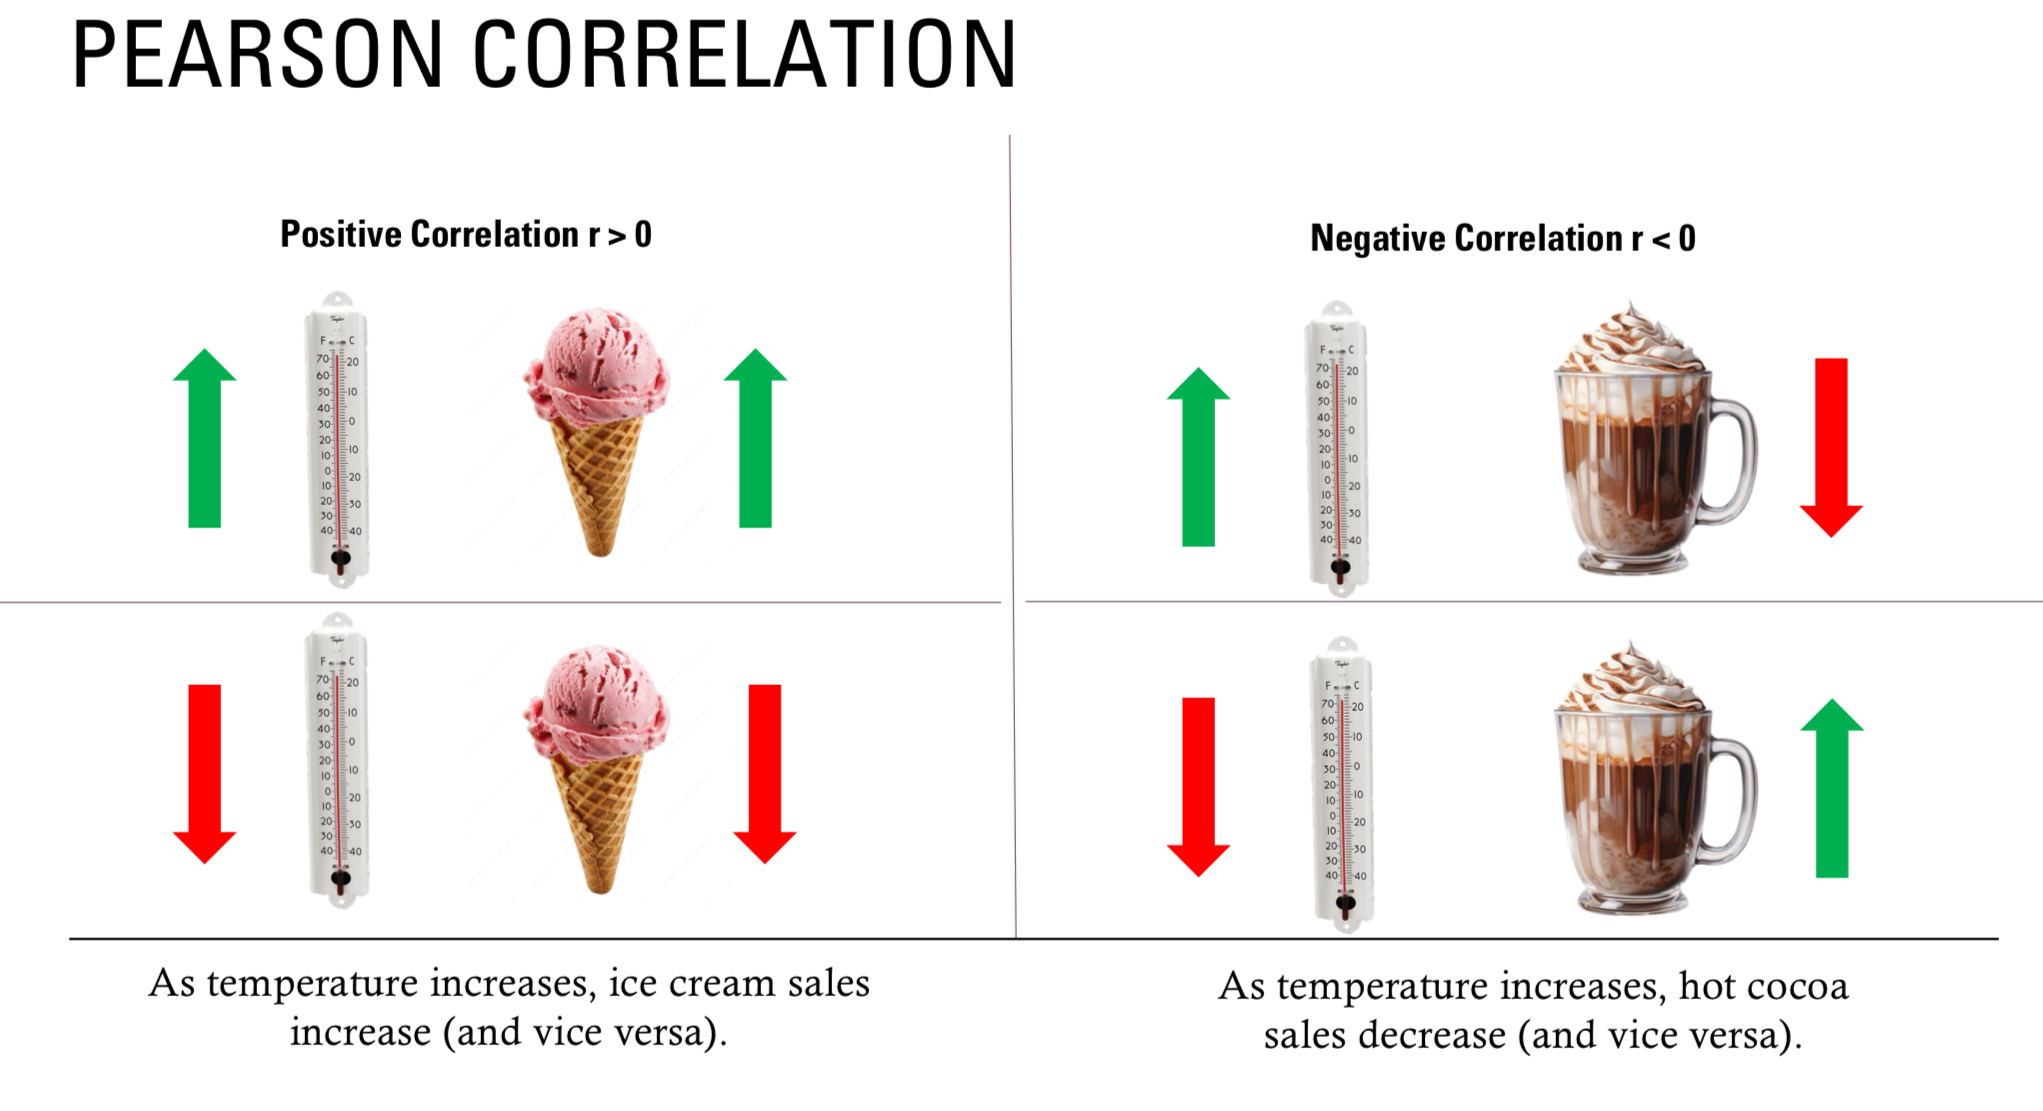
Pearson r
Measures a relationship between two continuous variables
What is ‘ r ‘ range?
-1.0 to 1.0
The size of r indicates its _____
strength; r = 0 means no relationship while ±1 is a perfect relationship
The sign of r indicates its ____
direction; r > 0: As X increases, Y increases & r < 0: As X increases, Y decreases
What are ranges of r?
r = 1: PERFECT CORRELATION
r= .50: STRONG CORRELATION
r = .30: MODERATE CORRELATION
r = .10: WEAK CORRELATION
r = 0: NO CORRELATION
r = .-10: WEAK NEGATIVE CORRELATION
г = .-30: MODERATE NEGATIVE CORRELATION
r = .-50: STRONG NEGATIVE CORRELATION
r = -1: PERFECT NEGATIVE CORRELATION
What is the df for r critical?
N - 2
If calculated r is larger than r critical
you have a significant correlation
What do you need from you data set to calculate pearson’s r
X values
Y values
(X)(Y) values
X2
Y2
∑X
∑Y
∑X2
∑Y2
∑(X)(Y)
Steps for writing an APA results section for a Pearson correlation
State the analysis – Mention that a Pearson correlation was conducted.
Identify variables – Clearly specify the two variables being analyzed (e.g., quiz average and IQ score).
State the hypothesis – Indicate whether a positive or negative correlation was expected.
Report the results – Provide the correlation coefficient (r), degrees of freedom (df), and p-value.
Interpret the results – Explain whether the correlation was significant and its strength (e.g., strong, moderate, weak).
Link to hypothesis – State whether the results support or contradict the hypothesis.
Pearson correlation was run to determine the relationship between students’ quiz average and their IQ score. We hypothesized there would be a significant positive correlation. In line with our hypothesis, the results revealed a strong positive correlation, r(6) = .87, p < .05. { r(df) = calc r, p < pvalue}.
What is a partial correlation?
The correlation between two variables after removing (or partial out) the common effects of a third variables
‘The correlation between students’ quiz scores and IQ after partialing out for amount of study hours.’
what this the df for a partial correlation
N - 3
Steps for writing an APA results section for a partial correlation
State the sample size – Indicate the number of participants (e.g., 8 participants).
Identify the analysis – Mention that a partial Pearson correlation was conducted.
Define the variables – Specify the two main variables (e.g., IQ and quiz grades) and the controlled variable (e.g., study time).
State the hypothesis – Describe the expected relationship (e.g., a significant positive correlation).
Report the results – Include the correlation coefficient (r), degrees of freedom (df), and p-value.
Interpret the findings – Explain whether the hypothesis was supported and what the results suggest.
In a sample of 8 participants, a partial Pearson correlation was conducted to examine the relationship between IQ and students’ average quiz grade in a course, while controlling for the average amount of time they spent studying. It was expected that there would be a significantly positive correlation between IQ and students’ average quiz grade even after controlling for time spent studying. This hypothesis was supported, r(5) = .85, p < .05. { r(df) = calc r, p < p value
What is the linear regression formula
ŷ = a + β(x)
What is ŷ
Predicted value. Gives us an expected value of the dependent variable, Y, but not the actual Y value
What is a and how do you solve for it
A is the intercept. It is the predicted value of Y when X=0.
To solve for a: a = ŷ - β(x̄)
On a graph: Point on line where X=0
What is β
β is the slope. It tells us how much we expect Y to change each time X increases by 1.
What is X?
X is a singular X score we can use to predict their predicted Y score
How do you calculate prediction error?
Y - ŷ = e
When does a prediction error occur? What is its letter?
When out predictions don’t align with the actual data; e
What does a positive prediction error mean?
We overestimated a predicted value
What does a negative prediction error mean?
We underestimated a predicted value
What is the coefficient of determination?
The proportion of variance in Y explained by X; r2
r2 uses the r of persons correlation
r2= .72; 72% of the variance in sentence length is explained by the number of prior convictions a defendant has.
What is the coefficient of non-determination?
The proportion of variability not accounted for by X; 1 - r2
1 - r2 ; 1 - .72= 28; 28% of the variance is sentence length is the result of other factors.
How do you calculate F to see if variance is significant?
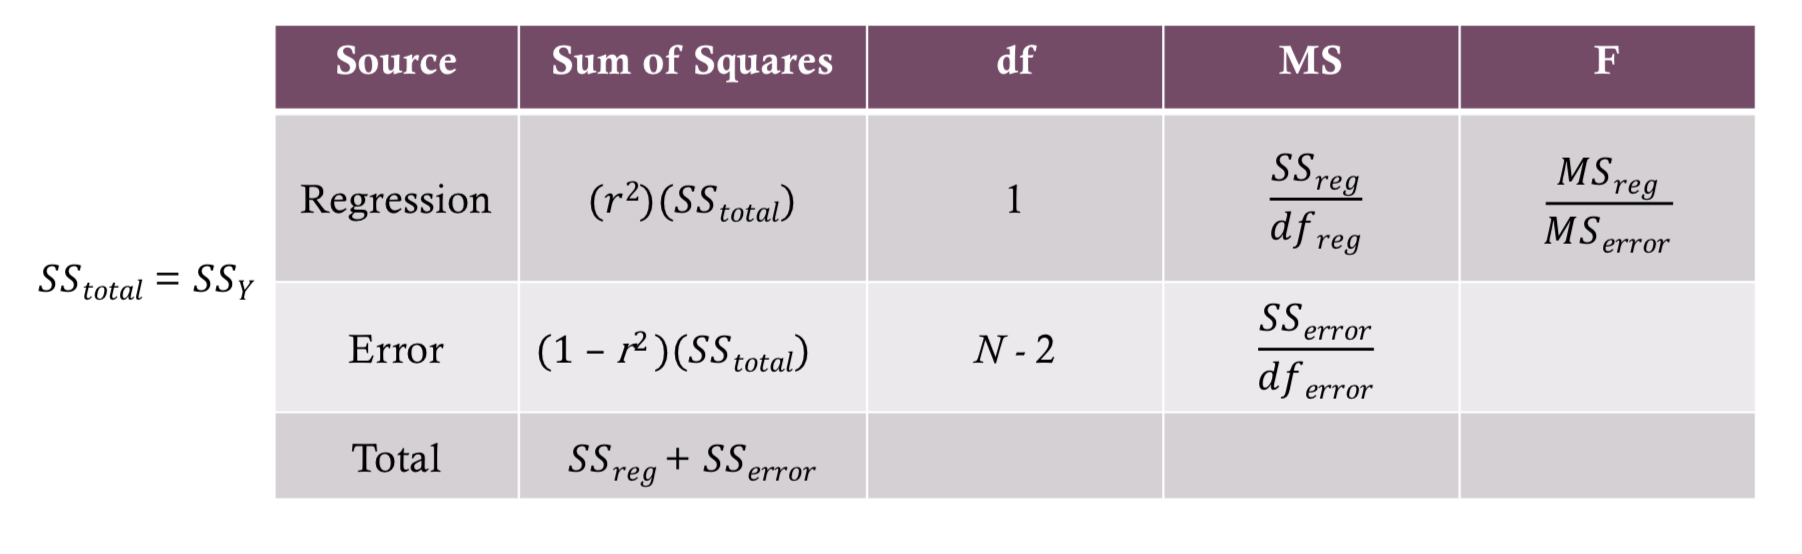
How to find F critical for variance?
(1, df of error [N-2] )
If calculated F is _____ then we have _____ variance
larger ; significant
Steps for writing an APA results section for a simple linear regression
Back
State the analysis – Mention that a simple linear regression was conducted.
Identify the predictor and outcome variables – Specify what was being predicted (e.g., sentencing length) and the predictor variable (e.g., prior convictions).
State the sample size – Indicate the number of participants or cases (e.g., 10 defendants).
Report the results – Include the R² value, F statistic with degrees of freedom, and p-value.
Interpret the findings – Explain whether the predictor variable significantly influenced the outcome.
Link to hypothesis – State whether the results supported the expected relationship (e.g., more prior convictions predicted longer sentences).
A simple linear regression analysis was used to determine whether prior convictions predicted the sentencing length of 10 defendants. The results indicated that having more prior convictions significantly predicted a longer sentence, r2 = .72, F(1, 8) = 20.57, p < .05.
Why don’t we run several simple linear regression instead of one multiple regression
It allows us to analyze the relationship between a dependent variable and multiple independent variables simultaneously, accounting for potential interactions and correlations between predictors.
What is multicollinearity?
We don’t want our predictors to correlate too much with one another sp, When predictors are unnecessary, it will make our model less reliable
Example: People who exercise more often may tend to eat fast food less often and vice versa
What are the types of regressions?
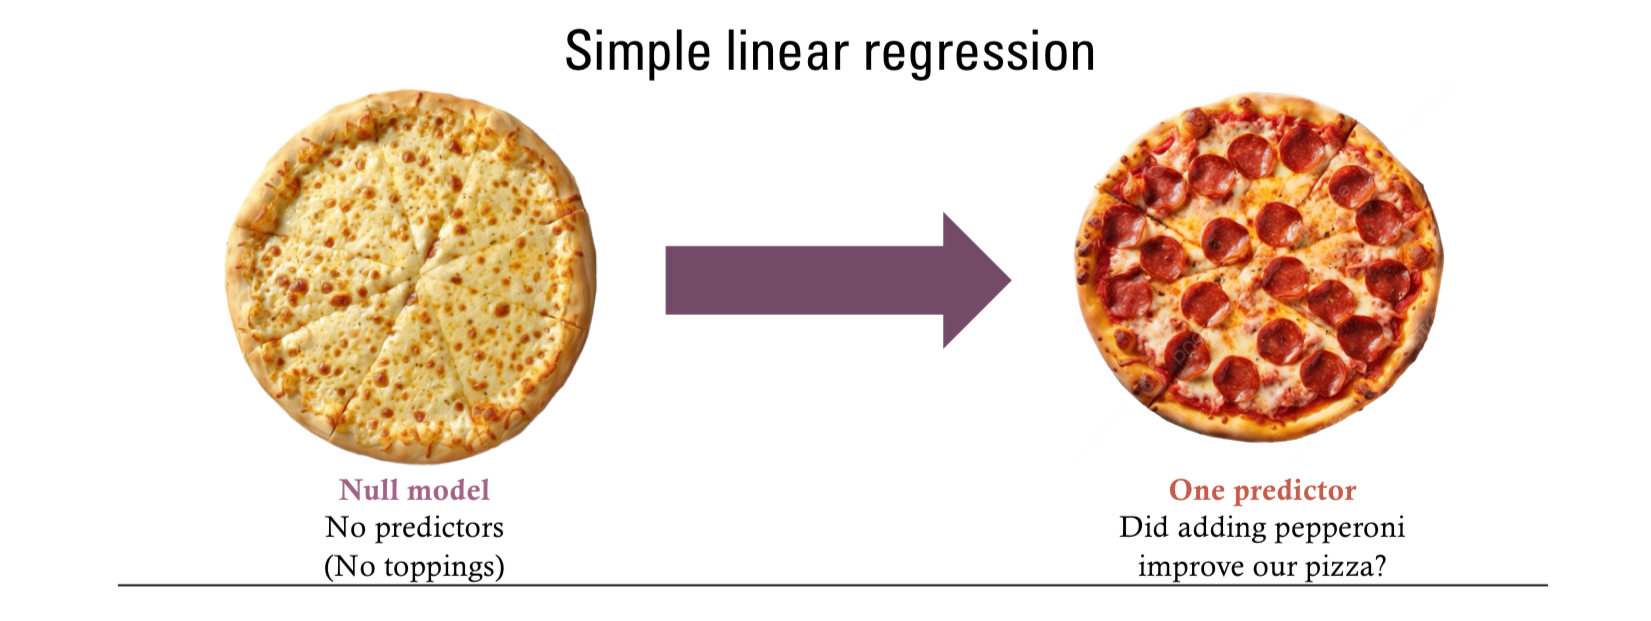
Simple linear regression
Multiple regression
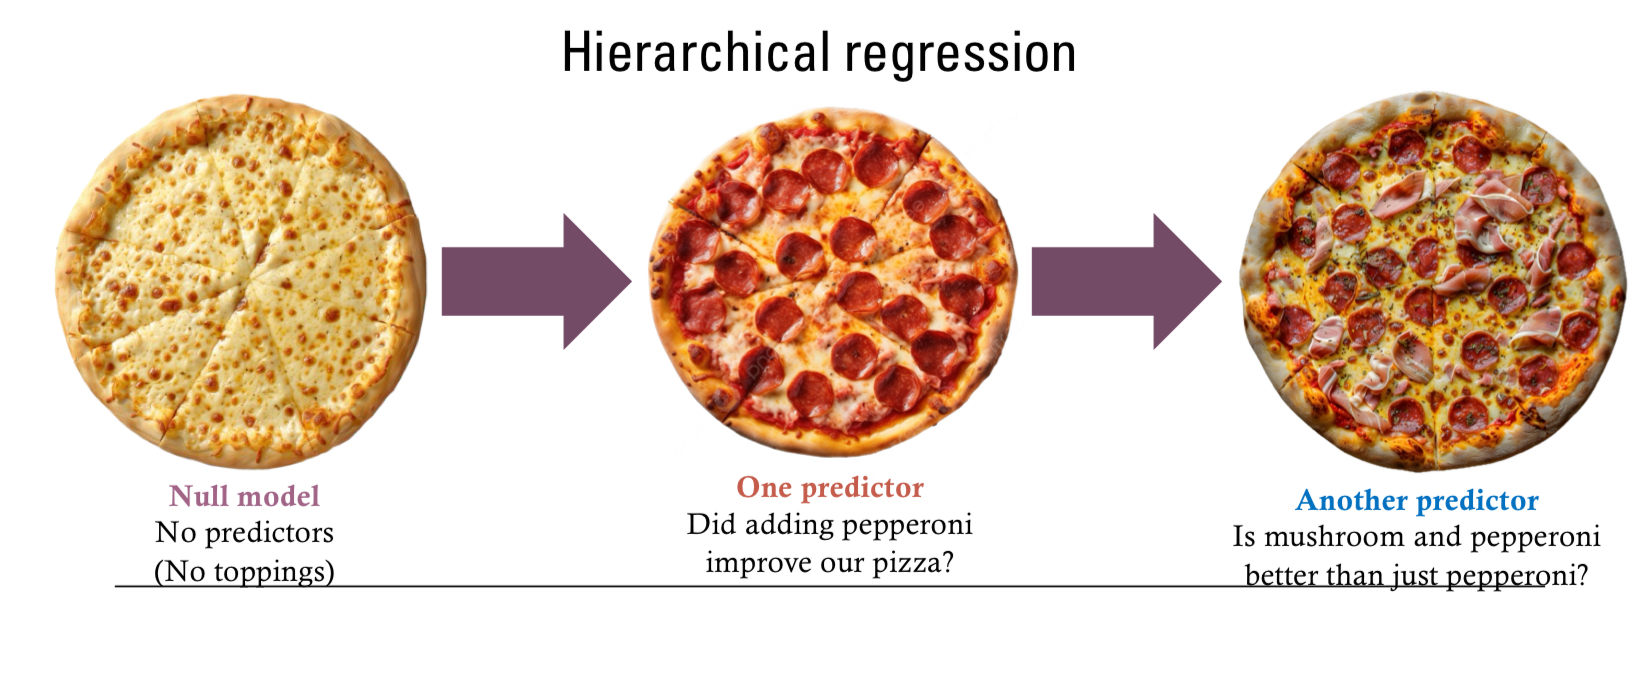
Hierarchical regression
Simple linear regression
Did adding one predictor to a null model of no predictors improve our …
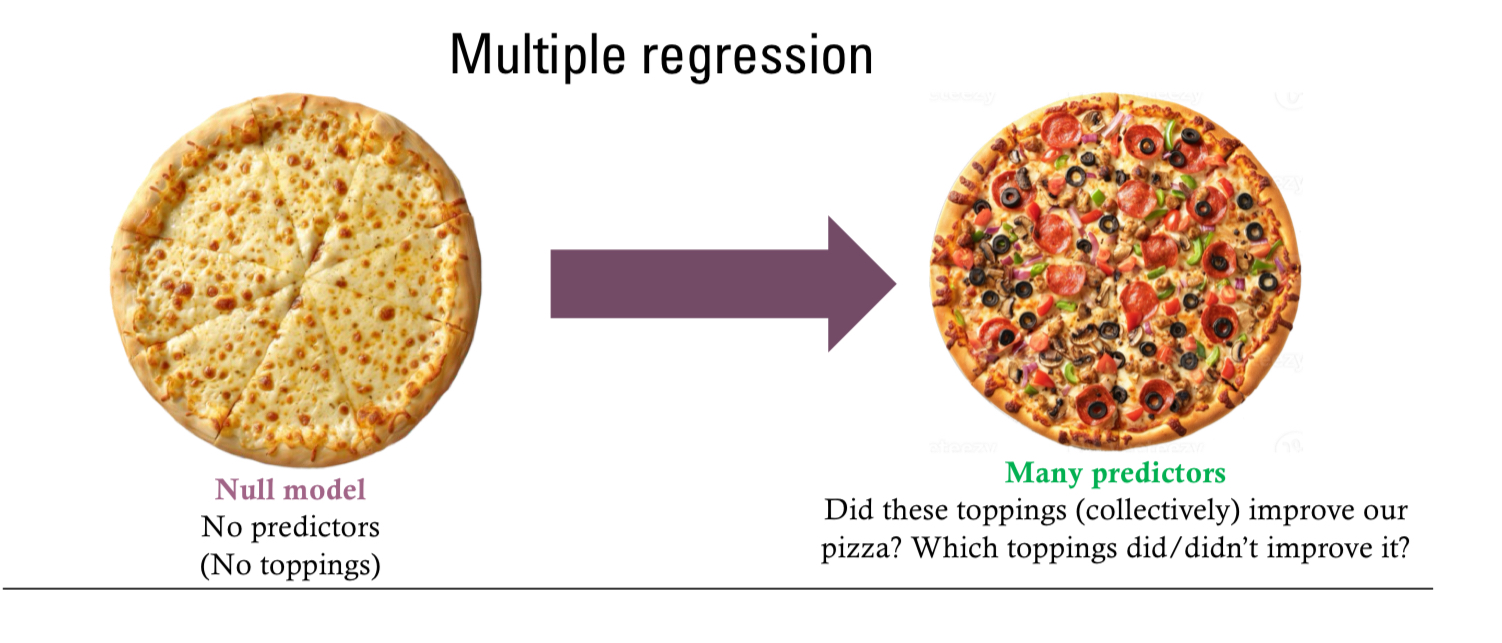
Multiple regression
Did adding many predictors to a null model of no predictors improve our …
Hierarchical regression
Did adding one predictor a null model of no predictors improve our … then did adding another predictor improve our …