Stats Unit 1
1/73
There's no tags or description
Looks like no tags are added yet.
Name | Mastery | Learn | Test | Matching | Spaced |
|---|
No study sessions yet.
74 Terms
research
the systematic investigation into and study of materials and sources to establish facts and reach conclusions
observational research
investigator measures relationships between events or conditions but does not manipulate or intervene
experimental research
investigator directly manipulates conditions (cause) to measure the response (effect)
data
results of repeated measurements
data must be
reliable, valid, objective
discrete variables
limited to certain values; counted
continuous variables
can theoretically assume any value; measured
nominal scale
mutually exclusive categories, no logical order
ordinal scale
logical order, but no indication of size of difference (rank order)
interval scale
equal intervals, but no “absolute” zero
ratio scale
equal intervals and an “absolute” zero
intervening/confounding variables
uncontrolled variables that influence dependent variables
internal validity
result observed in the DV is entirely due to the treatment
ways to achieve internal validity
use a control group, minimize instrument error, minimize investigator error
external validity
the result can be generalized to the wider world
ways to achieve external validity
random sampling and do not control everything
sample
a portion of the larger population that is assumed to represent the population
random sample
each member of the population has an equal chance of being selected
stratified sample
ensure representation of subgroups within the population of interest
convenience sample
members are selected based on “ease and proximity”
parameter
characteristic of a population; set limits to study
statistic (object)
sample characteristic used to estimate a parameter of the population
statistics (field)
science of inferring proportions in a population from a representative sample
percentiles
provide a comparison to the range of scores/characteristics obtained from the larger sample or population
percentiles purpose
allow for evaluation of raw scores and comparison between different units of measurements
probability
the long-run proportion of a particular outcome
classical probability
the likelihood of a prticular outcome within a finite set of mutually exclusive, equally likely possible outcomes
frequentist probability
the long-run tendency toward a particular outcome within many trials
p-value
the likelihood that the resolts are due entirely to chance
subjective probability
based on a degree of belief
measures of central tendency (def)
values that describe the middle characteristics of a dataset
measures of central tendency
mean, median, mode
when to use the mean
interval and ratio data type with no skew/outliers
median
the middle score in a ranked ordered list of scores; splits the dataset into equal halves
when to use median
ratio, interval, and ordinal data types that is skewed/ has outliers
mode
score that occurs most frequently
when to use mode
nominal or ordinal data
measures of variability (def)
quantify the dispersion or spread within a dataset
measures of variability
range, IQR, variance, standard deviation
when to use range
interval and ratio data
limitations to range
sensitive to outliers, says nothing about pattern
when to use IQR
ordinal, interval, and ratio data (heavily skewed)
limitations to IQR
says nothing about the pattern
standard deviation
square root of the sample variance
when to use SD
interval and ratio data
coefficient of variation
percentage that allows comparison of variability between different variables
central limit theorem
the distribution of sample means will be normally distributed, regardless of the original population's distribution, as long as the sample size is sufficiently large
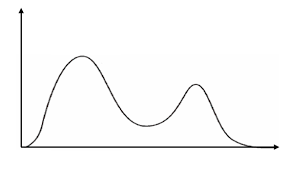
bimodal distribution
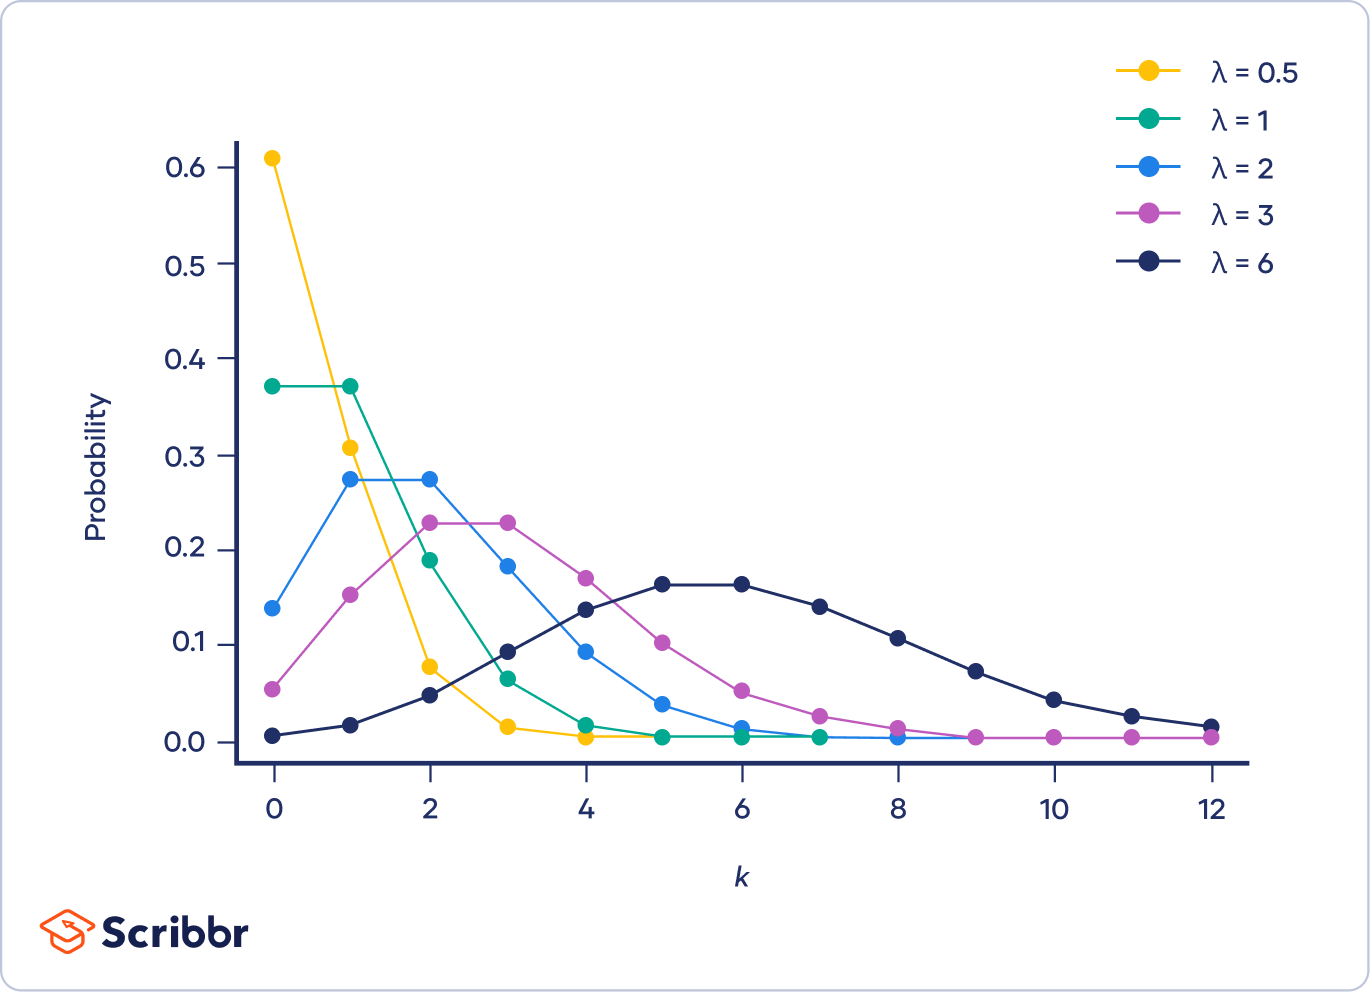
poisson distribution
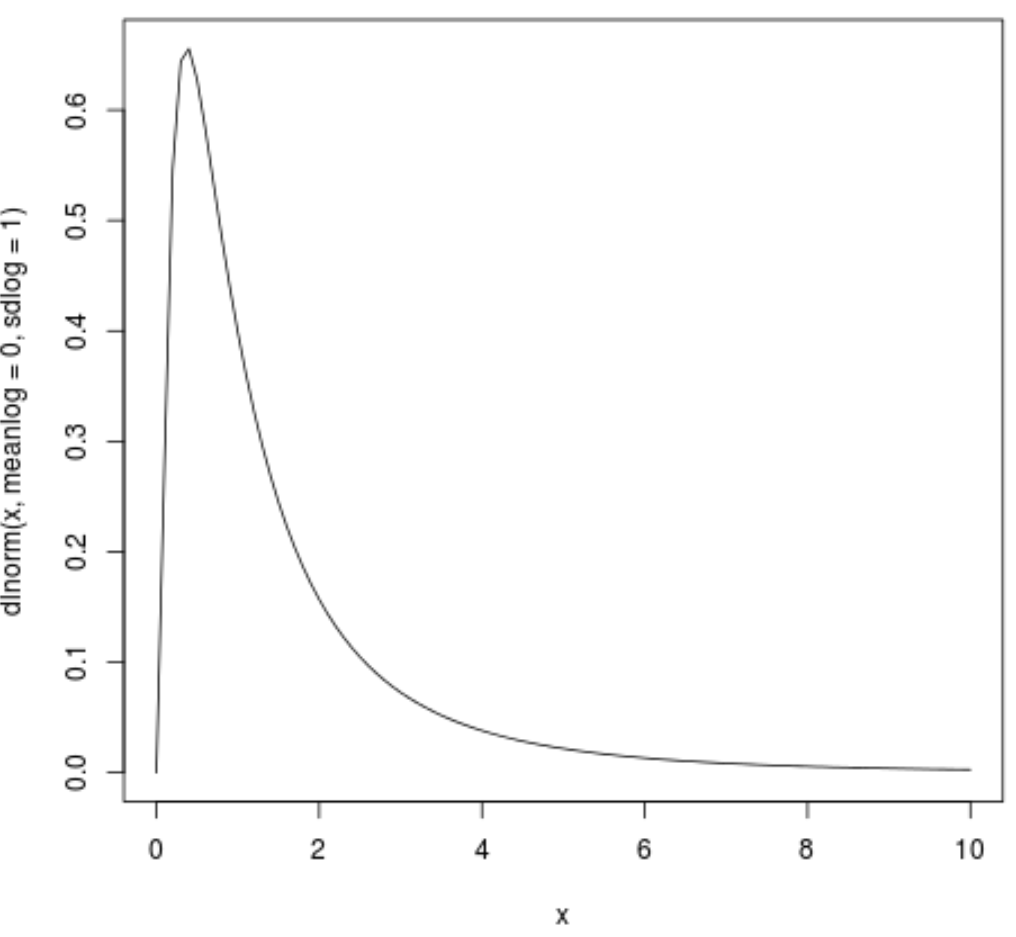
log normal distribution
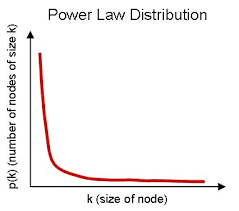
power law
standard scores
scores derived from raw data with a known basis for comparison
what to use standard scores for
compare between datasets with different units
Z-scores
express the raw score in standard deviation units
T-scores
converted z-score to be more intuitive
skewness
asymmetry of distribution
positive skew
mode is shifted leftward
negative skew
mode is shifted rightward
how to convert skewness scores to z-scores
divide skewness by standard error
normal skewness z-score
±1.96
kurtosis
the “steepness” of the distribution
platykurtic
wide range of scores, low concentration around mean
leptokurtic
narrow range, high concentration around mean
mesokurtic
moderate range, moderate concentration around mean
more variability means
greater difference in means needed to achieve significant differences
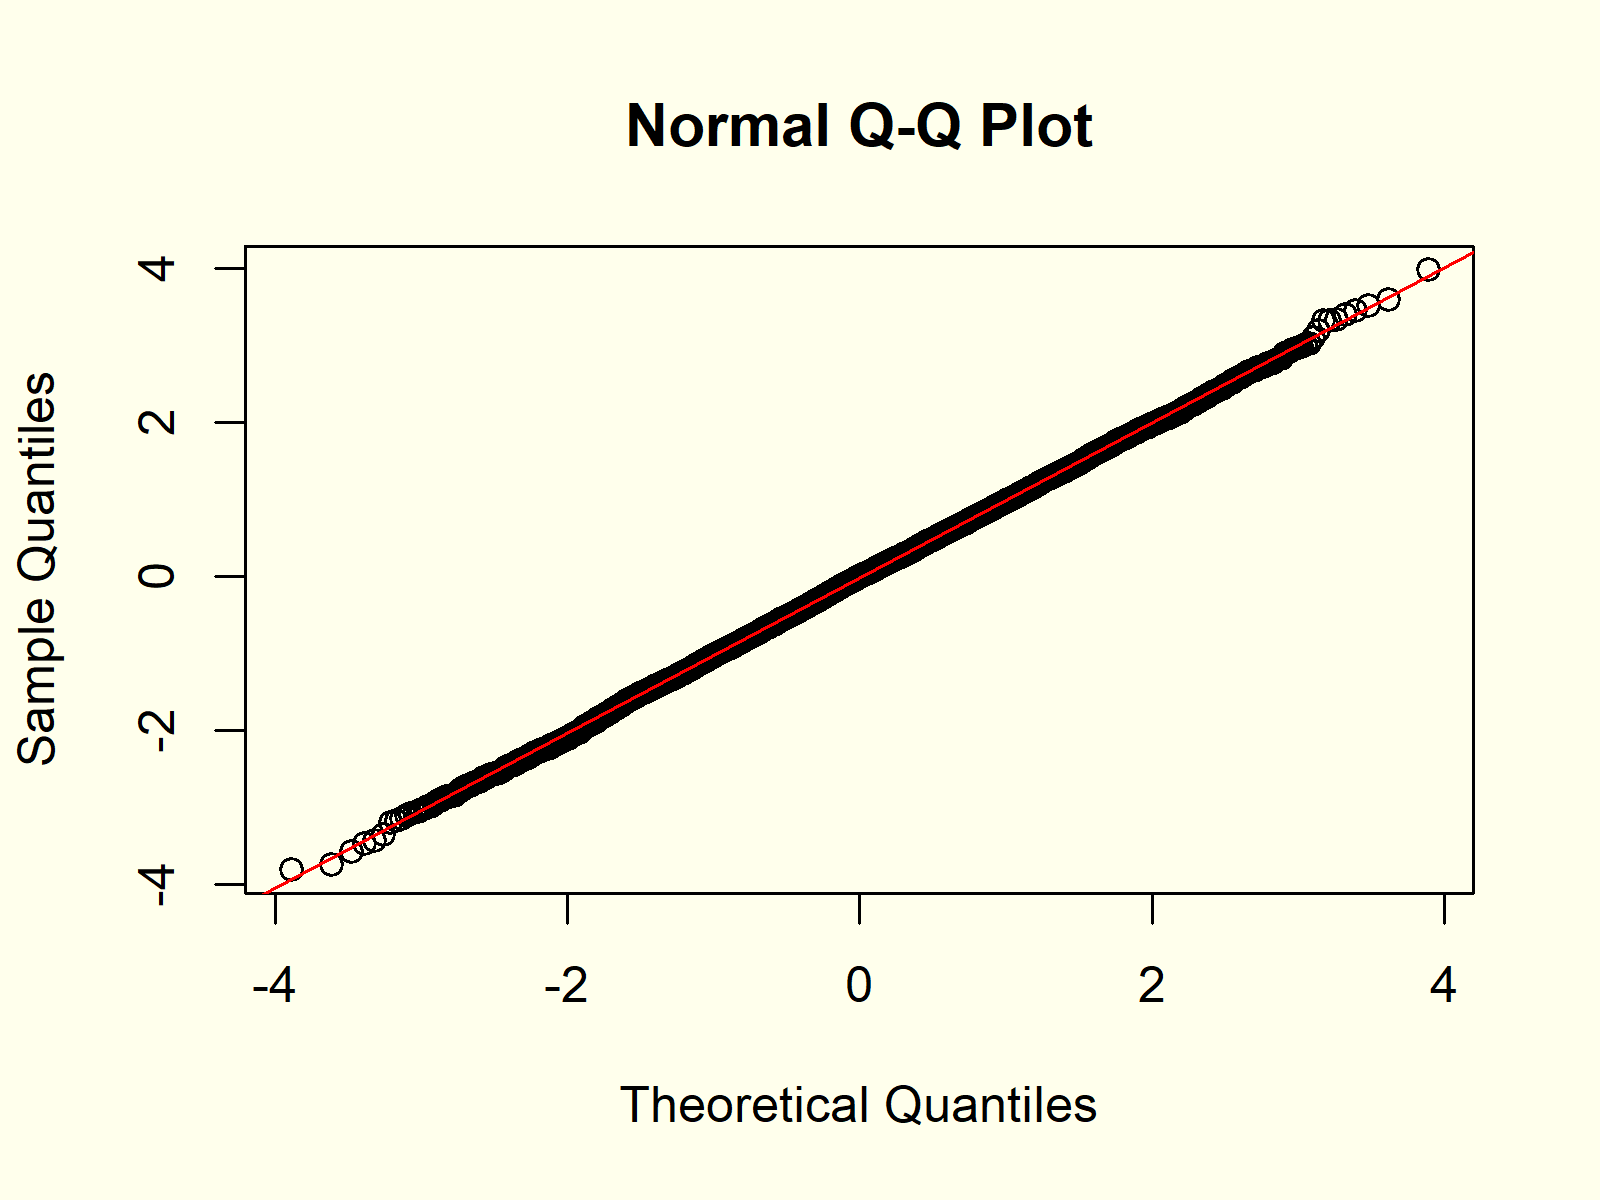
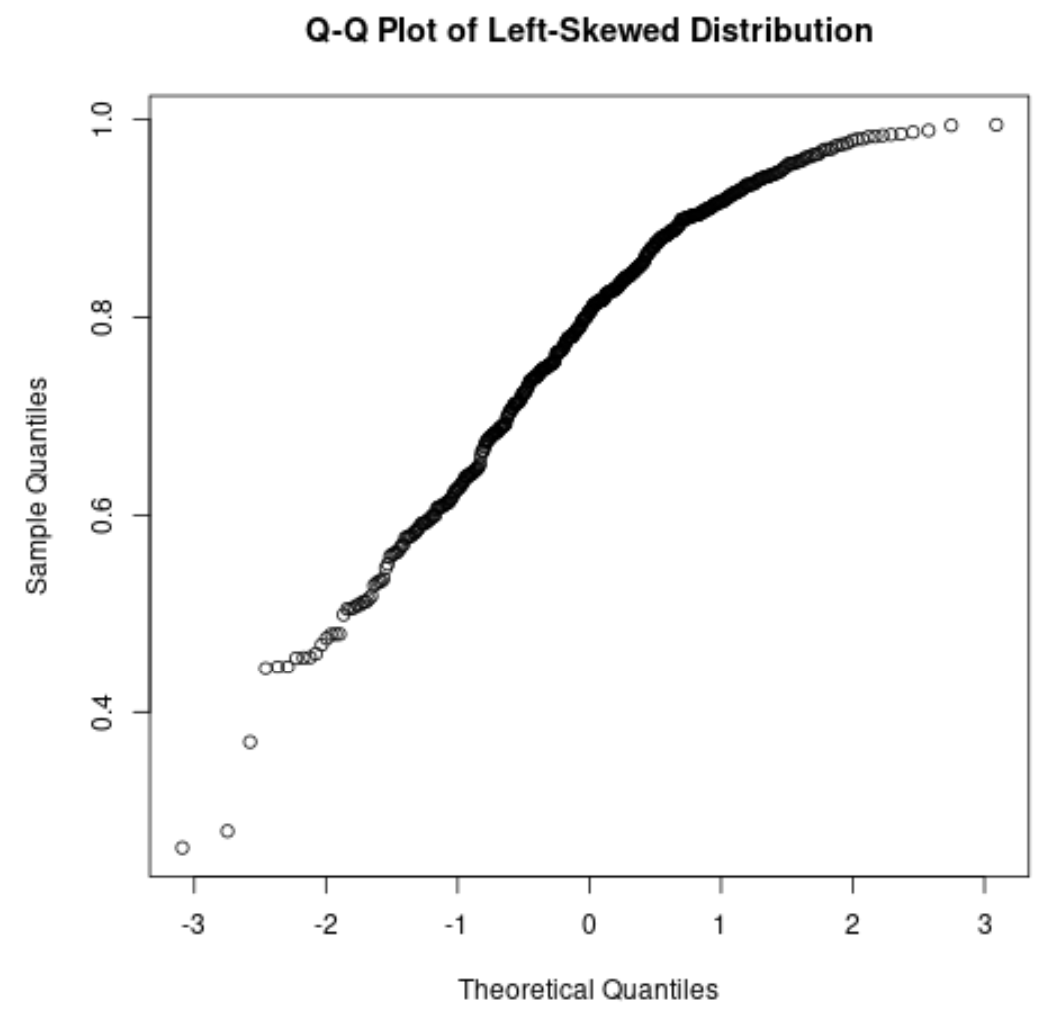
Q-Q plots
plots the quantiles of the dataset against the theoretical quantiles of a normal distribution
normal Q-Q plot
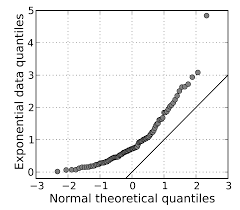
skewed to the right Q-Q plot
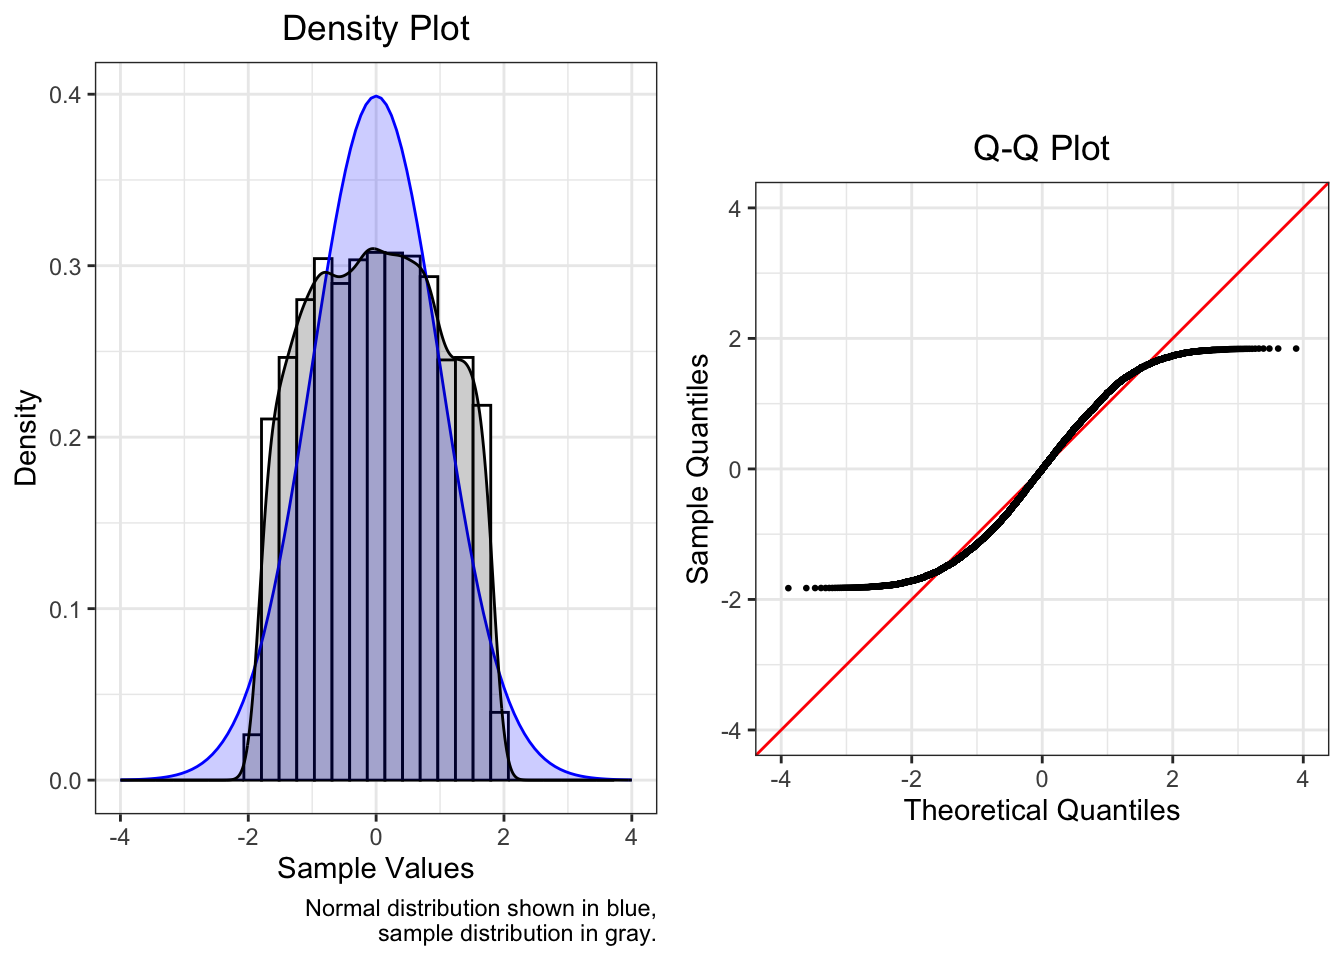
heavy tail (platykurtic) Q-Q plot
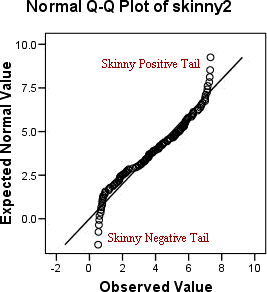
light tails (leptokurtic) Q-Q plot
skewed to the left Q-Q plot
Shapiro-Wilk and Kolmogorov-Smirnov tests
tests that sample does not follow normal distribution
when to use K-S test
samples > 50
when to use S-W test
samples < 50