water engineering mid 1
1/148
There's no tags or description
Looks like no tags are added yet.
Name | Mastery | Learn | Test | Matching | Spaced |
|---|
No study sessions yet.
149 Terms
challenges with clean water
diminishing sources
contamination
conservation
qanats
Persia - 700 BC
channels/tunnels for supply groundwater to cities / towns

aquaducts
Rome - 300 BC

stairway of fountains
inca - 1450 AD

2000 BC Greece and India
treating drinking water necessary
sand+gravel filtration, boiling
better tasting drinking water

1500 BC Egypt
discovered coagulation
applied alum for removing suspended particles
1627 francis bacon
applied sand filtration for seawater desalination
1676 antonie van leeuwenhoek
observed water microbes
1804 robert thom
designed first municipal water treatment plant in scotland
1854 john snow
applied chlorine for water disinfection - cholera
water supply
source, collection distribution
hydrology, hydraulics
pipe network analysis
sources of freshwater
surface waters - lakes, reservoirs, rivers
groundwater
sea - desalination
conservation
US, Oregon
diuron leftover before treatment and after treatment
organic compounds and materials
C, N, O, F, P, S, Cl, Br, I
inorganic chemicals and materials, heavy metals/trace elements
Na, Mg, K, Ca, Fe, Al, Hg, Pb
atomic number
ID of element, # protons
Atomic weight
weight of an atom in atomic unit (a.u.)
molecular weight
weight one molecular or compound in atomic unit
molar weight
weight of one mole of chemical species in g/mol
mole-based
counting molecules or species
mass-based
weighing molecules or species
mole
basic quantity for counting atoms, molecules, compounds
1 mole =
6.022 × 10²³ atoms or molecules
concentration
how many of an atom/molecule/compound in a given volume (i.e. density)
entities per volume
C = ni/V
mol/L or M ( or molar)
relevant for reaction stoichiometry
mass per volume
C = mi/V
mg/L, ug/m3
easy to measure (aqueous phase)
partial pressure (gas phase)
C = Pi=niRT/V (assuming ideal gas applies)
Pa, bar, atm
easy to measure (gas phase)
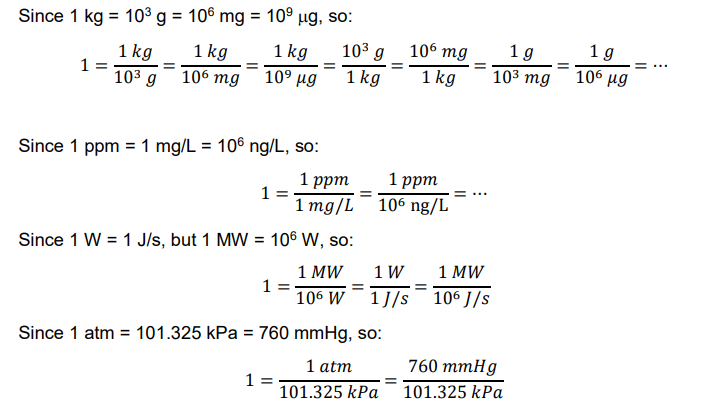
1 bar =
105 Pa = 100 kPa = 1 atm = 1.01325 bar = 760 mmHg
1 M = 1 molar = 1 mol/LE
ppm
1 part per million
1 part in 106 parts
1 ppm = 1 mg/L
ppb
1 part per billion
1 part in 109 parts
1 ppb = 1 ug/L
ppt
1 part per trillion
1 part in 1012 parts
1 ppt = 1ng/L
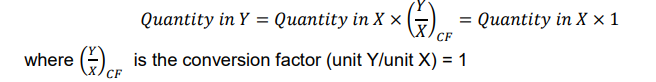
unit conversion
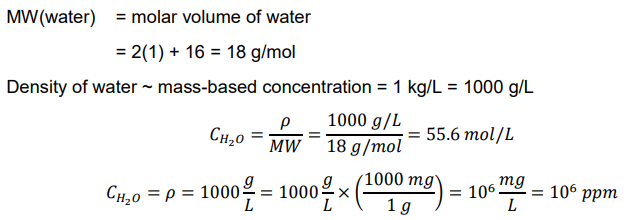
Example: Determine the concentration of water molecule (H2O) in 1 L of water in (a) mol/L and (b) mg/L
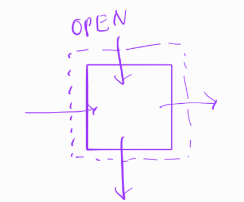
Open system
exchange of mass energy:
wastewater treatment
continuous
steady state
dynamic
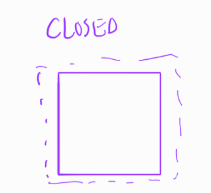
closed system
no exchange of mass/energy:
batch reactors, biological treatment/pharmaceutical
BOD/COD test
equilibrium
chemical equation
what species (reactants) change into what (products)?
stoichiometry (molar or molecular ratios)
what is reactant-product conversion ratio?
chemical equilibrium question
what is the theoretical maximum “extent” of reaction (partially converted, close to full conversion, hardly conversion)
dynamics or transient
are things changing with time or not?
homogeneous vs heterogeneous
is the reaction occurring the same everywhere (homo) or not (hetero) within system of interest
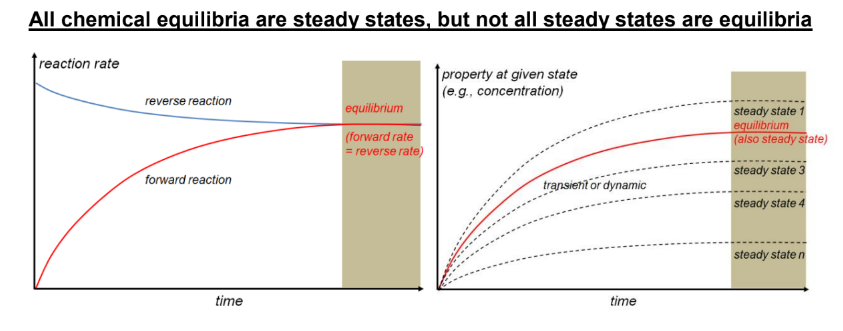
steady state question
reaction may take place at conditions such that compositions and other conditions are not changing with time
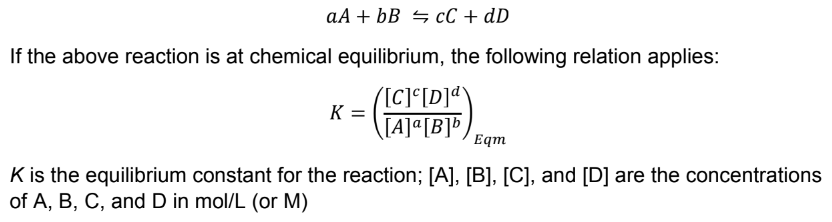
chemical reaction
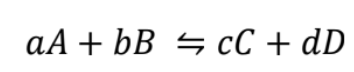
a, b, c, d are stoichiometric coefficients of A, B, C, D
A, B reactants, C, D, products
Reaction types
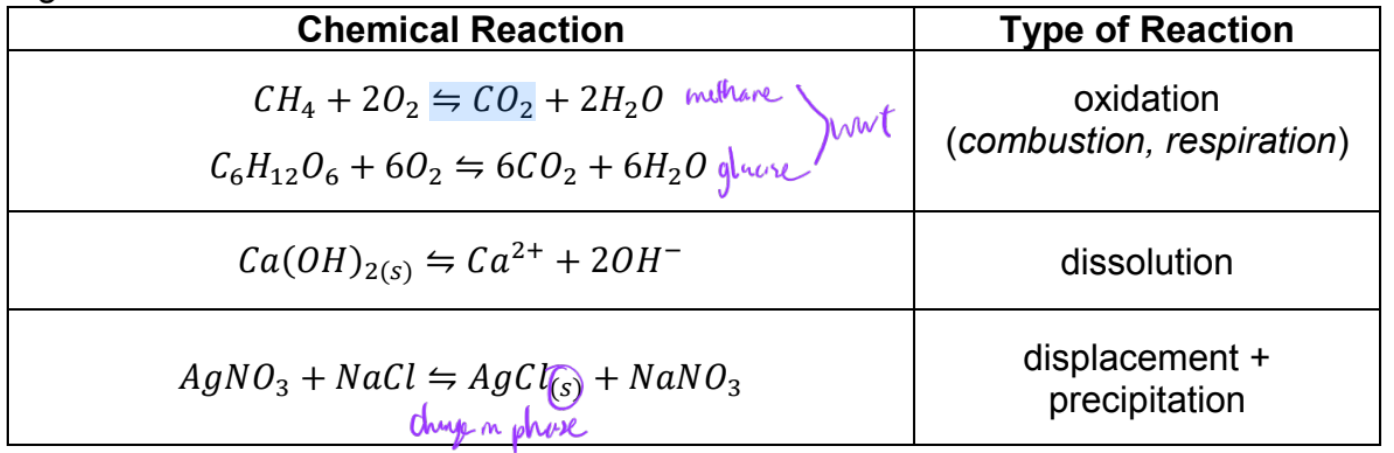
equations should be balanced with respect to atoms and charge (same number or net charge in reactant and products)
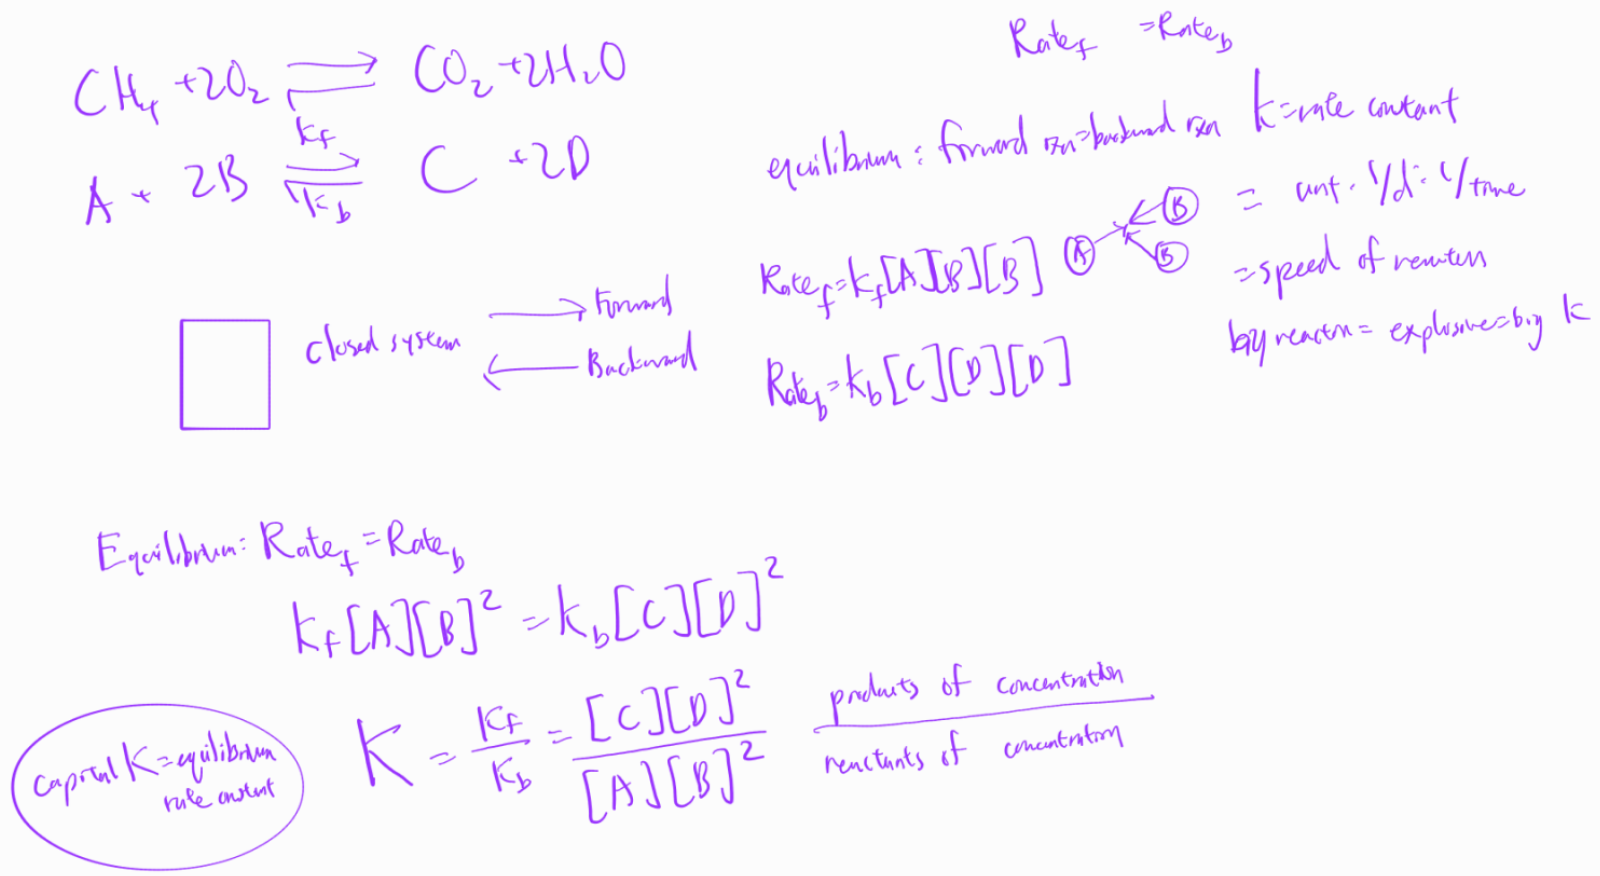
chemical equilibrium
chemical state where potential of reactants to transform into products and potential of reverse reaction equal:

chemical equilibrium rate derivation
batch reactor example

chemical reaction at equilibrium
steady state
when system properties (including composition) remain constant with respect to time

chemical equilibria vs steady state
all chemical equilibria are steady states, but not all steady states are equilibria
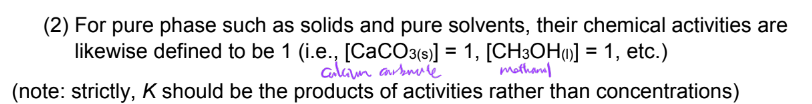
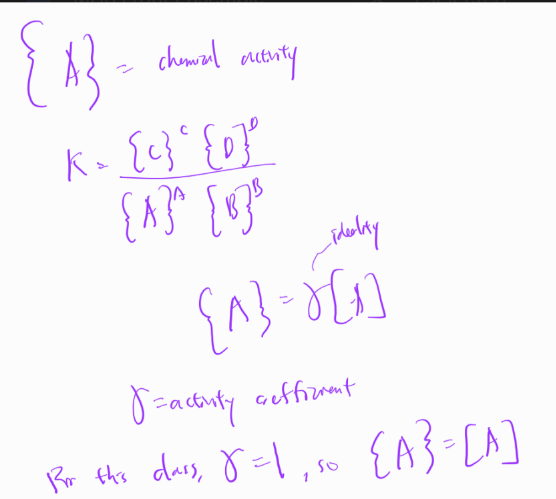
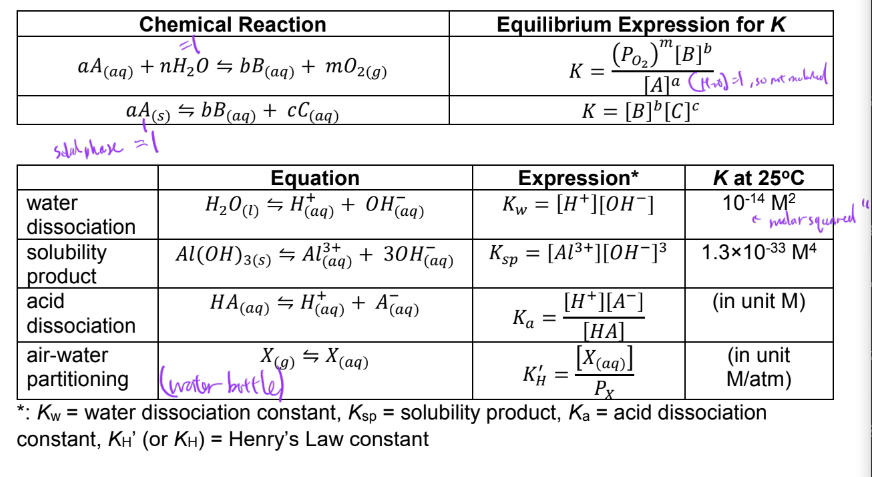
Law of Mass Action
law of mass action rules

EX. equilibrium expressions
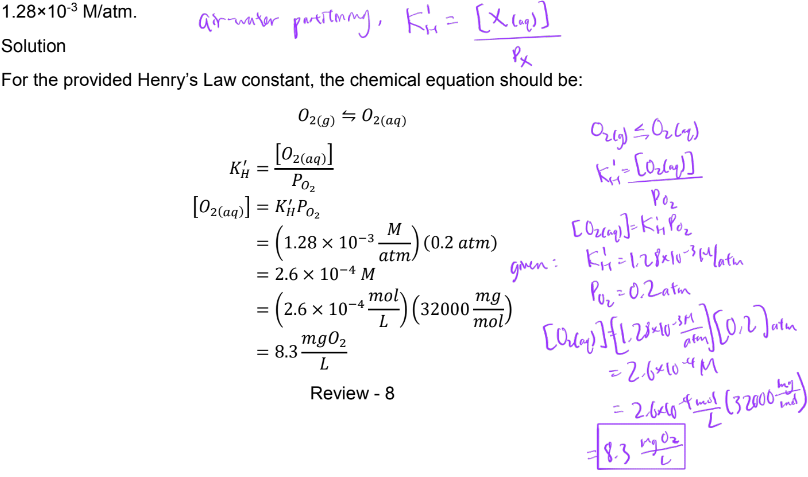
ex. determine concentration of dissolved oxygen in water at 25C in ambient atmosphere PO2 = 0.2 atm. Given Henry’s law constant for O2(g) is 1.28×10⁻³ M/atm
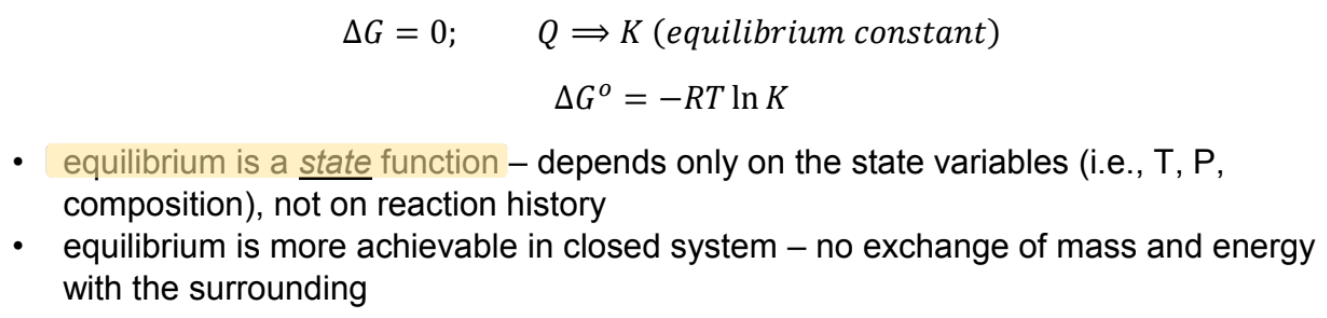
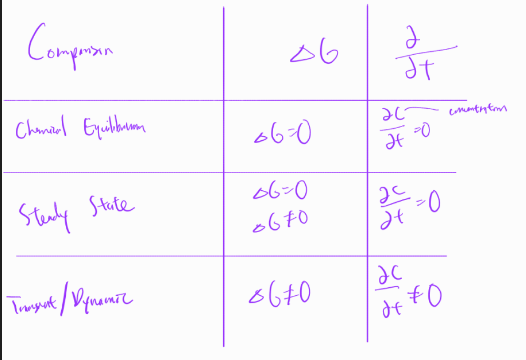
delta g and differential comparison
chemical speciation
different forms of the same species
ex.

speciation diagrams
identifies dominant or most abundant species as a function of system properties of characteristics (e.g. pH, pe) “choose most dominant to make assumptions”
constructed from chemical equilibrium constants (i.e. K’s)
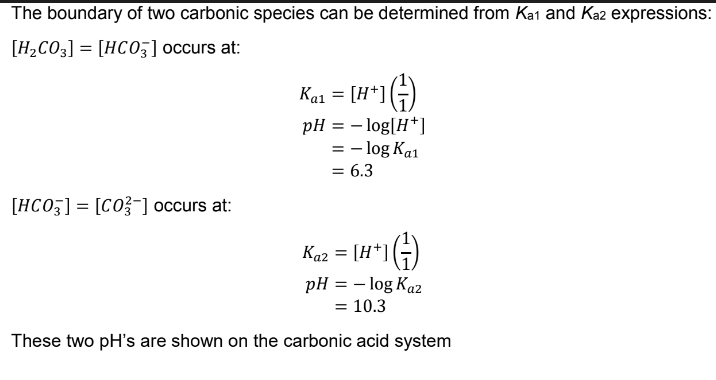
Ex. carbonic acid speciation diagram (H2CO3(aq))


Ex. Iron (Fe) speciation diagram

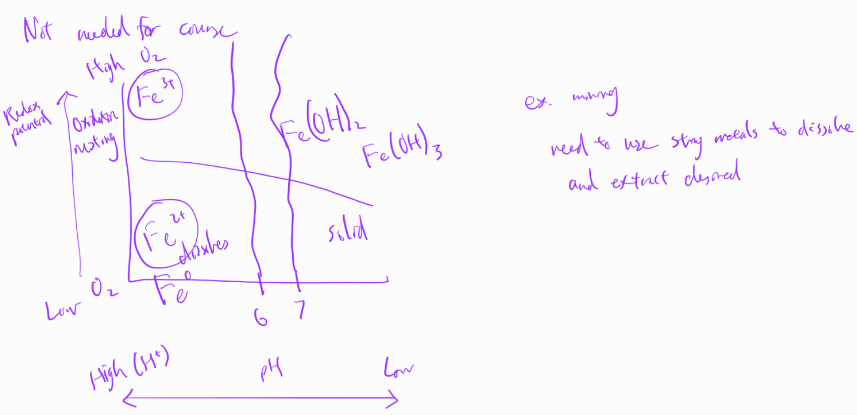

objectives of conventional water treatment
to treat water sufficiently clean for drinking (and other purposes)
conventional water treatment: convert raw water from natural sources to potable water
(different levels of cleanliness needed for different applications
when is water dirty?
has color, appears hazy
coarse particles
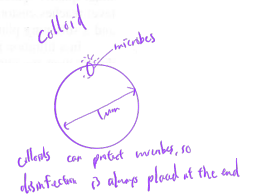
very fine sized particles (i.e. colloids “diameter less than 1 um”
polluted (with chemicals)
biological agents
what exactly is pollution?
organic pollutants, inorganic pollutants, others
dose/concentration and harm
mobility of pollutants
components in conventional water treatment system
preliminary screening
chemical mixing basin
flocculation basin
sedimentation basin
rapid sand filter
disinfection
storage and distribution
sludge treatment
basic water treatment diagram

7-step water treatment diagram

for water with high levels of hardness, softening of water can be one of main treatment objectives
groundwater - water in equilibrium with minerals of hard metals (e.g. Ca-, Mg-minerals)
minor modification of treatment operations:
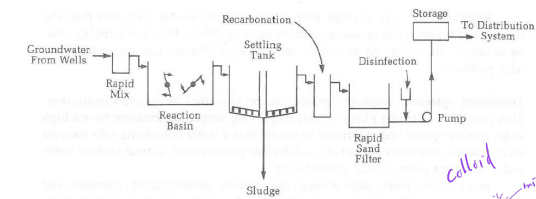
why disinfection is always placed at end of water treatment
colloids can protect microbes, so disinfection is placed at end, after colloids are broken down
organic matter examples
lipids, fats, carbohydrates, proteins
problems of oxygen demands
organic matter in water causing high oxygen demand
organic matter can degrade and consume dissolved oxygen
effluents with high organic matter have higher oxygen demand
these streams can harm aquatic life in receiving water bodies
(oxygen consumption exceeds supply, causing anaerobic conditions)
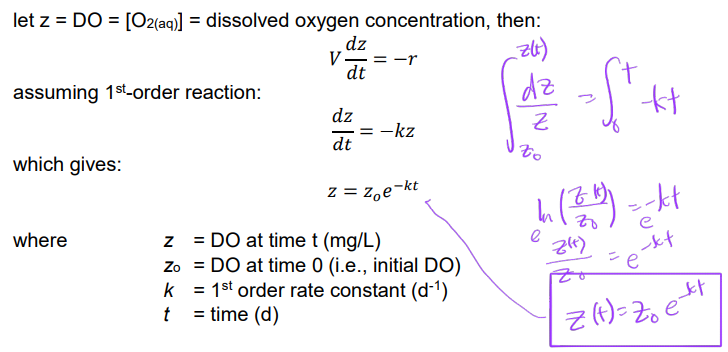
solubility of O2 in water
DO = Z = O2(aq)
essential for aquatic life
poorly soluble in water
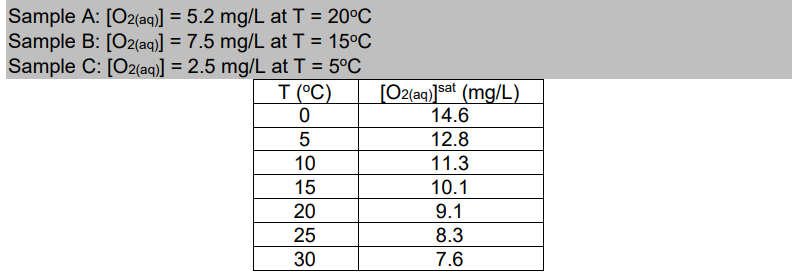
aqueous solubility of O2 in air at 1 atm in freshwater (salinity = 0%)
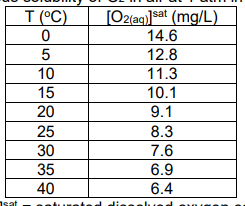
[O2(aq)]sat = saturated dissolved oxygen concentration
[O2(aq)]sat decreases with increasing temperature
methods to maintain good level of DO in water
a supply = demand problem
supply side - dissolution of atmospheric oxygen into water
demand side - organisms or matters that can use up oxygen
organisms need oxygen for energy (i.e. respiration)
organic matters: consume oxygen as they undergo oxidation
want to know the rate at which oxygen is being consumed = oxygen demand
types of oxygen demand
theoretical oxygen demand (ThOD)
Biochemical oxygen demand (BOD)
Chemical oxygen demand (COD)
Theoretical oxygen demand (ThOD) characteristics
calculated, theoretical value
need composition of organic materials (i.e. stoichiometry or elemental composition) e.g. glucose (C6H12O6), atrazine (C8H14IN5)
Theoretical oxygen demand (ThOD) definition
ThOD = oxygen demand for complete decomposition of organic matter into inorganic products:
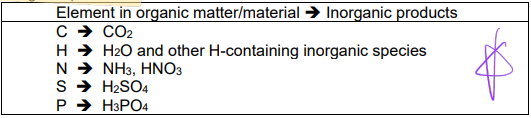

ThOD composition
C-ThCOD = oxygen demand due to decomposition of carbonaceous material
N-ThOD = oxygen demand due to decomposition of nitrogenous material
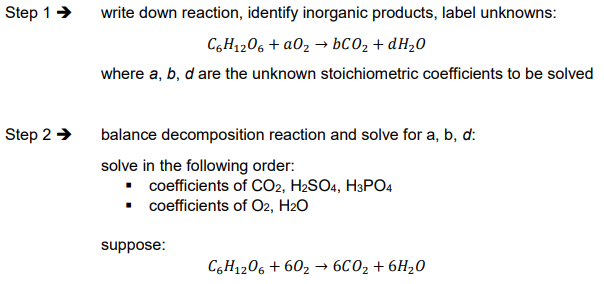
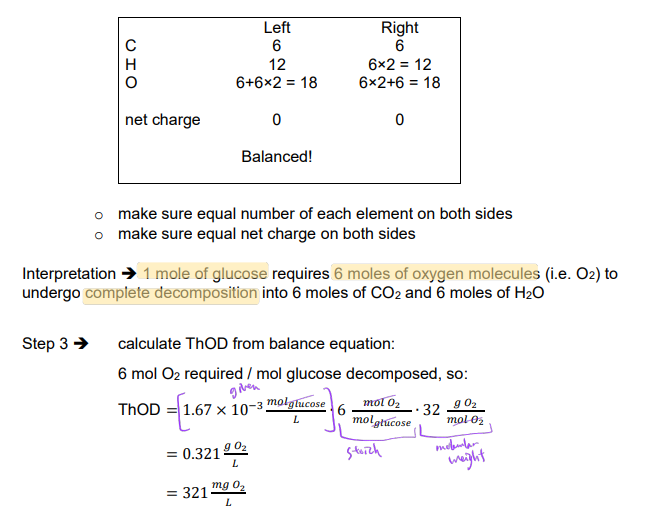
Ex. What is the ThOD for a 1.67 × 10⁻³ M solution of glucose (C6H12O6)?
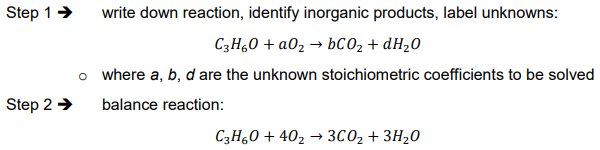
Ex. What is the ThCOD in liters of air for a 50 mg/L solution of acetone (CH3COCH3)?
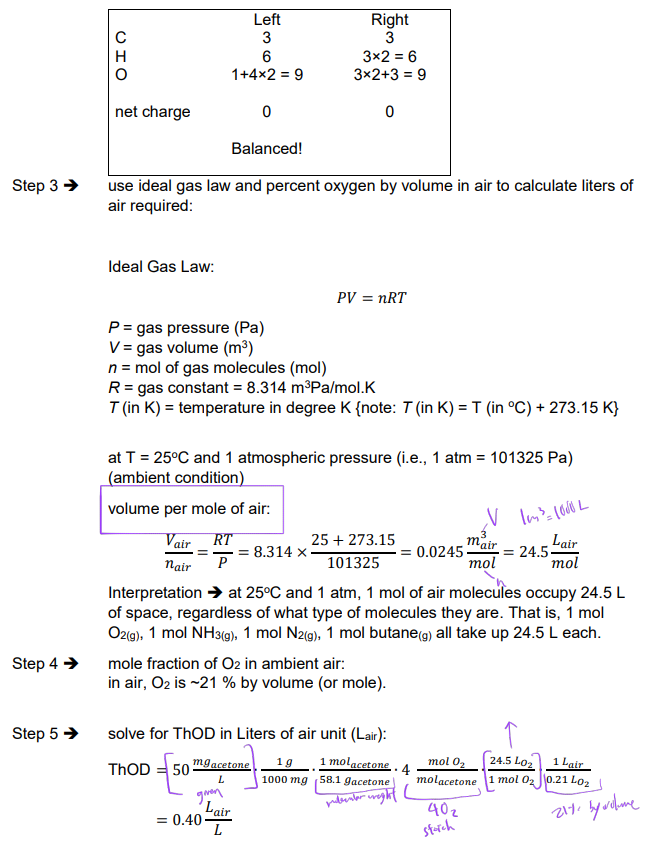
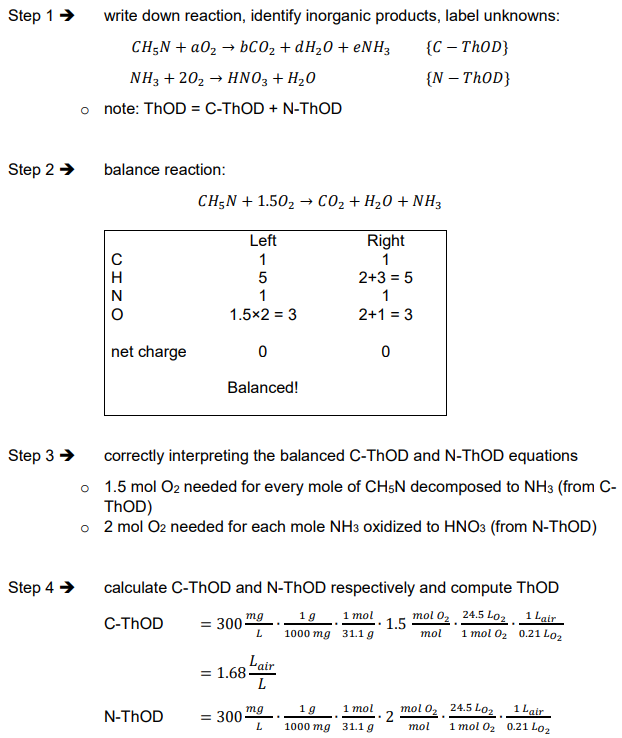
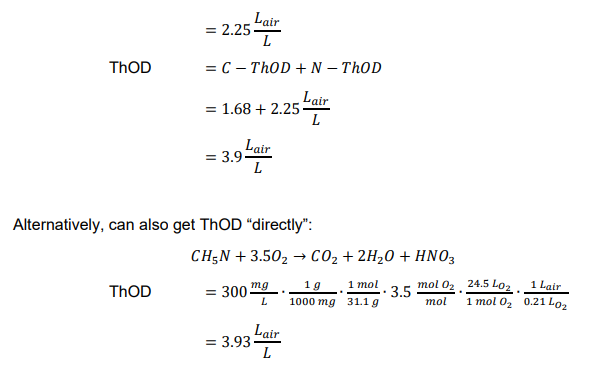
Ex. What is the ThOD in liters of air for a 300 mg/L solution of methylamine (CH3NH2)?
limitations of ThOD
ThOD calculation needs chemical formula of organic materials/wastes
organics in natural waters and wastewaters are mixture of different organic materials with unknown composition
need to measure oxygen demand, rather than calculate theoretically
use microbes that convert and mineralize organic matter to determine oxygen demand of given water sample
Biochemical oxygen demand (BOD)
measures oxygen use or potential use
measure O2 needed by microbes to degrade organic matter in a defined time
standard BOD test (BOD5)
run in dark at T = 20C for 5 days
algae may be present
algal growth can interfere BOD measurement by producing O2 via photosynthesis in presence of light
stndard BOD bottle (300 mL, non-reactive glass + glass stopper)
air-tight (prevent O2 influx)

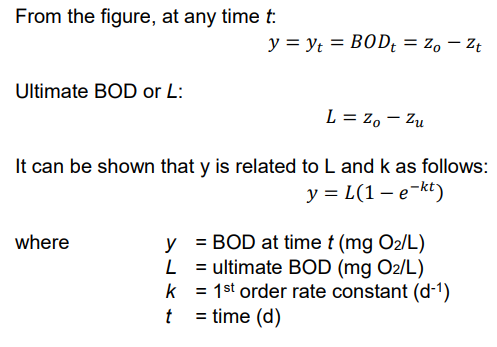
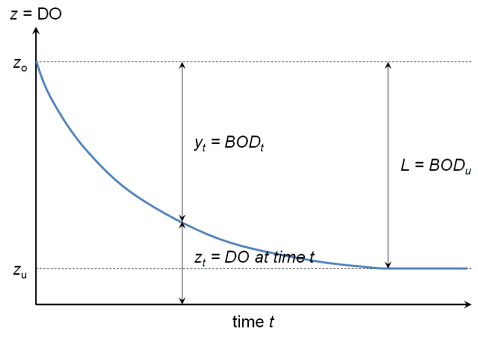
BOD5, BODt BODu (or L)
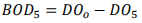
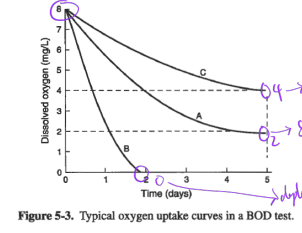
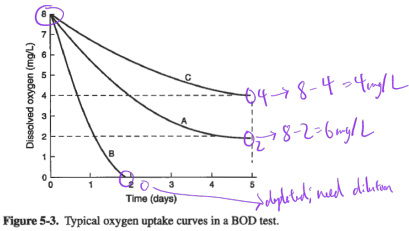
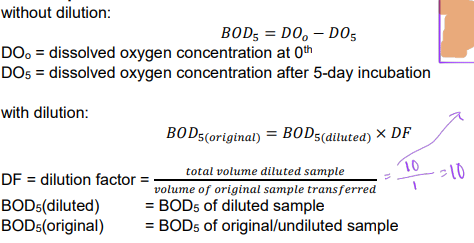
BOD5 = amount of O2 consumed in first 5 days = difference between initial DO and final DO attributed to decomposition of organic matter:
BODt (BOD after t-d of incubation):
BODU = ultimate BOD = L = BOD30:

Ex. Determine BOD for samples A, B, C, in figure below:
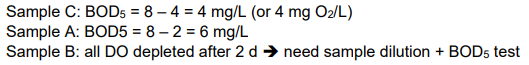
BOD5 with sample dilution:
Ex. water sample diluted into three solutions for BOD5 analysis. The volumes of the original sample and the dilution water are provided. Determine the dilution factors and BOD5 of original from three diluted samples
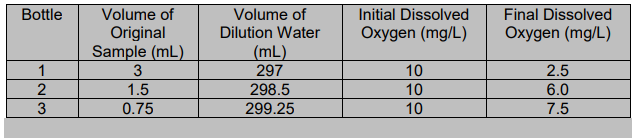

Estimated BOD of the original sample ranges from 750 to 1000 mgO2/L.
This example illustrates the problem of diluting samples with clean water, which is known as the “sliding scale” problem.
sliding scale problem and seed solution
previous example illustrates the need to seed samples with microbes
using clean water for diluting water sample can lead to measurements artifacts or biases
want to seed the sample with microbes to ensure a baseline decomposing capacity is present
seeding – the process in which decomposing microorganisms are added to the BOD bottle with the sample to ensure aerobic degradation of organic materials will occur
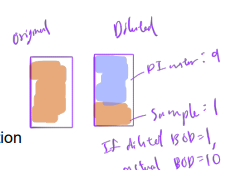
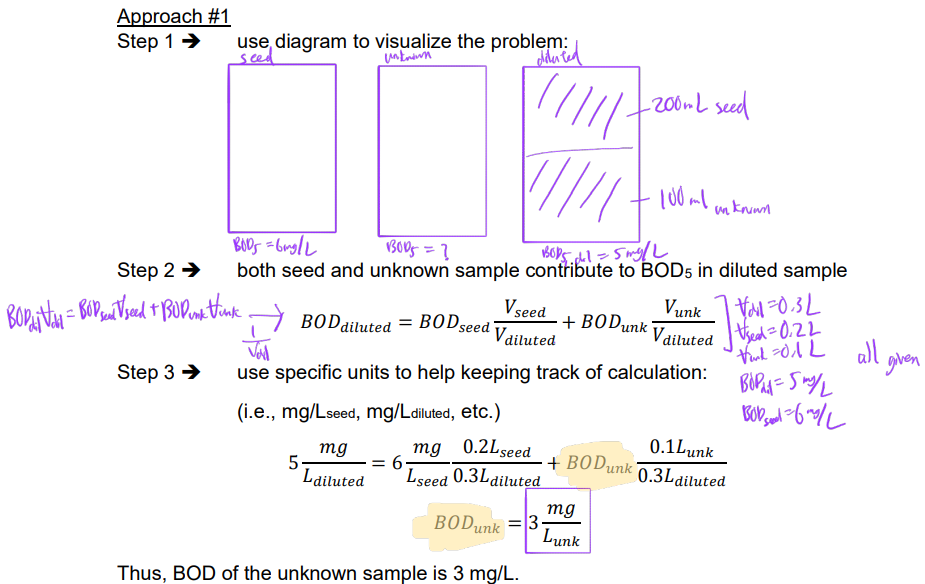
Ex. An unknown sample is diluted with a seed solution prior to standard BOD5 analysis. The seed solution has a BOD5 of 6 mg/L. A diluted sample is prepared by mixing 100 mL of the unknown sample with 200 mL of the seed solution. The diluted sample is found to have a BOD5 of 5 mg/L. Determine BOD5 of the original unknown solution.


Kinetics of BOD
DO changes with time during BOD test
mass balance of DO in BOD bottle:
rate of change DO = rates of (IN - OUT + PRODUCED - CONSUMED)
BOD is closed system, no exchange of DO (IN/OUT = 0)
BOD in dark, no photosynthesis, no O2 produced (PRODUCTION = 0)
CONSUMPTION of DO occurs:
rate of change in DO = - rate of DO consumed
BOD figure (DO vs time)
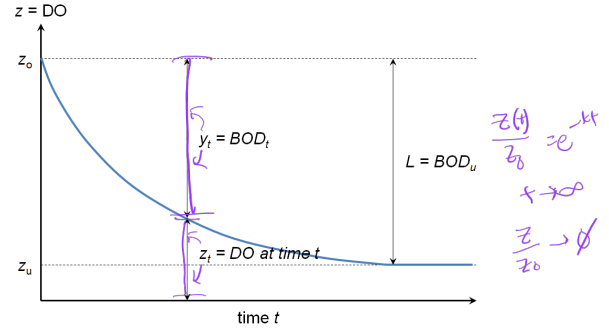
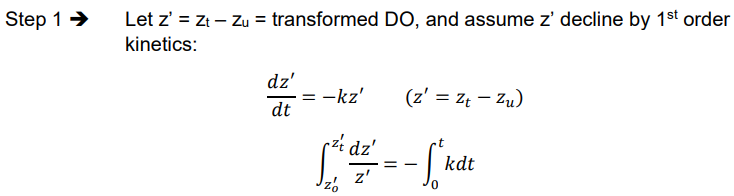
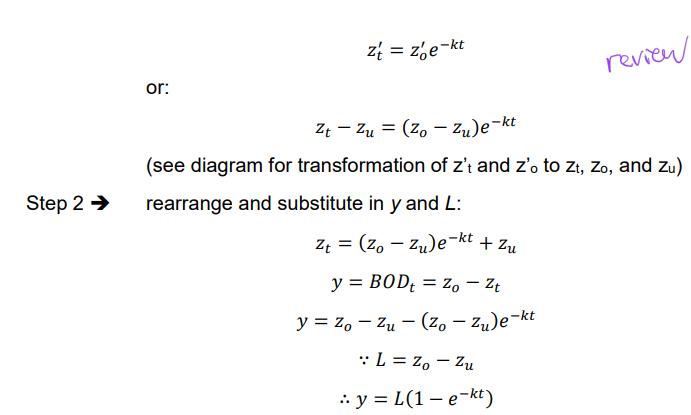
Ex. Derivation of y = L(1 - e-kt)
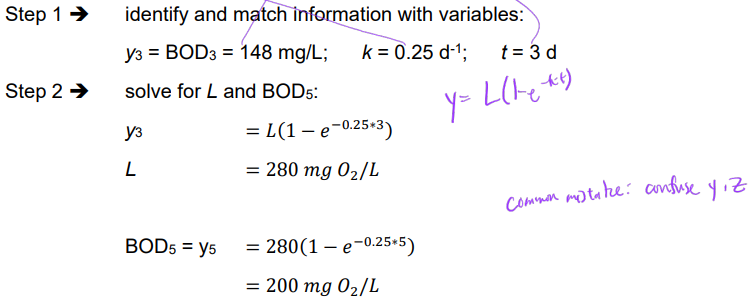
Ex. Determine BOD5 if BOD3 = 148 mg/L and a deoxygenation rate constant of 0.25 d-1 may be assumed
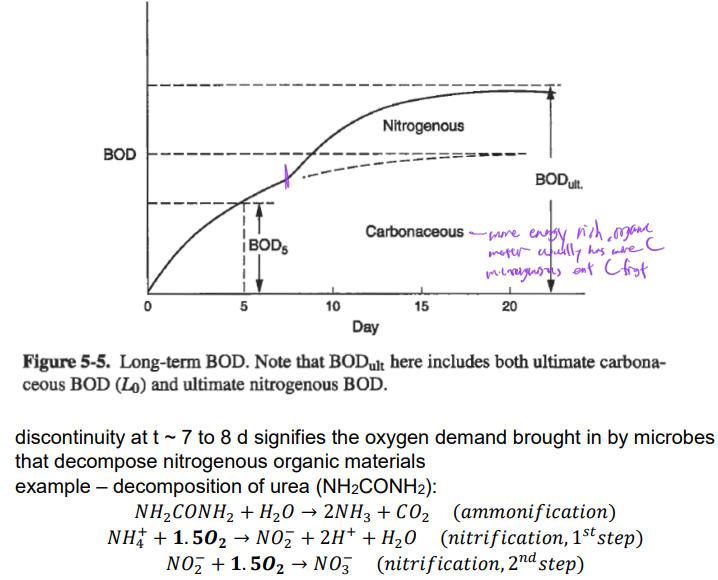
Extending BOD incubation beyond 5 d will bring in a change in total BOD curve
Limitations of BOD measurements: low BOD reflects -
low organic content in water
microbes present incapable of consuming organic materials present
inactive microbes (dead, dying, dormant, etc.)
Chemical oxygen demand (COD)
quick measurement that quantifies (potential oxygen demand)
better than BOD, which takes 5 days to complete
Standard COD test procedure
sample mixed with a strong chemical oxidizing agent (K2Cr2O7) in the presence of a strong acid (H2SO4) and then heated
COD reflected as consumption of K2Cr2O7
chemicals oxidize all organic matter (both biodegradable and non-biodegradable)
thus, COD > BOD
Interpretation of COD test results
COD results are more consistent; ready in 3 hours
COD may also be used to estimate BODu and to indicate the presence of biologically resistant organics
result after organic waste is released into streams
organic waste oxidized - exerting oxygen demand on receiving water
transport along stream (physical process)
oxygen resupplied to stream (dissolution of atmospheric O2)
if O2 reaeration rate < O2 consumption rate, [O2(aq)] = DO = z will decline
when [O2(aq)] is totally depleted, stream is anaerobic
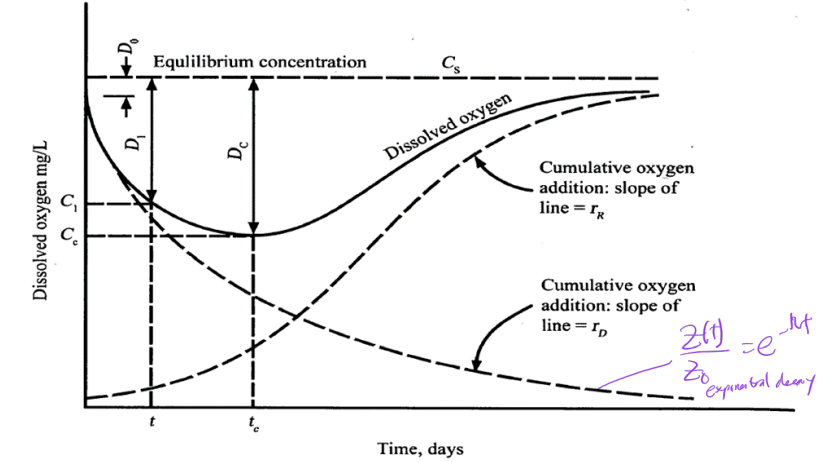
oxygen sag curve
tracking DO or [O2(aq)] over the length of the stream following the introduction of organic waste

Dissolved oxygen (DO) vs Oxygen Deficit (D)
DO not the same as D

Time vs dissolved oxygen
Ex. Determine oxygen deficit for the following water samples:
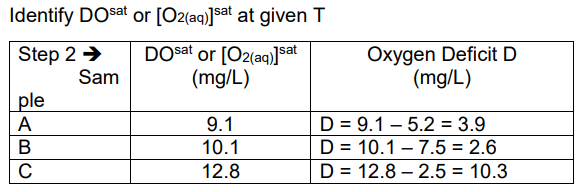
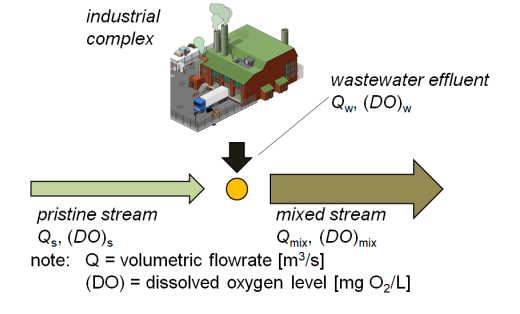
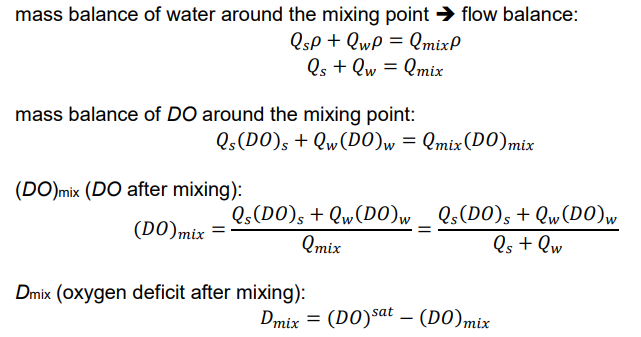
DO and D after waste introduced into a stream (DO and D immediately after mixing point?)
suppose organic-rich effluent introduced into pristine stream: