MGMT 421 - UNIT 1
 Call Kai
 Learn
Learn Practice Test
 Spaced Repetition
 Match
Match Flashcards
 Knowt Play
1/31

Name | Mastery | Learn | Test | Matching | Spaced | Call with Kai | Chat |
|---|
No analytics yet
Send a link to your students to track their progress
32 Terms
Data Analytics
What is the practice of examining prepared data to uncover valuable insights and guide decision-making?
Data Visualization
What is the practice of graphically representing data to help people see and understand patterns, insights and other discoveries hidden inside information?
Data Storytelling
What discipline translates seeing into meaning by weaving a narrative around data to answer questions and support decision-making?
Florence Nightingale
Which 19th-century woman is best known as the founder of modern nursing, for her work during the Crimean War and for using the Polar Area Diagram?
Charles Minard
Who created the famous flow map depicting Napoleon’s 1812 Russian campaign, widely regarded as one of the greatest examples of data visualization?
John Snow
Which 19th-century physician created the famous map of cholera cases in London, helping to identify contaminated water as the source of the outbreak?
William Playfair
Who is credited with inventing modern statistical graphics, including the line chart, bar chart, and pie chart, in the late 18th century?
Joseph Priestley
made a visual timeline showing the rise and fall of civilizations, empires, and nations. It reflected his belief that history could be studied as patterns of progress and decline.
Statistics definition
is the methodology of extracting
useful information from a data set.
To do good statistical analysis, you must:
1. Find the right data.
2. Use the appropriate statistical tools.
3. Clearly communicate the numerical information into
written language.
Two branches of statistics
1. Descriptive statistics
Collecting, organizing, and presenting the data. (Summarizing)
2. Inferential statistics
Drawing conclusions about a population based on sample data from that population.
Population
Consists of all items of interest.
Sample
A subset of the population.
sample statistic
is calculated from the sample data and is
used to make inferences about the unknown population
parameter.
Structured data
Data that has a well-defined length and format.
• Numbers, dates, groups of words and numbers (strings), and so on.
Unstructured data
Data that does not conform to a predefined row-column format.
• Reports, emails, multimedia, and so on.
Big data
Massive volume of data that is difficult to manage, process, and analyze
using traditional tools.
variable
the general characteristic being observed on objects of interest.
• Types of variables
• Qualitative: gender, race, political affiliation.
• Quantitative: test scores, age, weight.
Discrete
Continuous
Discrete
A discrete variable assumes a countable number of distinct values.
• Examples: Number of children in a family, number of points scored in a
basketball game.
Continuous
A continuous variable can assume an uncountable number of values
within an interval.
• Examples: Weight, height, time, investment return.
Qualitative variables versus quantitative variables:
Qualitative variables use labels or names to categorize.
• Nominal
• Ordinal
Quantitative variables assume meaningful numeric values.
• Interval
• Ratio
The Nominal Scale
The least sophisticated level of measurement.
• Data are simply categories for grouping the data.
Ordinal Scale
Ordinal data may be categorized and ranked with respect to some characteristic or trait.
• For example, instructors are often evaluated on an ordinal scale
(excellent, good, fair, poor).
• Differences between categories are meaningless because the actual numbers used may be arbitrary.
• There is no objective way to interpret the difference between instructor
quality.
The Interval Scale
• Data may be categorized and ranked with respect to some characteristic or trait.
• Differences between interval values are meaningful.
• Thus the arithmetic operations of addition and subtraction are meaningful.
• No “absolute 0” or starting point defined.
• Meaningful ratios may not be obtained.
• The differences between scale values are meaningful.
• For example, consider the Fahrenheit scale of temperature.
• This scale is interval because the data are ranked and differences (+ or −) may be obtained
there is no “absolute 0”.
Ratio Scale
The strongest level of measurement.
• Ratio data may be categorized and ranked with respect to
some characteristic or trait.
• Differences between interval values are meaningful.
• There is an “absolute 0” or defined starting point.
• Zero does mean “the absence of …”
• Thus, meaningful ratios may be obtained.
• General examples measured on a ratio scale: weight, time, and distance.
• Business examples: sales, profits, and inventory levels.
• Unlike qualitative data, arithmetic operations are valid on interval- and ratio-scaled
values.
pth percentile
pth percentile divides a data set into two
parts:
1. Approximately p percent of the observations have values less than the
pth percentile.
2. Approximately (100 − p) percent of the observations have values greater
than the pth percentile.
• The median is also called the 50th percentile

boxplot (box-and-whisker plot)
allows you to:
• Graphically display the distribution of a data set.
• Compare two or more distributions.
• Identify outliers in a data set.

Measures of dispersion include:
• Range.
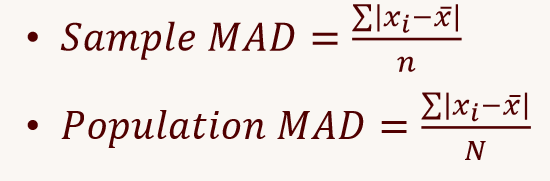
• Mean absolute deviation (MAD).
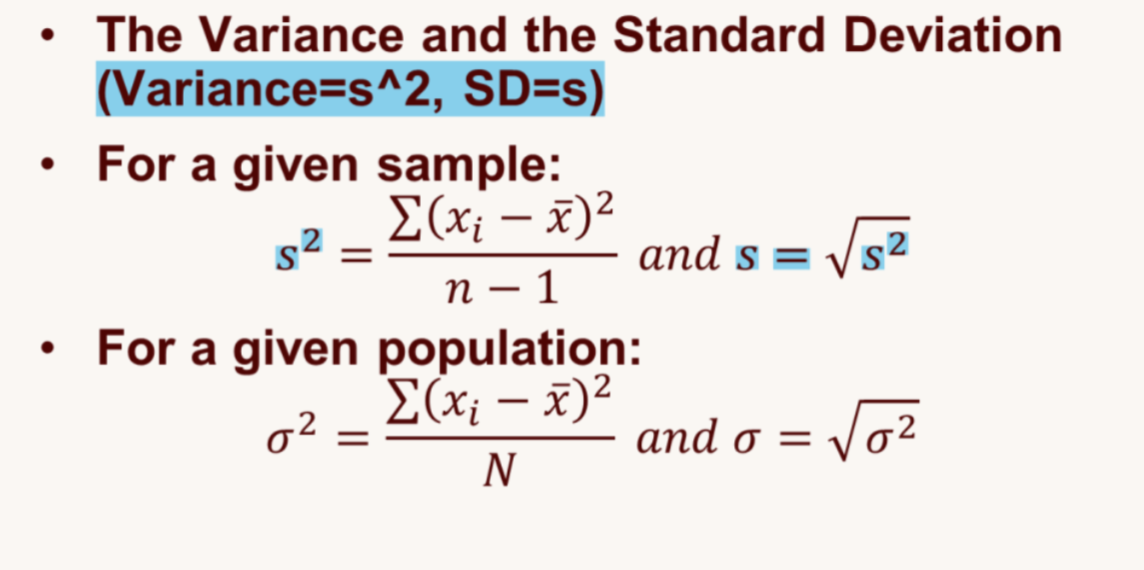
• Variance and standard deviation.
• Coefficient of variation (CV}
• Mean absolute deviation (MAD).
avg of absolute (think absolute value) differences btwn the observations and the mean
the variance and standard deviation
relative location / empirical rule

z scores
