2- Transport across cell membranes
1/40
There's no tags or description
Looks like no tags are added yet.
Name | Mastery | Learn | Test | Matching | Spaced |
|---|
No study sessions yet.
41 Terms
Describe the fluid-mosaic model of membrane structure
molecules free to move laterally in phospholipid bilayer
many components- phospholipids, proteins, glycoproteins and glycolipids
What are the components of a cell membrane?
phospholipids form a bilayer
proteins
glycoproteins
glycolipids
cholesterol
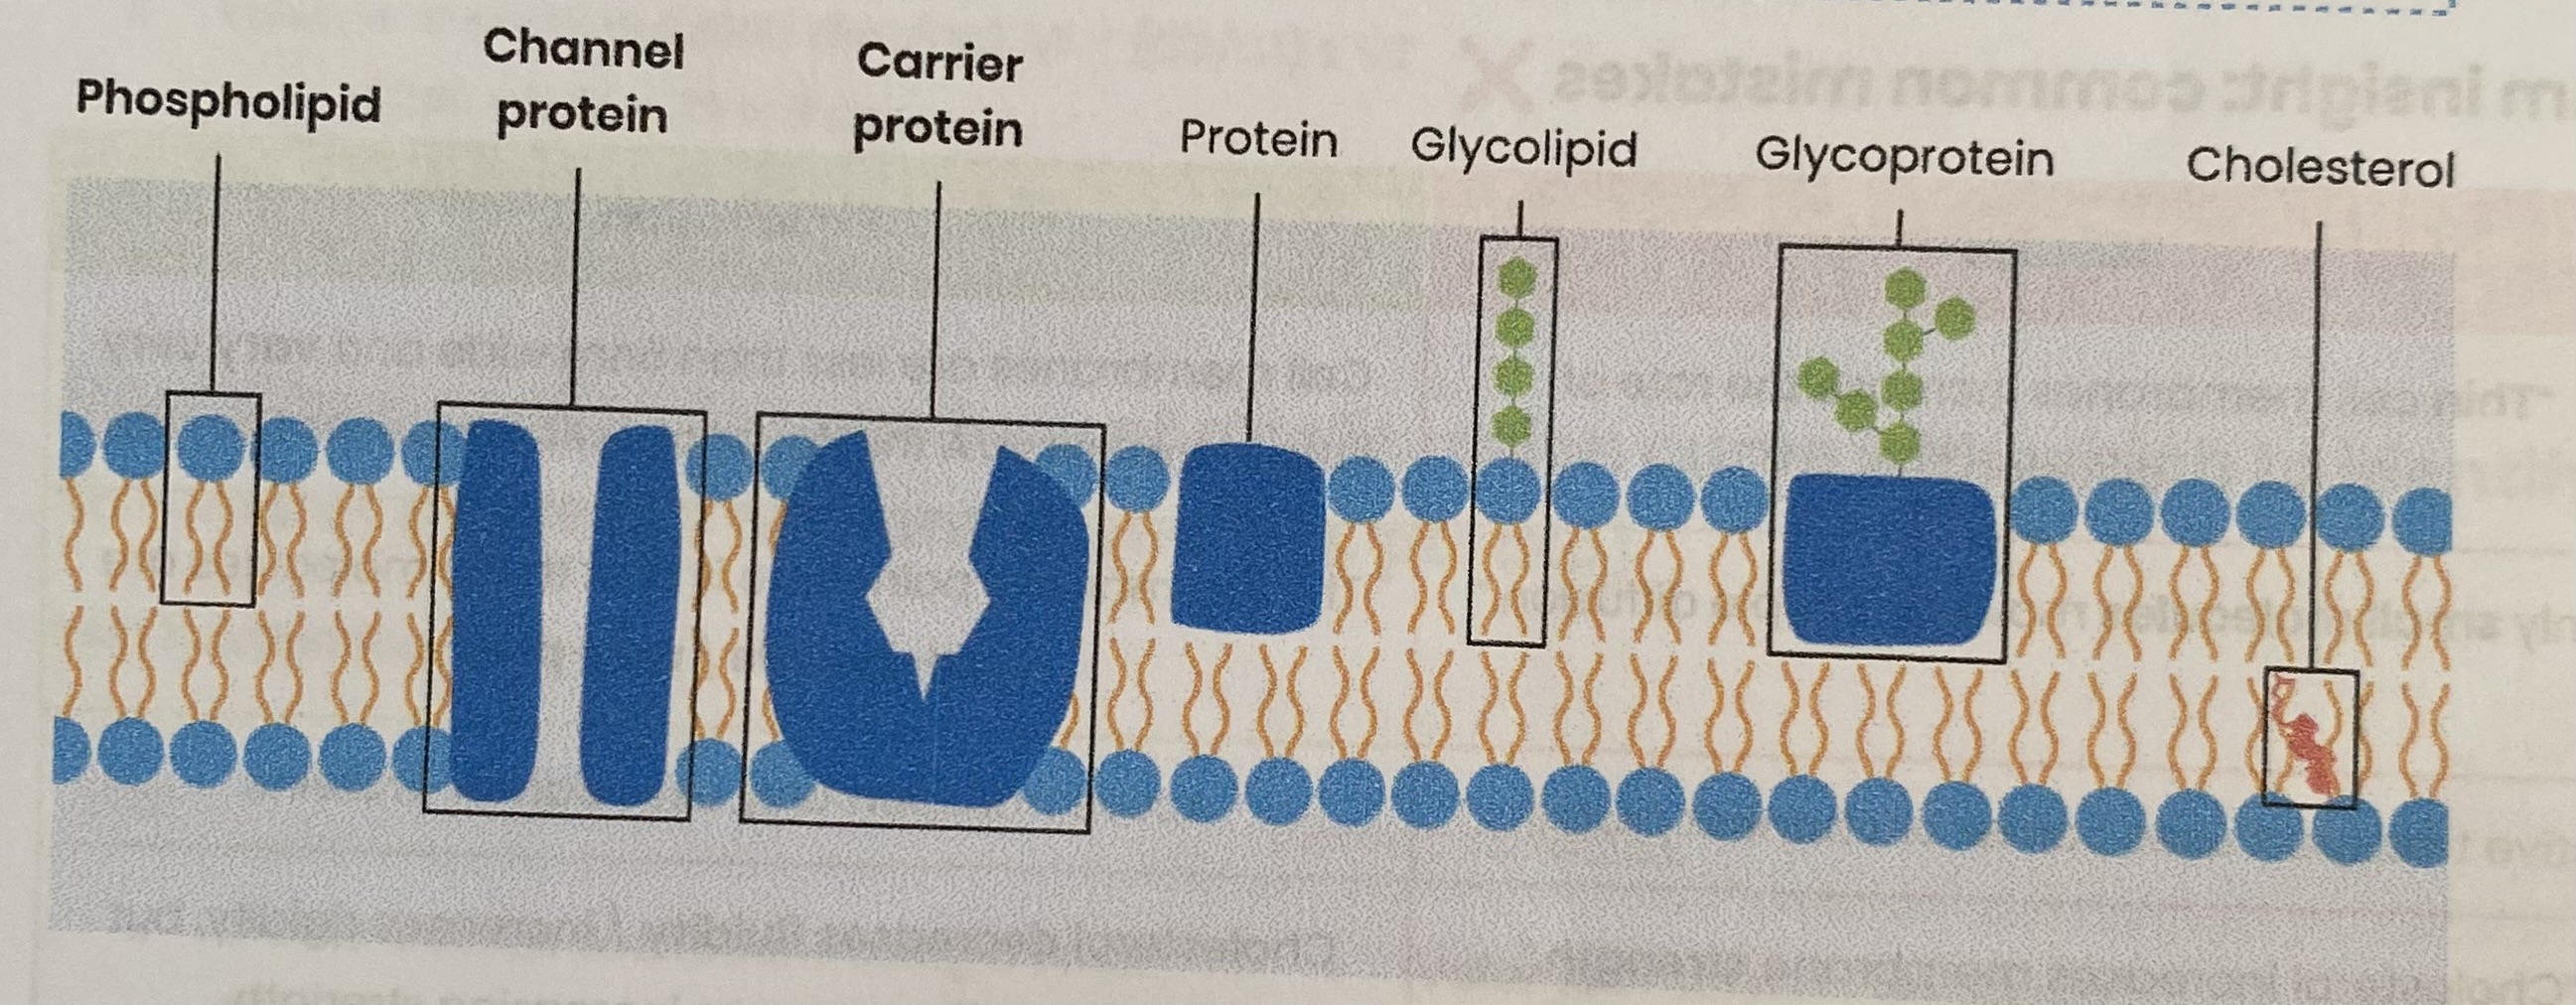
Describe the arrangement of phospholipids in a cell membrane
fatty acid tails face inwards, phosphate heads face outwards
Describe the arrangement of proteins in a cell membrane
Intrinsic proteins span bilayer e.g. channel and carrier proteins
Extrinsic proteins on surface of membrane
Describe the arrangement of glycolipids in a cell membrane
(lipids with polysaccharide chains attached) found on exterior surface
Describe the arrangement of glycoproteins in a cell membrane
(proteins with polysaccharide chains attached) found on exterior surface
Describe the arrangement of cholesterol in a cell membrane
(sometimes present) bonds to phospholipid hydrophobic fatty acid tails
Explain the arrangement of phospholipids in a cell membrane
Bilayer, with water present on either side
Hydrophobic fatty acid tails repelled from water so point away from water/ to interior
Hydrophilic phosphate heads attracted to water so point to water
Explain the role of cholesterol (sometimes present) in cell membranes
Restricts movement of other molecules making up membrane
so decreases fluidity(and permeability)/ increases rigidity
Suggest how cell membranes are adapted for other functions
Phospholipid bilayer is fluid= membrane can bend for vesicle formation/ phagocytosis
Glycoproteins/ glycolipids act as receptors/ antigens= involved in cell signalling/ recognition
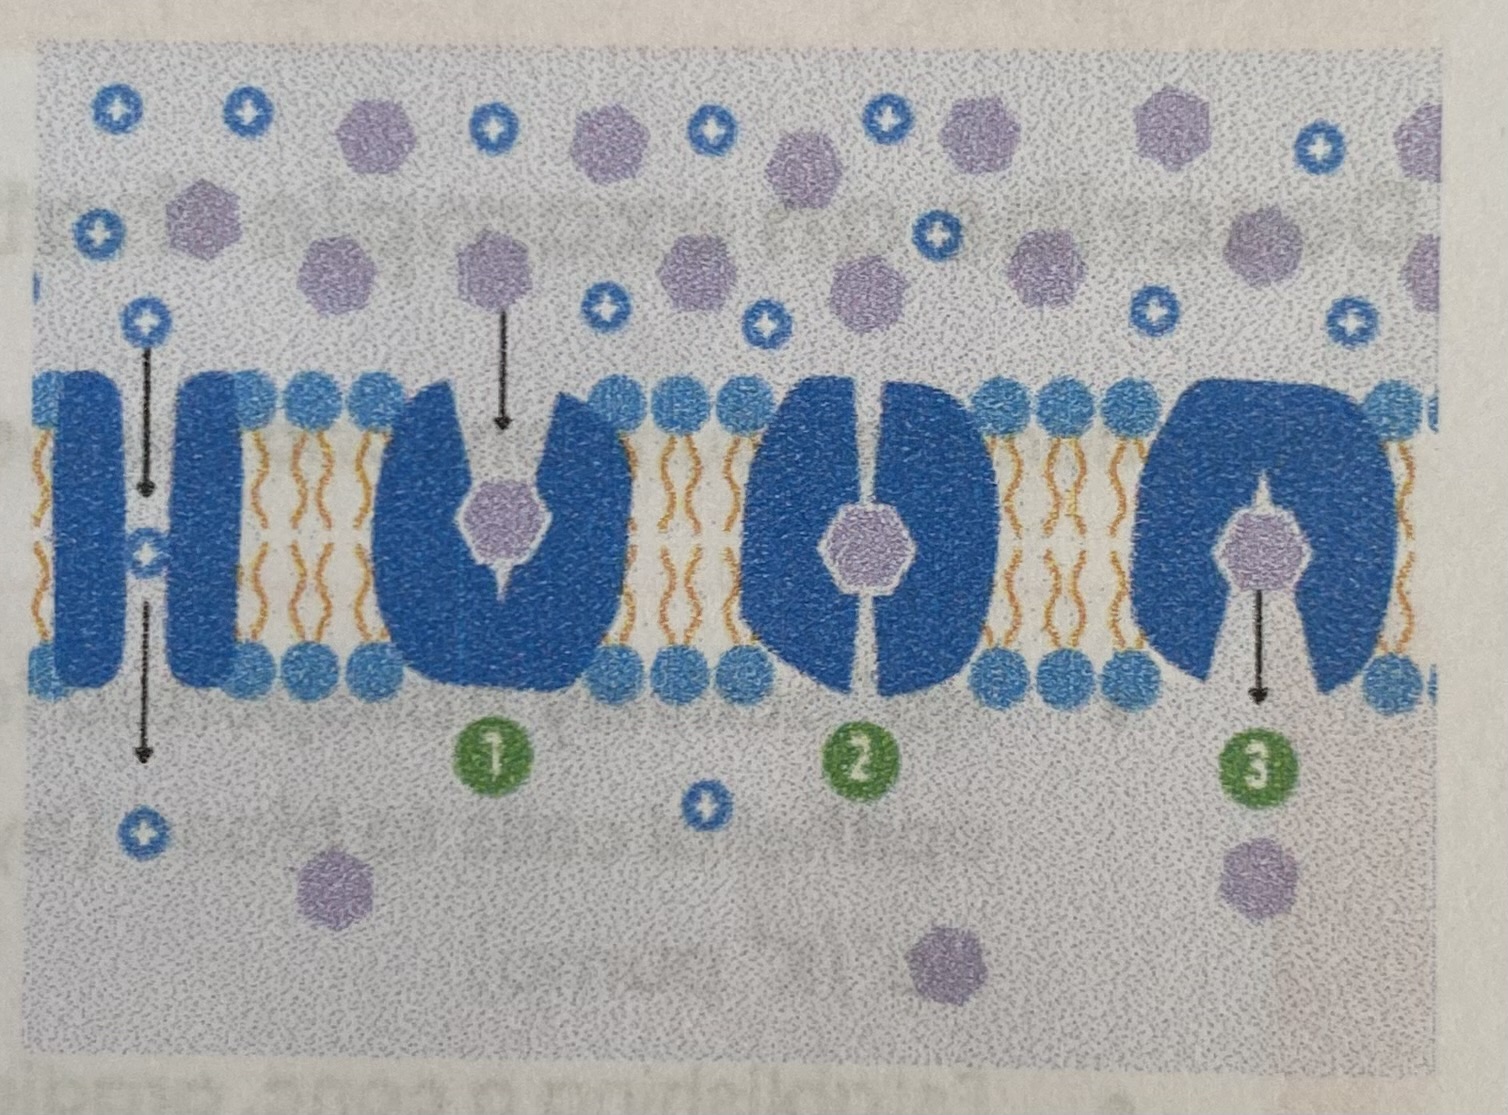
Describe how movement across membranes occurs by simple diffusion
Lipid- soluble (non-polar) or very small substances e.g. O2, steroid hormones
Move from an area of higher conc. to an area of lower conc. down a conc. gradient
Across phospholipid bilayer
Passive- doesn’t require energy from ATP/ respiration (only kinetic energy of substances)
Explain the limitations imposed by the nature of the phospholipid bilayer
Restricts movement of water soluble (polar) & larger substances e.g. Na+/ glucose
Due to hydrophobic fatty acid tails in interior of bilayer
Describe how movement across membranes occurs by facilitated diffusion
Water-soluble (polar)/ slightly larger substances
Move down a conc gradient
Through specific channel/ carrier proteins
Passive- doesn’t require energy from ATP/ respiration (only kinetic energy of substances)
Explain the role of carrier and channel proteins in facilitated diffusion
Shape/ charge of protein determines which substances move
Channel proteins facilitate diffusion of water-soluble substances
Hydrophilic pore filled with water
May be gated- can open/ close
Carrier proteins facilitate diffusion of (slightly larger) substances
Complementary substance attaches to binding site
Protein changes shape to transport substance
Describe how movement across membranes occurs by osmosis
Water diffuses/ moves
From an area of high to low water potential/ down a water potential gradient
Through a partially permeable membrane
Passive- doesn’t require energy from ATP/ respiration (only kinetic energy of substances)
Increasing solute conc decreases water potential
Describe how movement across membranes occurs by active transport
Substances move from area of lower to higher conc/ against a conc gradient
Requiring hydrolysis of ATP and specific carrier proteins
Describe the role of carrier proteins and the importance of the hydrolysis of ATP in active transport
Complementary substance binds to specific carrier protein
ATP binds, hydrolysed into ADP + Pi, releasing energy
Carrier protein changes shape, releasing substance on side of higher concentration
Pi released= protein returns to original shape
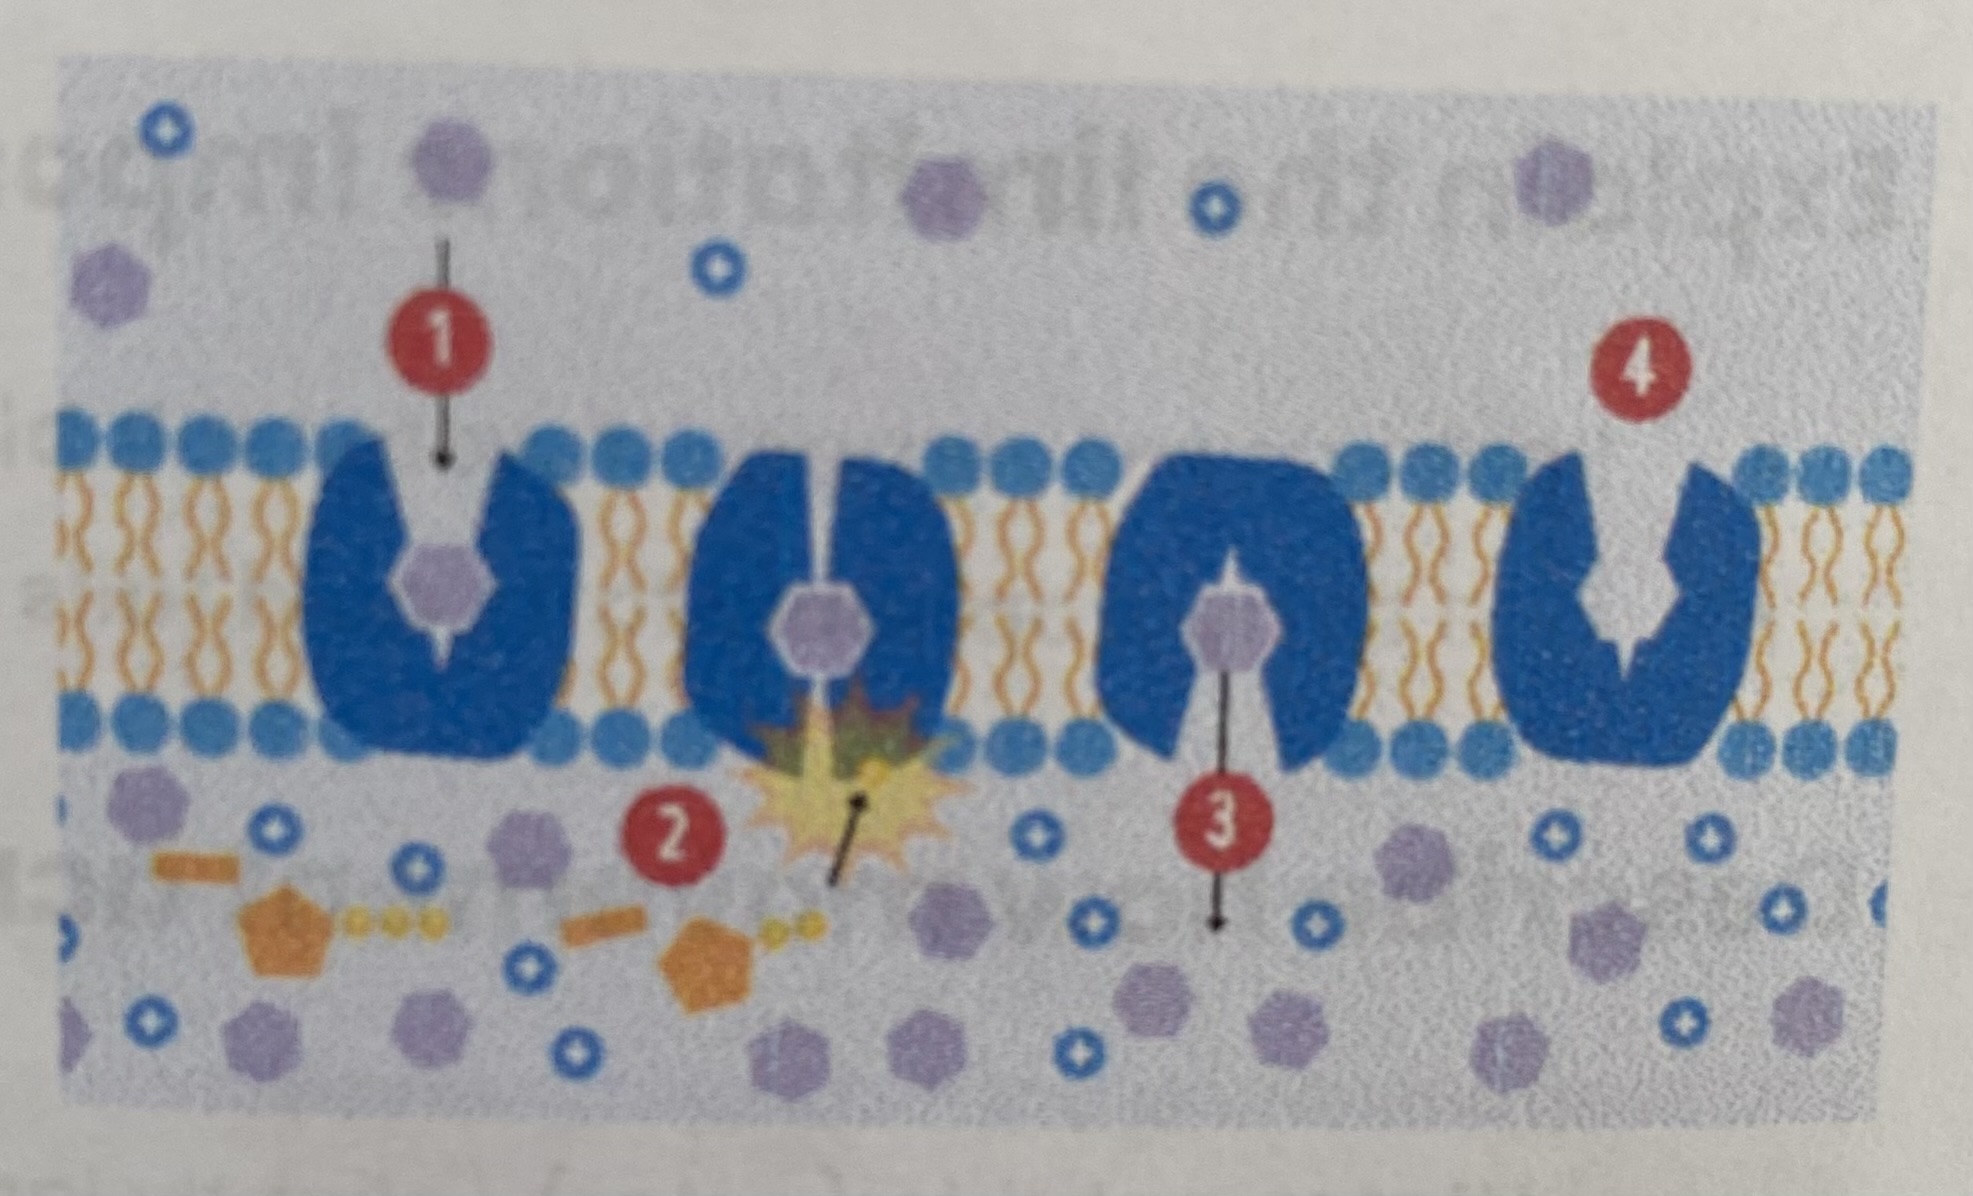
Describe how movement across membranes occurs by co-transport
2 different substances bind to and move simultaneously via a co-transport protein (type of carrier protein)
Movement of one substance against its conc gradient is often coupled with the movement of another down its conc gradient
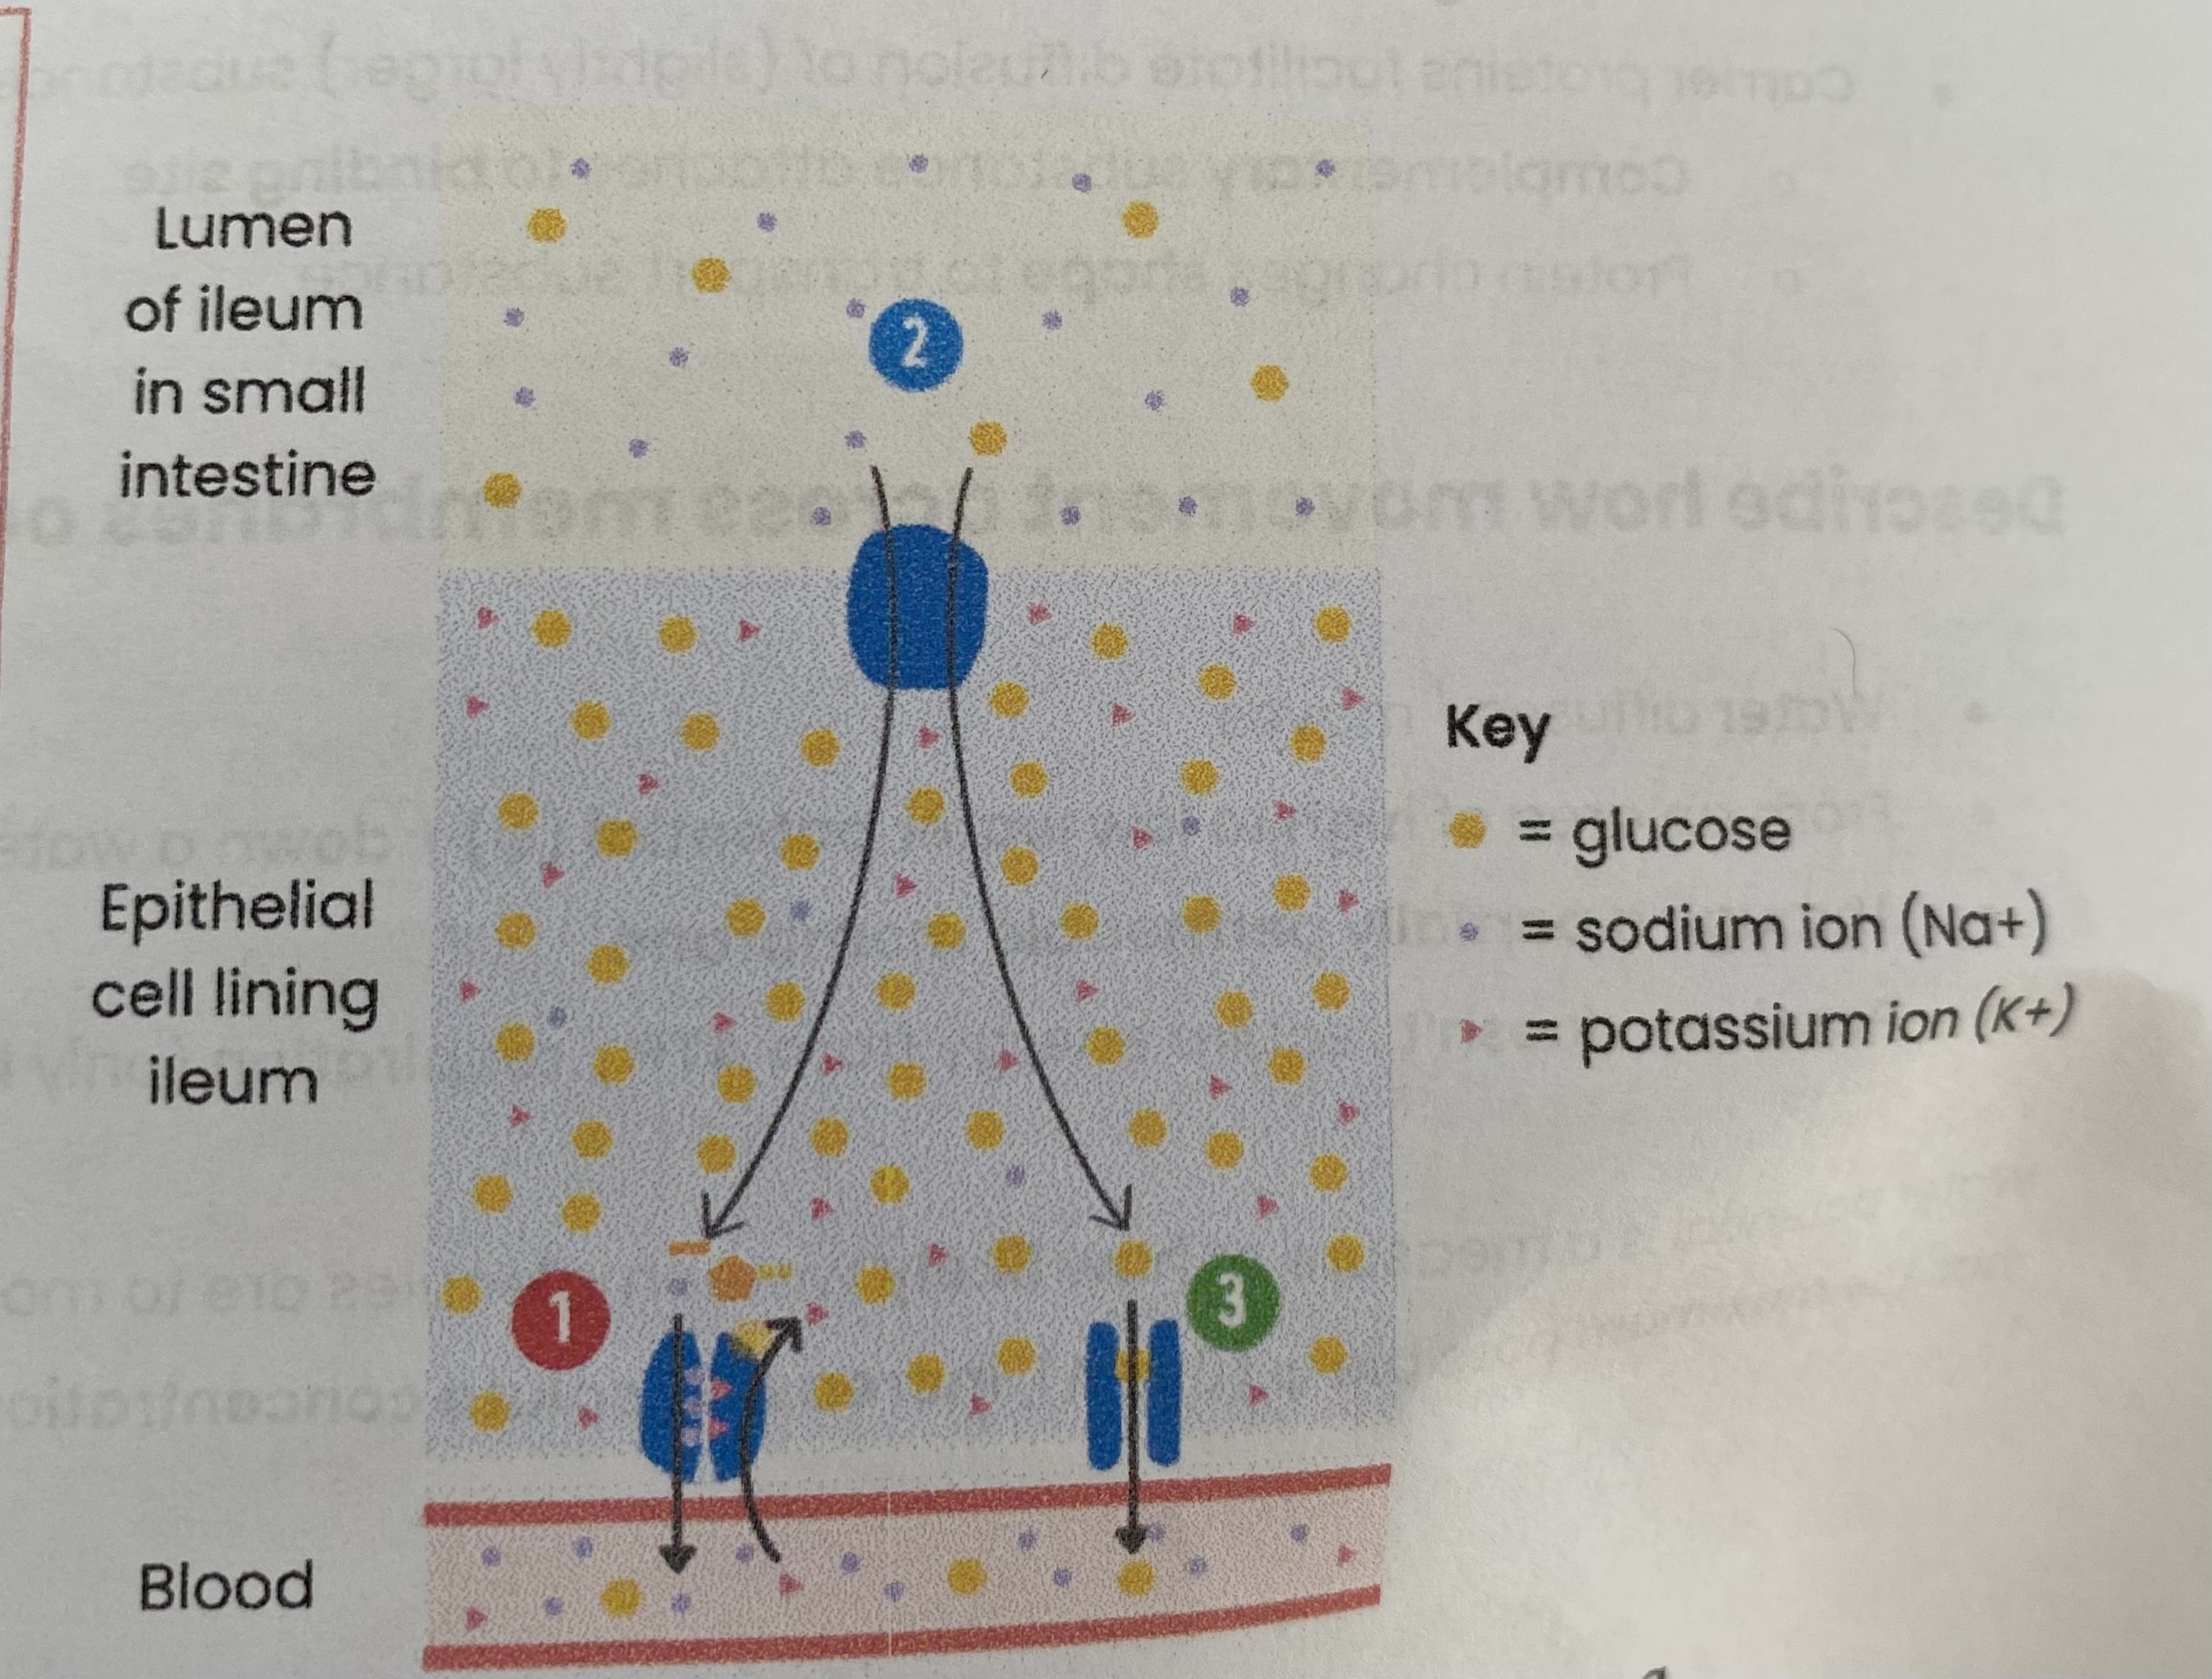
Describe an example that illustrates co-transport
ABSORPTION OF SODIUM IONS AND GLUCOSE/ AMINO ACIDS BY CELLS LINING THE ILEUM:
Na+ actively transported from epithelial cells to blood (by Na+ pump), establishing a conc gradient of Na+ (higher in lumen than epithelial cell)
Na+ enter epithelial cell down its conc gradient with glucose against its conc gradient via co-transport protein
Glucose moves down a conc gradient into blood via facilitated diffusion
Describe how surface area, number of channel or carrier proteins and differences in gradients of conc or water potential affect the rate of movement across cell membranes
Increasing surface area of membrane= increased rate of movement
Increasing number of channel/ carrier proteins= increased rate of facilitated diffusion/ active transport
Increasing conc gradient= increased rate of simple/ facilitated diffusion and osmosis
Increasing conc gradient= increased rate of facilitated diffusion
until number of channel/carrier proteins becomes a limiting factor as all in use/ saturated
Increasing water potential gradient= increased rate of osmosis
Explain the adaptations of some specialised cells in relation to the rate of transport across their internal and external membranes
Membrane folded e.g. microvilli in ileum= increase in SA
More protein channels/ carriers= for facilitated diffusion (or active transport- carrier proteins only)
Large number of mitochondria= make more ATP by aerobic respiration for active transport
RP3- What is RP3?
Production of a dilution series of a solute to produce a calibration curve with which to identify the water potential of plant tissues
RP3- Describe how to calculate dilutions
C1 x V1= C2 x V2
C1= conc of stock solution
V1= volume of stock solution used to make new conc
C2= conc of solution you are making
V2= volume of new solution you are making
V2= V1 + volume of distilled water to dilute with
RP3- Describe a method to produce a calibration curve with which to identify the water potential of plant tissue (e.g. potato) (part 1)
COLLECTING DATA:
Create a series of dilutions using a 1 mol dm-3 sucrose solution (0.0, 0.2, 0.4, 0.6, 0.8, 1.0)
Use scalpel/ cork borer to cut potato into identical cylinders
Blot dry with a paper towel and measure/ record initial mass of each piece
Immerse one chip in each solution and leave for a set time (20-30 mins) in a water bath at 30^C
Blot dry with a paper towel and measure/ record final mass of each piece
Repeat (3+ times) at each conc.
RP3- What are the control variables for steps 1-5?
Volume of solution
Size, shape and surface area of plant tissue, source of plant tissue e.g. variety or age
Blot dry to remove excess water before weighing
Length of time in solution, temperature, regularly stir/ shake to ensure all surfaces exposed
Blot dry to remove excess water before weighing
RP3- Describe a method to produce a calibration curve with which to identify the water potential of plant tissue (e.g. potato) (part 2)
PROCESSING DATA:
Calculate % change in mass= (final- initial mass)/ initial mass
Plot a graph with conc on x axis and % change in mass on y axis (calibration curve)
Must show positive and negative regions
Identify conc where line of best fit intercepts x axis (0% change)
Water potential of sucrose solution= water potential of potato cells
Use a table in a textbook to find the water potential of that solution
RP3- Why calculate % change in mass?
Enables comparison/ shows proportional change
As plant tissue samples had different initial masses
RP3- Why blot dry before weighing?
Solution on surface will add to mass (only want to measure water taken up or lost)
Amount of solution on cube varies (so ensure same amount of solution on outside)
RP3- What are the changes in plant tissue mass when placed in different concs of solute?
increase in mass
decrease in mass
no change
RP3- Explain the changes in plant tissue mass when places in different concs of solute
Increase in mass:
water moved into cells by osmosis
as water potential of solution higher than inside cells
Decrease in mass:
water moved out of cells by osmosis
as water potential of solution lower than inside cells
No change:
no net gain/loss of water by osmosis
as water potential of solution= water potential of cells
RP4- What is RP4?
Investigation into the effect of a named variable on the permeability of cell-surface membranes
RP4- Describe a method to investigate the effect of a named variable (e.g. temperature) on the permeability of cell-surface membranes
Cut equal sized/ identical cubes of plant tissue (e.g. beetroot) of same age/ type using a scalpel
Rinse to remove pigment released during cutting or blot on paper towel
Add same number of cubes to 5 different test tubes containing same volume of water (e.g. 5cm³)
Place each test tube in a water bath at a different temp (e.g. 10, 20, 30, 40, 50^C)
Leave for same amount of time
Remove beetroot and measure intensity of colour of surrounding solution:
Semi-quantitatively- Use a known conc of extract & distilled water to prepare a dilution series. Compare results with colour standards to estimate conc
Quantitatively- Measure absorbance (of light) of a known conc using a colorimeter. Draw a calibration curve- plot graph of absorbance (y) against conc of extract (x) and draw a line/ curve of best fit. Absorbance value for sample read off calibration curve to find associated extract conc
RP4- What are the issues with comparing to a colour standard?
Matching to colour standards is subjective
Colour obtained may not match any of colour standards
RP4- Why wash the beetroot before placing it in water?
Wash off any pigment on surface
To show that release is only due to (named variable)
RP4- Why regularly shake each test tube containing cubes of plant tissue?
To ensure all surfaces of cubes remain in contact with liquid
To maintain a conc gradient for diffusion
RP4- Why control the volume of water?
Too much water would dilute the pigment so solution will appear lighter/ more light passes through in colorimeter than expected
so results are comparable
RP4- How could you ensure beetroot cylinders were kept at the same temperature throughout the experiment?
Take readings in intervals throughout experiment of temperature in tube using a digital thermometer/ temperature sensor
Use corrective measure if temperature has fluctuated
RP4- What does a high absorbance suggest about the cell-membrane?
more permeable/ damaged
as more pigment leaks out making surrounding solution more concentrated (darker)
RP4- Explain how temperature affects permeability of cell-surface membranes
As temp increases, permeability increases
Phospholipids gain kinetic energy and fluidity increases
Transport proteins denature at high temps as H bonds break, changing tertiary structure
At very low temps, permeability increases
Ice crystals can form which pierce the cell membrane and increase permeability
RP4- Explain how pH affects permeability of cell-surface membranes
High or low pH increases permeability
Transport proteins denature as H/ ionic bonds break, changing tertiary structure
RP4- Explain how lipid-soluble solvents (e.g. alcohol) affects permeability of cell-surface membranes
As conc increases, permeability increases
Ethanol may dissolve phospholipid bilayer (gaps form)